
Earlier today, the U.S. currency moved higher after the Commerce Department showed that durable goods orders fell less than expected in January. Additionally, core durable goods orders (without transportation items) rose 1.1% in January, well above forecasts for a 0.3% decline (it was also the largest increase since May). Despite these positive numbers, the greenback gave up the gains and reversed after Federal Reserve Chair Janet Yellen testimony to the Senate banking committee in Washington. What impact did it have on major currency pairs? If you want to know our take on this question, we invite you to read our today's Forex Trading Alert.
In our opinion the following forex trading positions are justified - summary:
- EUR/USD: short (a stop-loss order: 1.3773, a downside price target: 1.3600)
- GBP/USD: none
- USD/JPY: none
- USD/CAD: none
- USD/CHF: none
- AUD/USD: none
EUR/USD
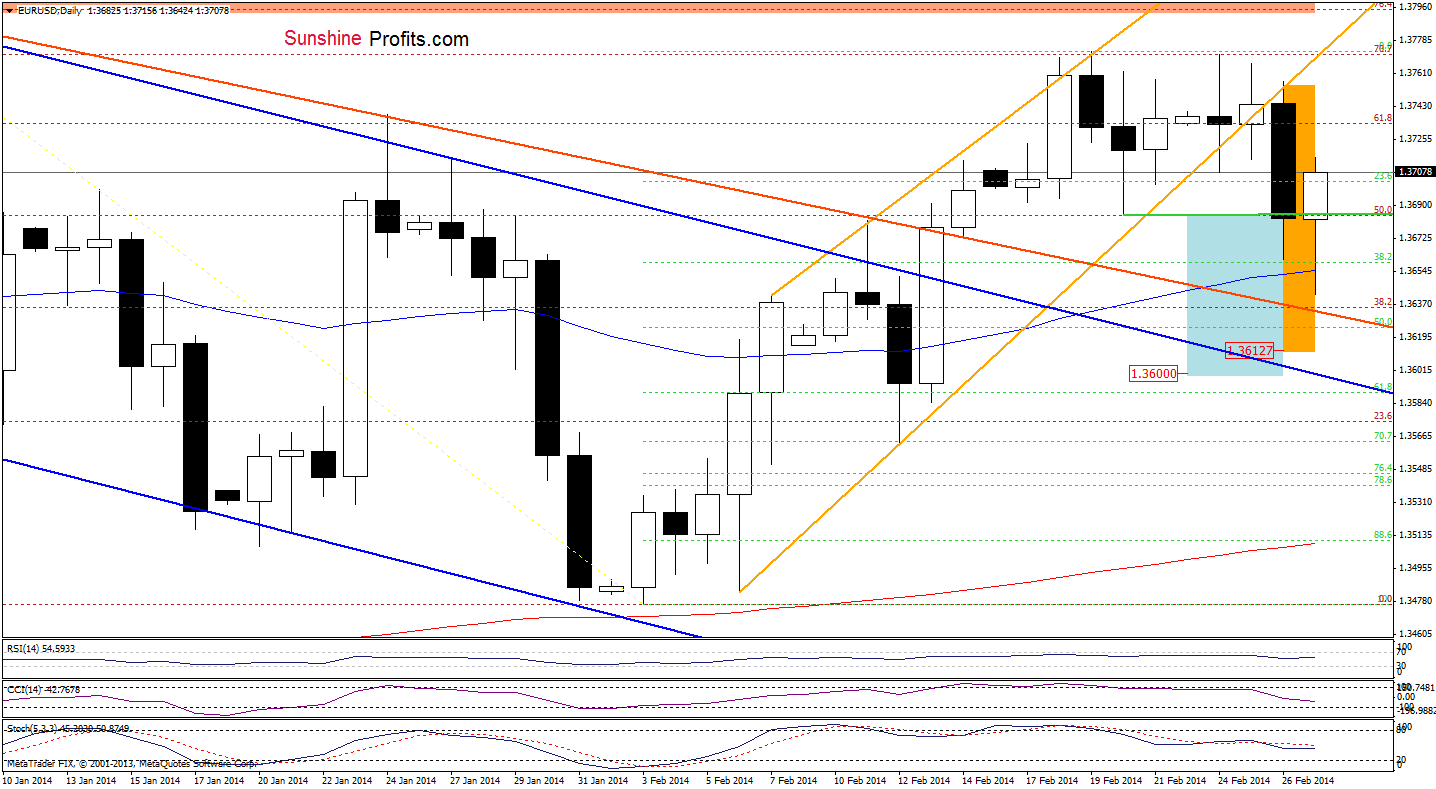
Earlier today, EUR/USD extended its decline and approached the short-term declining line (marked with red). The proximity to this support encouraged buyers to act and the pair rebounded sharply, erasing most of yesterday’s losses. Despite this increase, the exchange rate remains below the previously-broken lower border of the rising trend channel and sell signals generated by the indicators are still in play. From this perspective, it seems that as long as there is no invalidation of the breakdown, another attempt to move lower should not surprise us.
Very short-term outlook: mixed
Short-term outlook: mixed
MT outlook: mixed
LT outlook: bearish
Trading position (short-term; our opinion): Short. A stop-loss order: 1.3773 and a downside price target: 1.3600. We will keep you informed should anything change, or should we see a confirmation/invalidation of the above.
GBP/USD
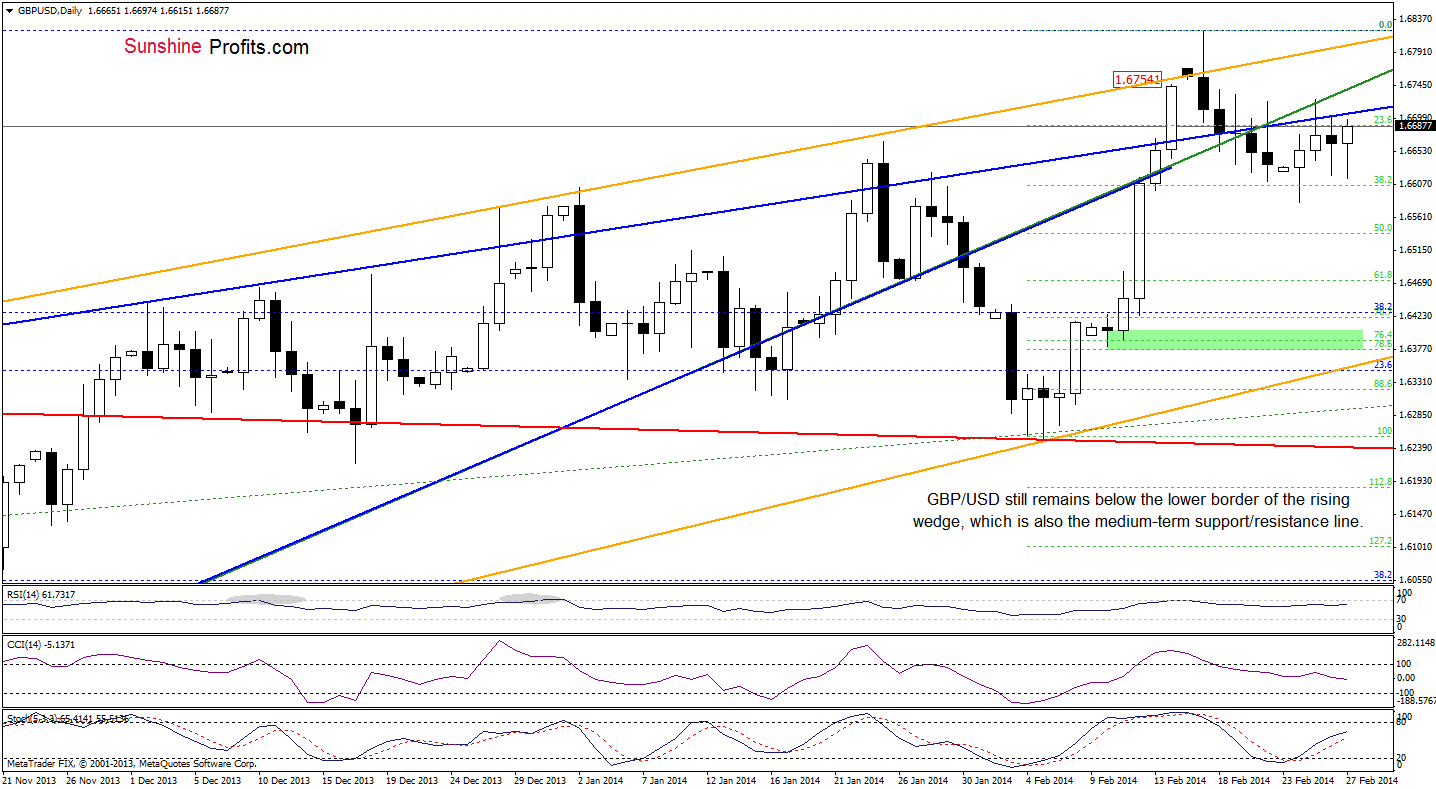
As you see on the above chart, although GBP/USD extended its decline, the proximity to the 38.2% Fibonacci retracement encouraged buyers to trigger a corrective upswing earlier today. With this upward move, the pair approached yesterday’s high and the upper line of the rising wedge. If this resistance zone is broken, we may see further improvement and the first target for the buyers would be the medium-term resistance line (marked with green). However, if this resistance area encourages sellers to act, we will likely see another attempt to reach the 38.2% Fibonacci retracement. From this perspective, the situation is unclear – especially when we take into account the fact that the CCI and Stochastic Oscillator move in opposite directions.
Very short-term outlook: mixed
Short-term outlook: mixed
MT outlook: mixed
LT outlook: mixed
Trading position (short-term): In our opinion no positions are justified from the risk/reward perspective at the moment as the current situation is unclear. We will keep you informed should anything change, or should we see a confirmation/invalidation of the above.
USD/JPY
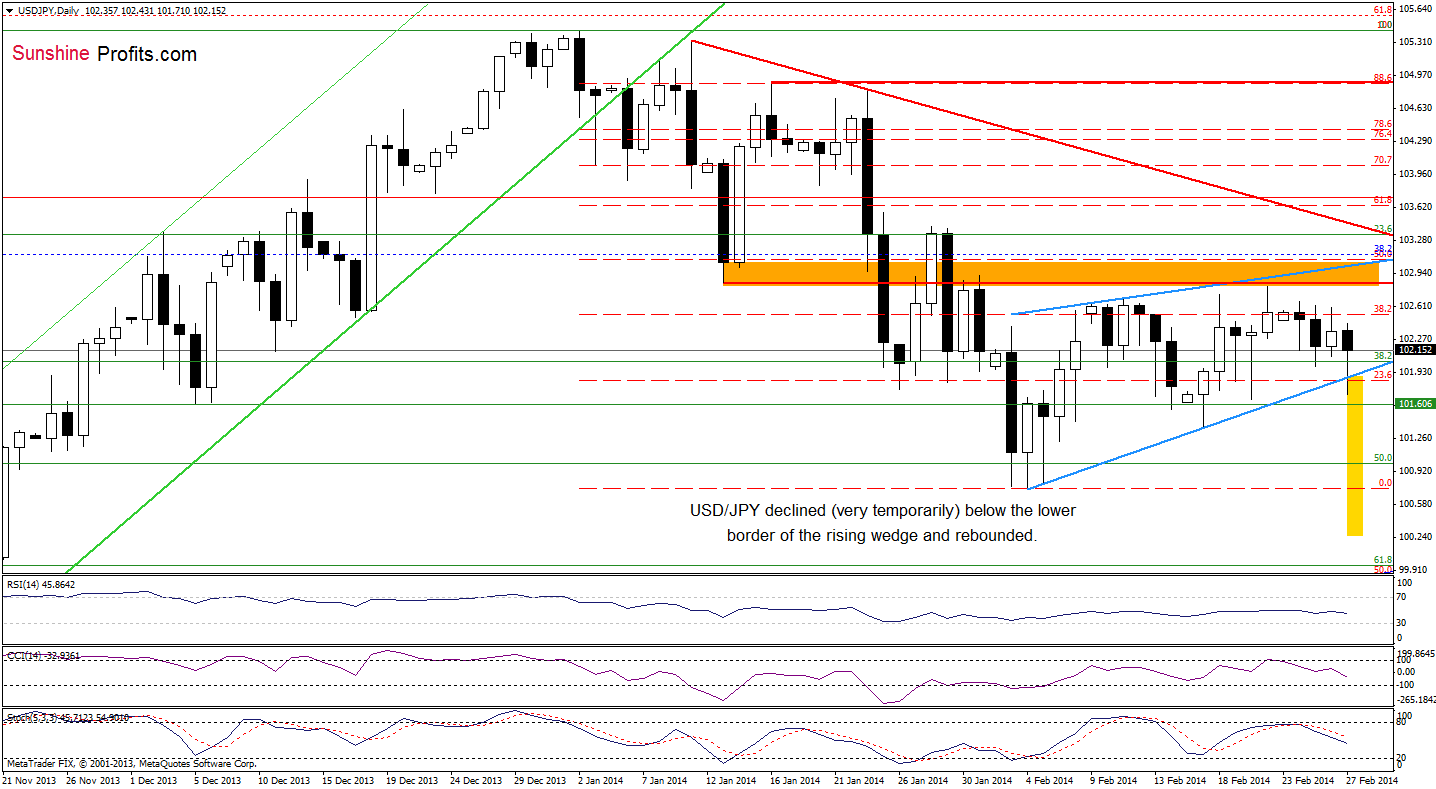
Earlier today, the situation has deteriorated slightly as USD/JPY slipped below the lower border of the rising wedge (marked with light blue). However, as it turned out in the following hours, this deterioration was only temporary and the pair rebounded quickly. With this upswing, the exchange rate came back to a narrow range between the 23.6% and 38.2% Fibonacci retracement level (based on the recent decline). From this perspective, we can conclude that as long as there is no breakout above the upper line (or a breakdown below the lower border) a bigger upswing (or downswing) is not likely to be seen. However, taking into account today’s decline, it’s worth noting that if the sellers successfully push the pair below the very short-term support line (the lower border of the rising wedge), we will probably see a re-test of the strength of the February low (as a reminder, the price target after a breakdown is a bit lower than the monthly low and we marked it with a yellow rectangle). Looking at the position of the indicators, we see that sell signals remain in place supporting further deterioration.
Very short-term outlook: mixed with bearish bias
Short-term outlook: mixed with bearish bias
MT outlook: bullish
LT outlook: bearish
Trading position (short-term): In our opinion, the situation is too unclear to go short or long at the moment. So, no positions are justified from the risk/reward perspective. We will keep you informed should anything change, or should we see a confirmation/invalidation of the above.
USD/CAD
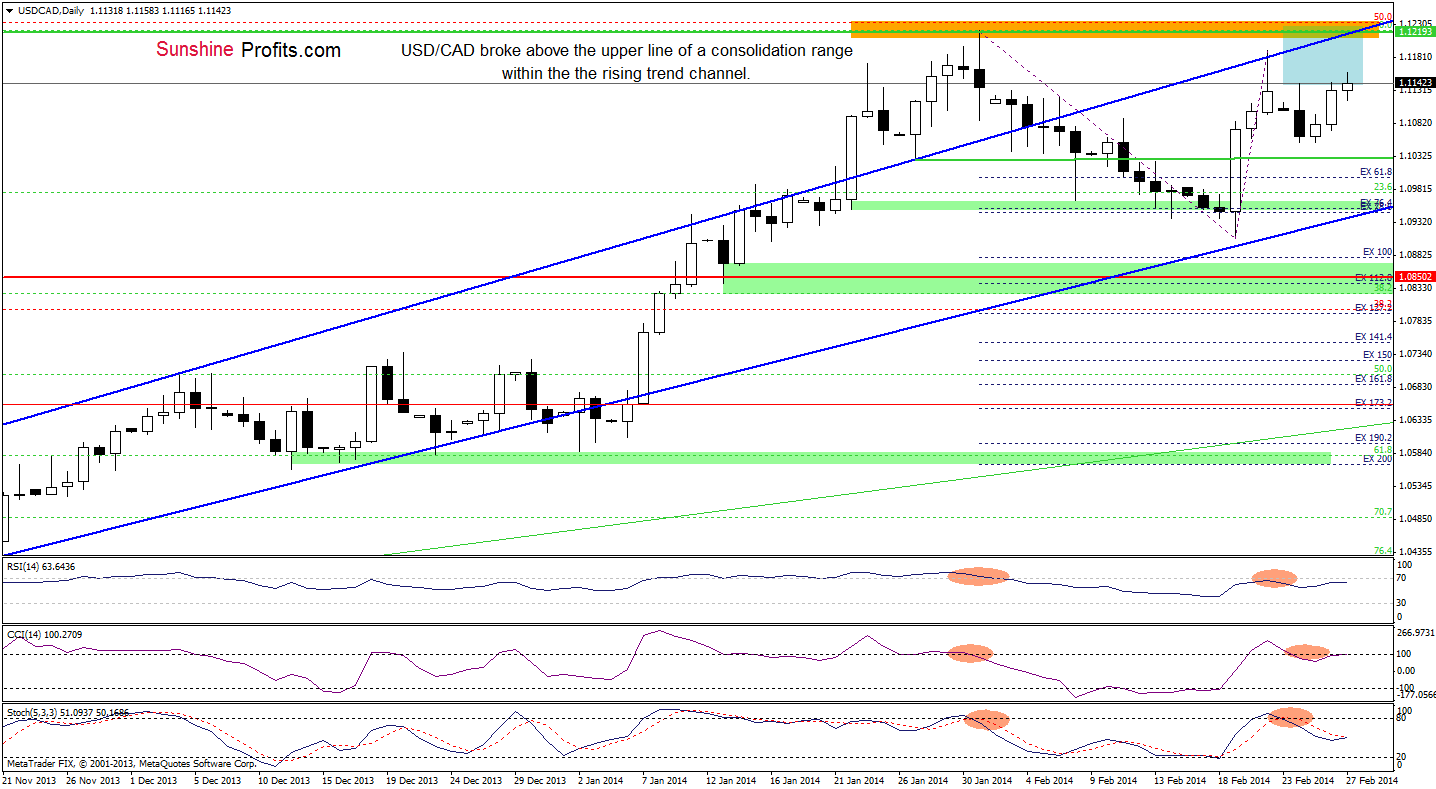
As you see on the daily chart, the situation has improved once again as USD/CAD moved higher and broke above the upper line of a consolidation range earlier today. Taking this fact into account and combining with the current position of the indicators (the CCI and Stochastic Oscillator invalidated sell signals), it seems that we may see further improvement in the nearest future. If this is the case, and the buyers realize a pro growth scenario, we will may see an upswing above the January high.
Very short-term outlook: mixed
Short-term outlook: mixed
MT outlook: bullish
LT outlook: bearish
Trading position (short-term): Taking into account the fact that we may see an upswing above the January high, in our opinion, it seems justified to close short positions at current levels. We will keep you informed should anything change, or should we see a confirmation/invalidation of the above.
USD/CHF
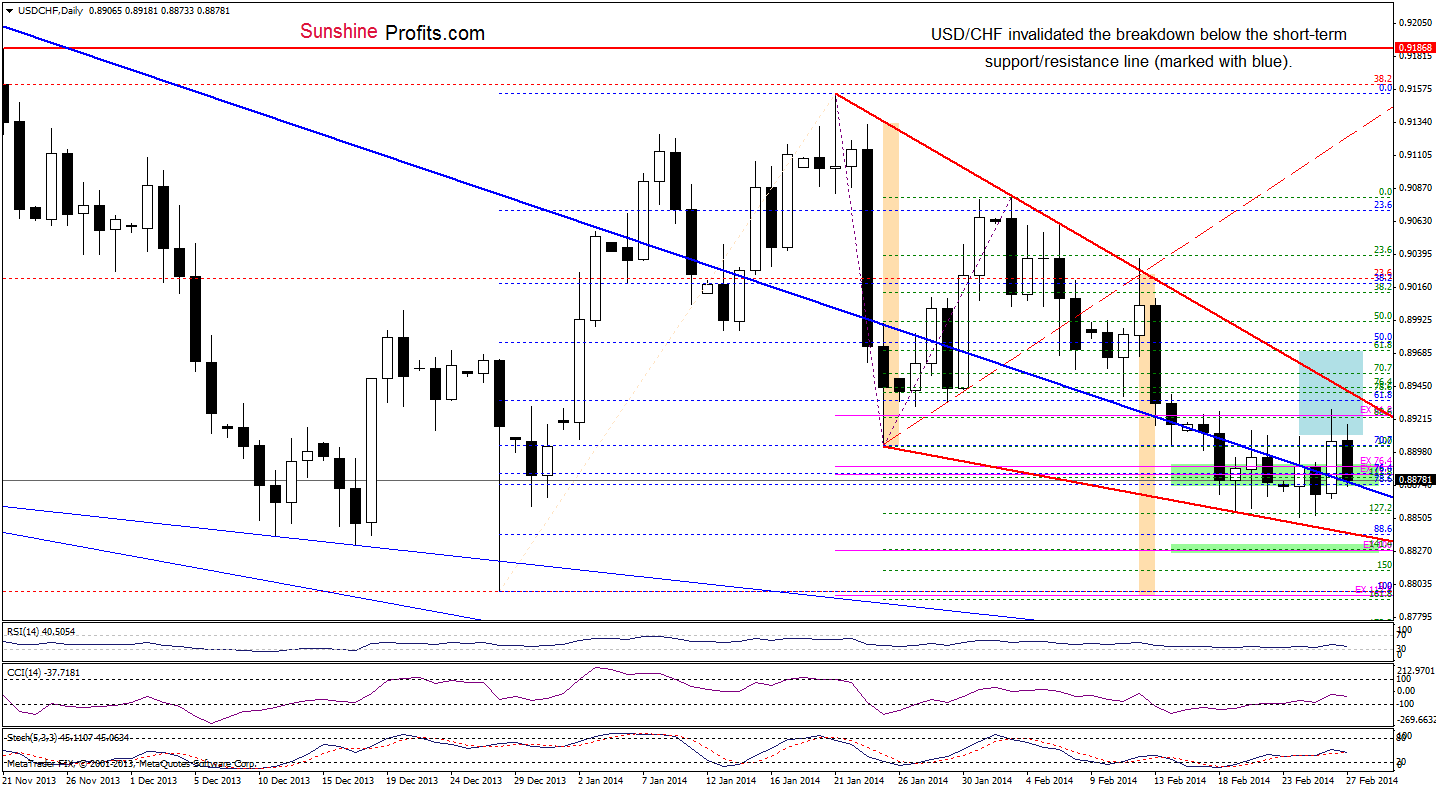
Although USD/CHF closed Wednesday above the short-term support/resistance line (marked with blue) for the first time since mid-February, the pair reversed and gave up the gains earlier today. This is a bearish signal and if the exchange rate declines below the major support line, we will likely see further deterioration and a test of the strength of February low. On the other hand, as long as the pair remains above the short-term support/resistance line, another attempt to reach the very short-term red declining line (which line successfully stopped several times further improvement earlier this month) can’t be ruled out.
Very short-term outlook: mixed
Short-term outlook: mixed
MT outlook: bearish
LT outlook: bearish
Trading position (short-term): In our opinion, the situation is too unclear to go long or short at the moment. We will keep you informed should anything change, or should we see a confirmation/invalidation of the above.
AUD/USD
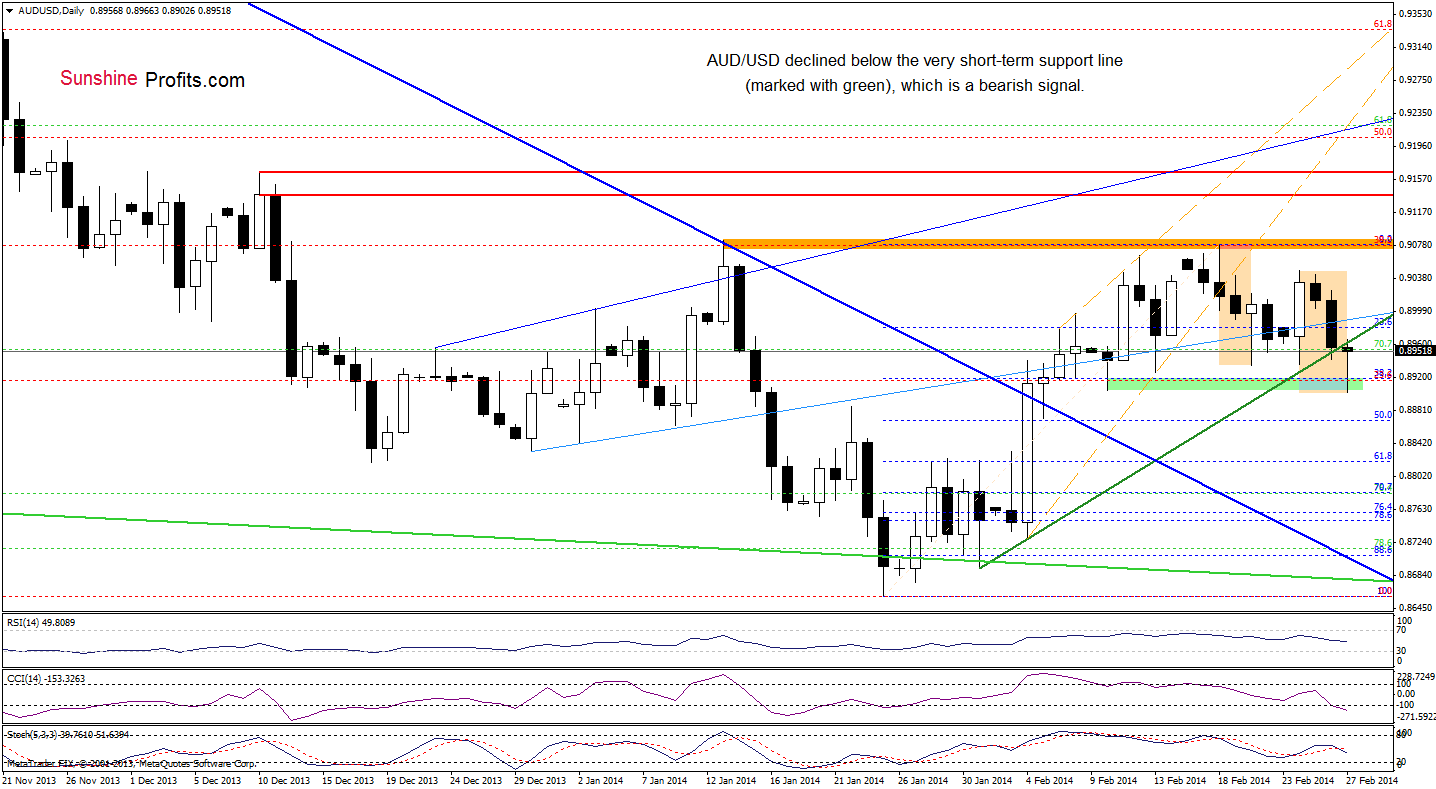
Earlier today, AUD/USD extended losses and dropped below the very short-term rising support line (marked with green), which triggered further deterioration and a decline to the Feb.10 low (currently reinforced by the 38.2% Fibonacci retracement level based on the recent rally). As you see on the above chart, this strong support encouraged buyers to act and the pair rebounded in the following hours, reaching the green rising line. If it is broken, we may see further improvement and the upside target would be around Monday high. At this point, it’s worth noting that this week’s downward move is similar to a correction that we see earlier this month, which suggests that we may see a corrective upswing in the near future. However, if the exchange rate declines once again and drops below the nearest support zone, we will likely see a decline to at least the 50% Fibonacci retracement.
Very short-term outlook: mixed
Short-term outlook: mixed
MT outlook: bearish
LT outlook: bearish
Trading position (short-term): In our opinion no positions are justified from the risk/reward perspective. We will keep you informed should anything change, or should we see a confirmation/invalidation of the above.
Thank you.
Nadia Simmons
Forex & Oil Trading Strategist
Forex Trading Alerts
Oil Investment Updates
Oil Trading Alerts

