
The U.S. currency moved higher against the major currencies after solid U.S. economic data. Earlier today, the preliminary U.S. PMI increased to 56.7 in February from a final reading of 53.7 in January (while analysts had expected a drop to 53.0 this month). Additionally, the Labor Department said in its report that initial claims for jobless benefits fell by 3,000 to 336,000 ( slightly below expectations for a decline of 4,000), while U.S. consumer prices rose 1.6% on a year-over-year basis in January and core consumer prices (without food and energy costs) were also up 1.6% on a year-over-year basis (both in line with expectations). What impact did it have on major currency pairs? If you want to know our take on this question, we invite you to read our today's Forex Trading Alert.
In our opinion the following forex trading positions are justified - summary:
EUR/USD
Quoting our last Forex Trading Alert:
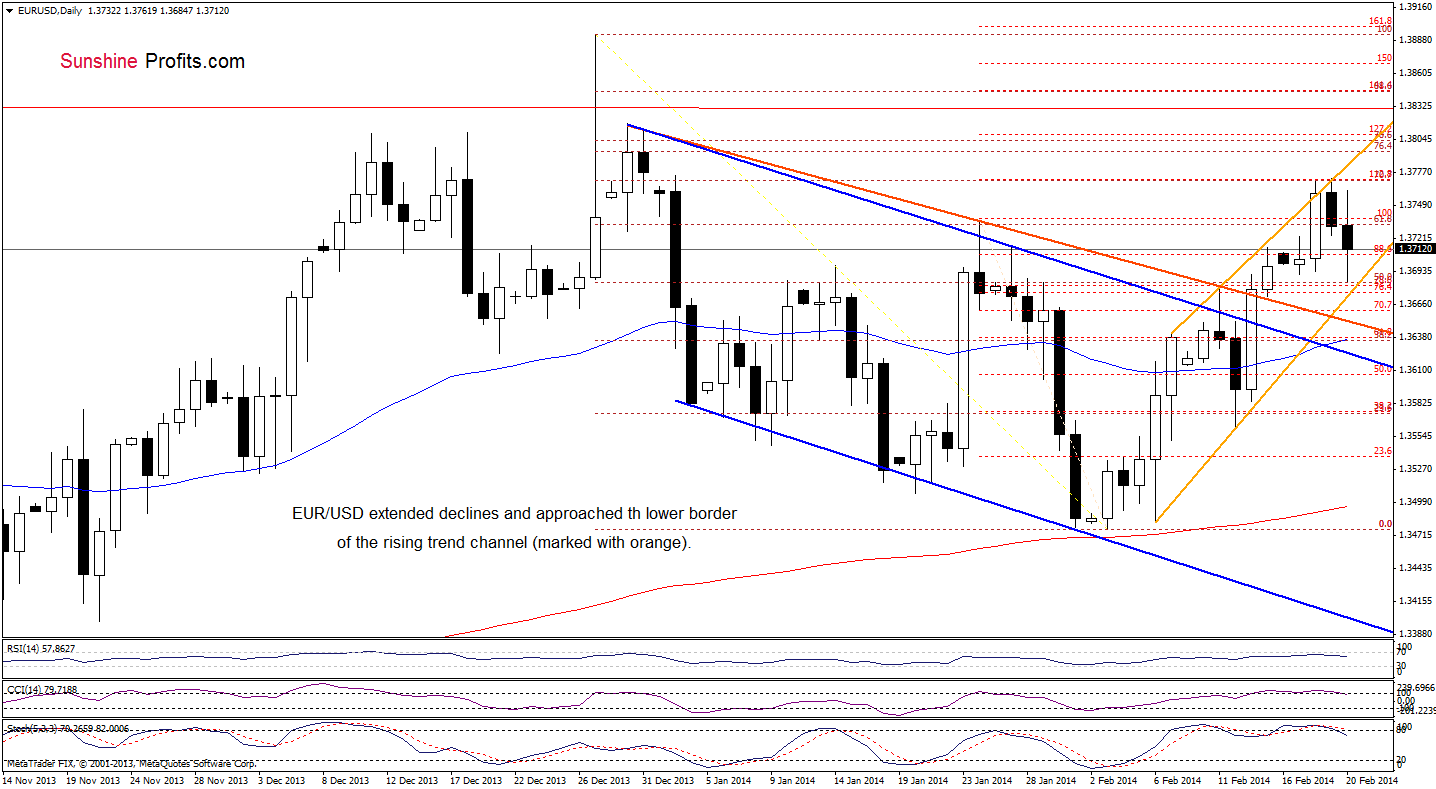
(…) the pair gave up the gains and declined below the upper line of the rising trend channel. Despite this drop, EUR/USD still remains above the Jan.24 high, which serves as support. However, if it is broken and indicators generate sell signals, we will likely see a bigger pullback and the first downside target will be the lower line of the rising trend channel (marked with orange).
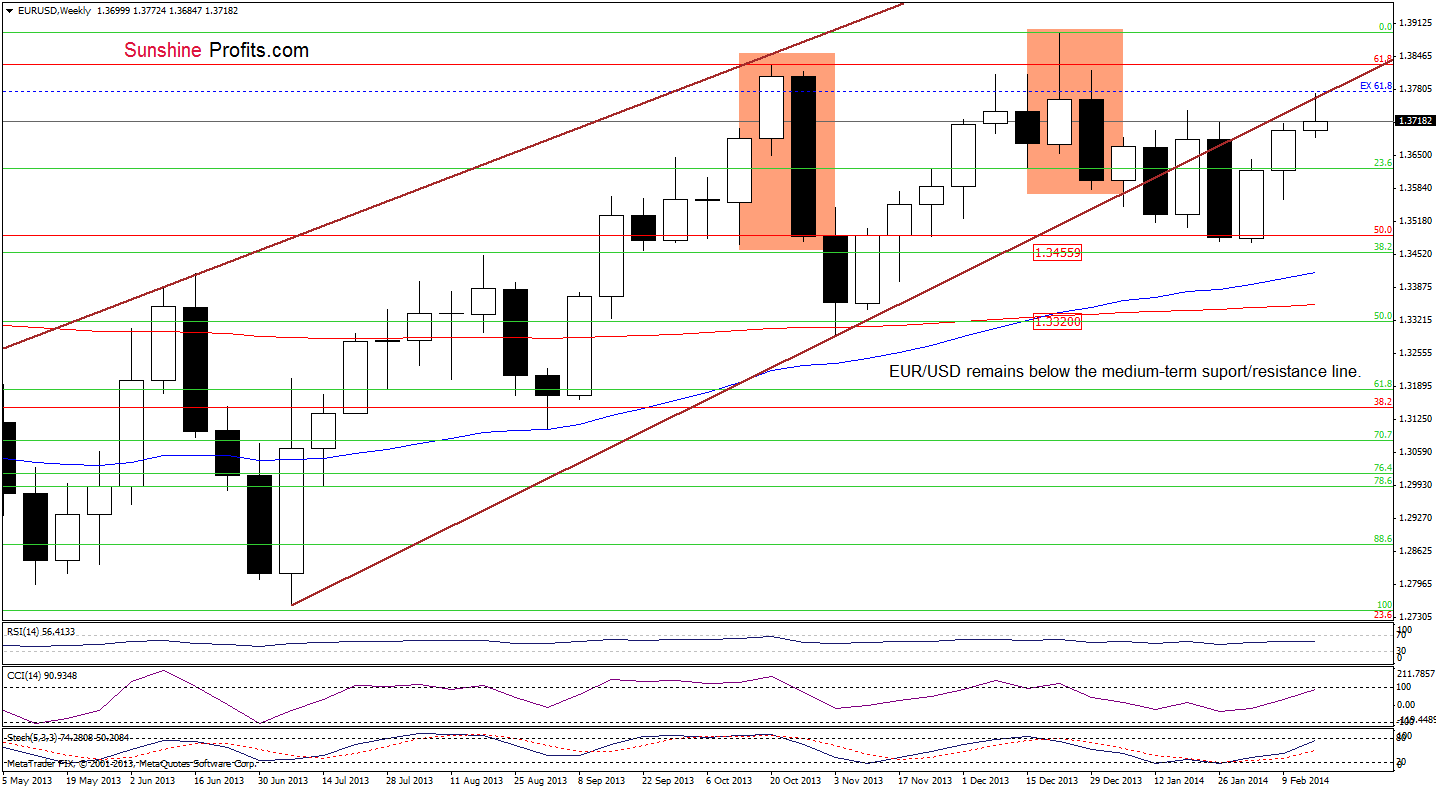
As you see on the above chart, EUR/USD extended losses and approached the lower border of the rising trend channel. The proximity to this support line encouraged buyers to act and the pair rebounded in the following hours. Despite this corrective upswing, the exchange rate still remains below the Jan.24 high. Please note that even if we see a comeback above this resistance level, the space for further growth will be likely limited by the upper line of the rising trend channel, which is reinforced by the medium-term support/resistance line (marked with brown on the weekly chart below).
Very short-term outlook: mixed
Short-term outlook: mixed
MT outlook: mixed
LT outlook: bearish
Trading position (short-term): In our opinion no positions are justified from the risk/reward perspective at the moment. However, if the exchange rate invalidates breakouts above the orange declining line and the upper line of the declining trend channel, we will likely consider opening short positions. We will keep you informed should anything change, or should we see a confirmation/invalidation of the above.
GBP/USD
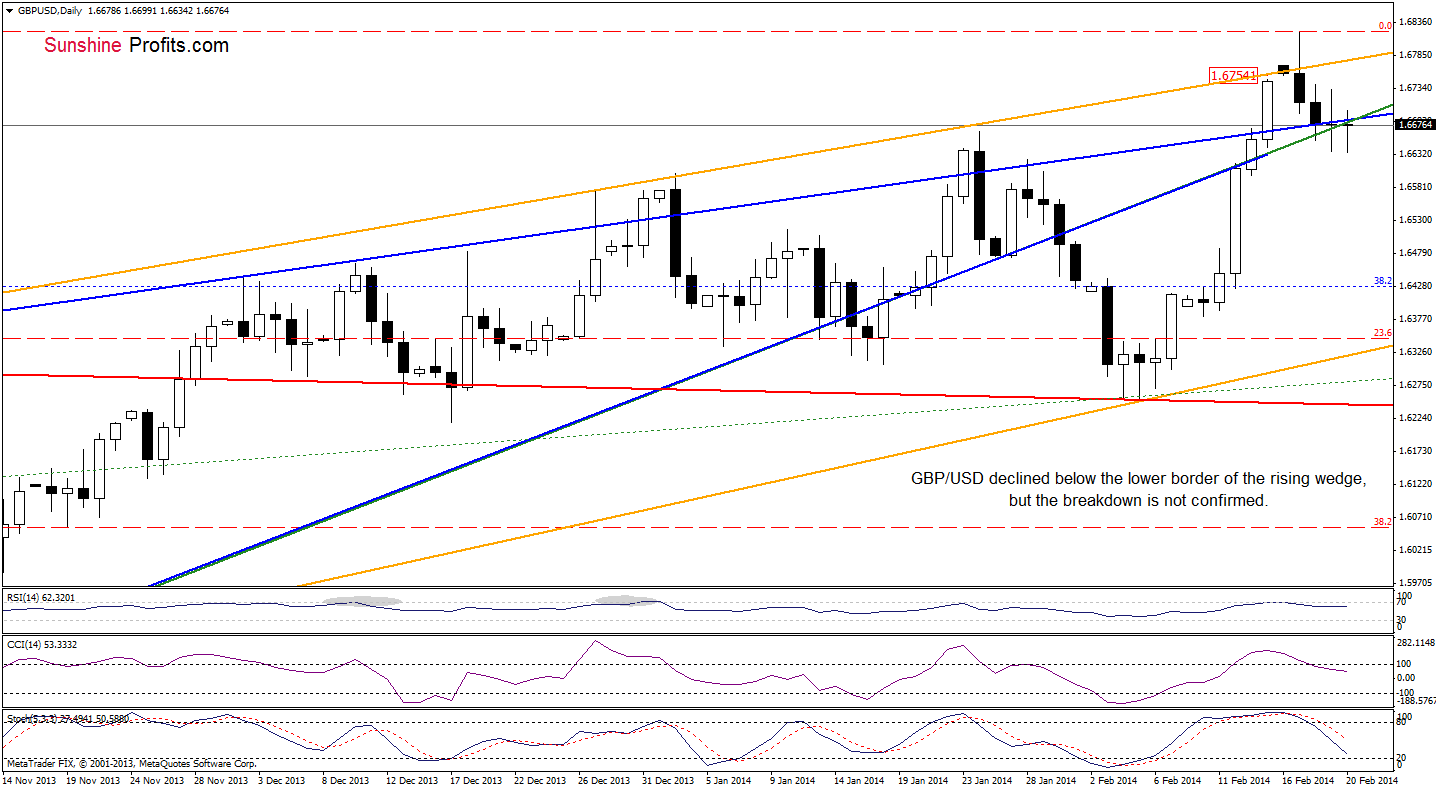
Looking at the above chart, we see that the situation hasn’t changed much as GBP/USD is still trading around the lower border of the rising wedge. Although we saw a drop below this important line yesterday, the pair reversed and closed the day above it. Earlier today, we noticed similar situation as exchange rate gave up the gains and moved lower once again. From this perspective, it seems that as long as there is no confirmed breakdown below this major support line, a bigger correction is not likely to be seen. Nevertheless, we should keep in mind that sell signals generated by the indicators remain in place, supporting sellers. So, if the pair doesn’t invalidate the breakdown and closes the day below this important support/resistance line, we may see further deterioration.
Very short-term outlook: mixed
Short-term outlook: mixed with bullish bias
MT outlook: mixed
LT outlook: mixed
Trading position (short-term): In our opinion no positions are justified from the risk/reward perspective at the moment. Nevertheless, if the pair closes the day below the lower border of the rising wedge, we will consider opening short positions. We will keep you informed should anything change, or should we see a confirmation/invalidation of the above.
USD/JPY
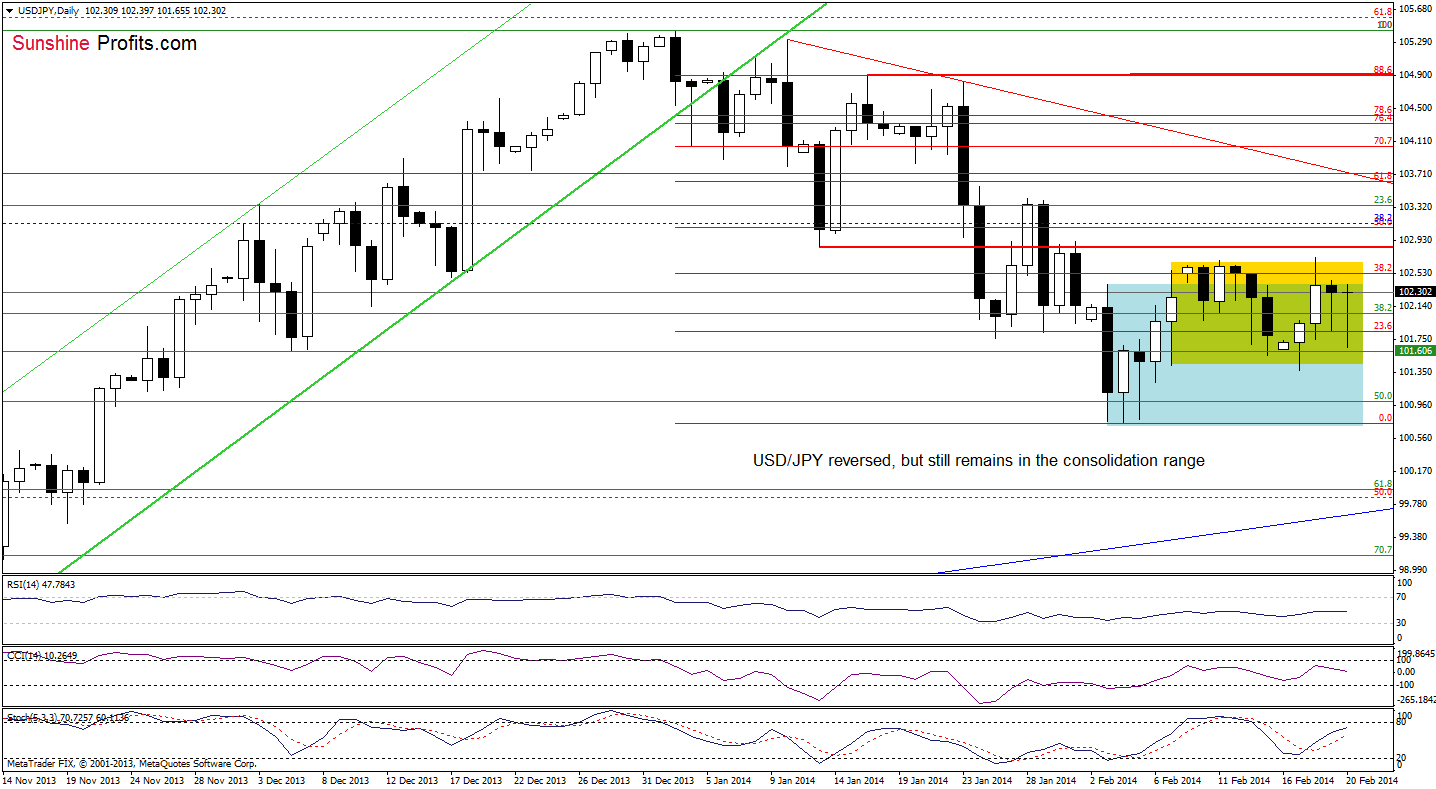
As you see on the above chart, the situation hasn’t changed much. Although USD/JPY moved lower today, the pair reversed and erased earlier losses. Despite this increase, the exchange rate still remains in a narrow range between Monday low and Tuesday high. From this perspective, it seems that as long as there is no breakout above the Feb.18 high (or breakdown below the Feb.17 low), a bigger upswing (or downswing) is not likely to be seen. Please note that even if Monday low is broken, the next support level is slightly below (the Feb.6 low).
Very short-term outlook: mixed
Short-term outlook: mixed with bearish bias
MT outlook: bullish
LT outlook: bearish
Trading position (short-term): In our opinion, the situation is too unclear to go short or long at the moment. So, no positions are justified from the risk/reward perspective. We will keep you informed should anything change, or should we see a confirmation/invalidation of the above.
USD/CAD
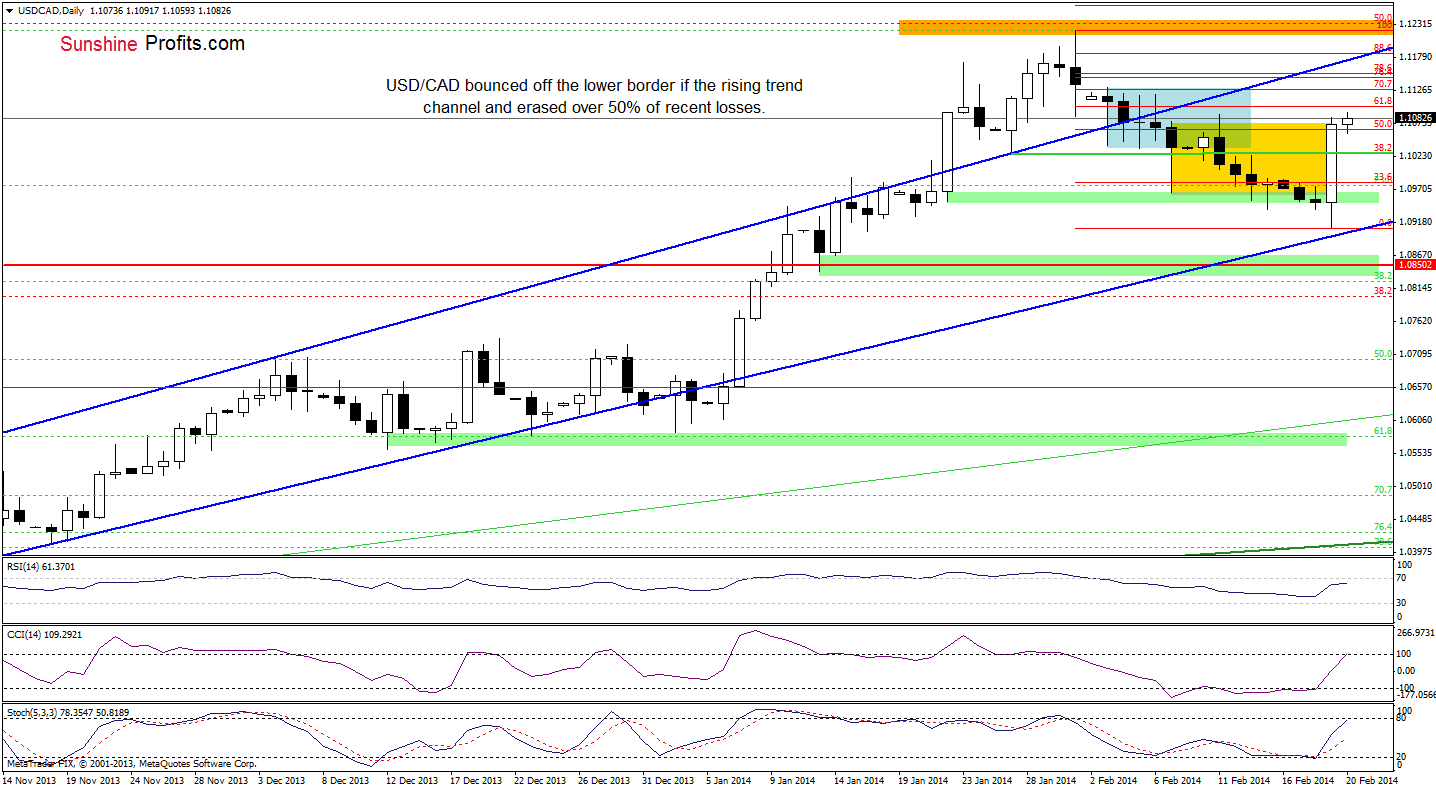
On the above chart, we see that USD/CAD rebounded sharply and moved above the upper line of the consolidation range (marked with yellow). With this upswing, the pair also broke above the 50% Fibonacci retracement level based on the recent decline, which is a positive sign – especially when we take into account buy signals generated by the CCI and Stochastic Oscillator. Despite this improvement, we should keep in mind that the exchange rate still remains below the previously-broken upper line of the rising trend channel (which is slightly above a resistance zone created by the 76.4% and 78.6% Fibonacci retracement levels based on the recent decline). Therefore, it seems that the space for further growth may be limited by this important resistance line in the coming days.
Very short-term outlook: mixed with bullish bias
Short-term outlook: mixed
MT outlook: bullish
LT outlook: bearish
Trading position (short-term): In our opinion opening long positions is not justified from the risk/reward perspective as the space for further growth seems limited at the moment. We will keep you informed should anything change, or should we see a confirmation/invalidation of the above.
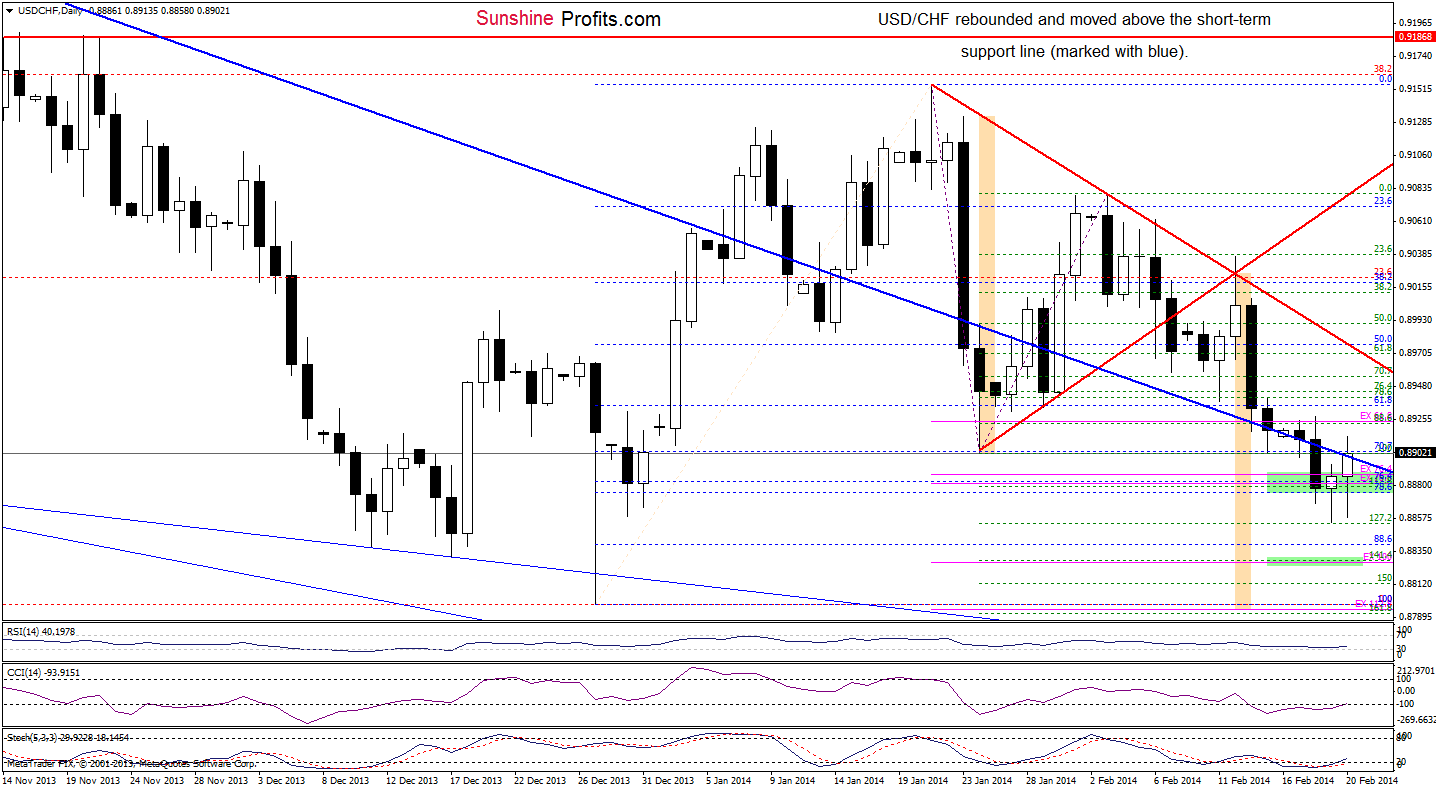
USD/CHF
Quoting our last Forex Trading Alert:
(…) USD/CHF remains in a support zone created by the 76.4%, 78.6% Fibonacci retracement levels (based on the Dec.-Jan. rally) and the 76.4%, 78.6% Fibonacci projections (marked with a green rectangle on the above chart)(…) if this support encourages buyers to act, we may see a corrective upswing to the short-term declining support line. At this point, it’s worth mentioning that the current position of the indicators and a positive divergence between the CCI and the exchange rate support a pro growth scenario.
As you see on the above chart, the situation has improved slightly as USD/CHF rebounded and came back above the short-term declining support line (marked with blue). Although this is a bullish sign, the size of the upswing is too small to say that there won’t be another attempt to re-test the strength of the support zone. However, if the pair closes the day above the short-term declining support line (and invalidates the breakdown below this important line), we may see further improvement in the coming day (or days). Please note that the indicators generated buy signals, which supports the bullish case.
Very short-term outlook: mixed
Short-term outlook: mixed
MT outlook: bearish
LT outlook: bearish
Trading position (short-term): In our opinion, the situation is too unclear to go long as there is no an invalidation of the breakdown below the short-term declining support line. We will keep you informed should anything change, or should we see a confirmation/invalidation of the above.
AUD/USD
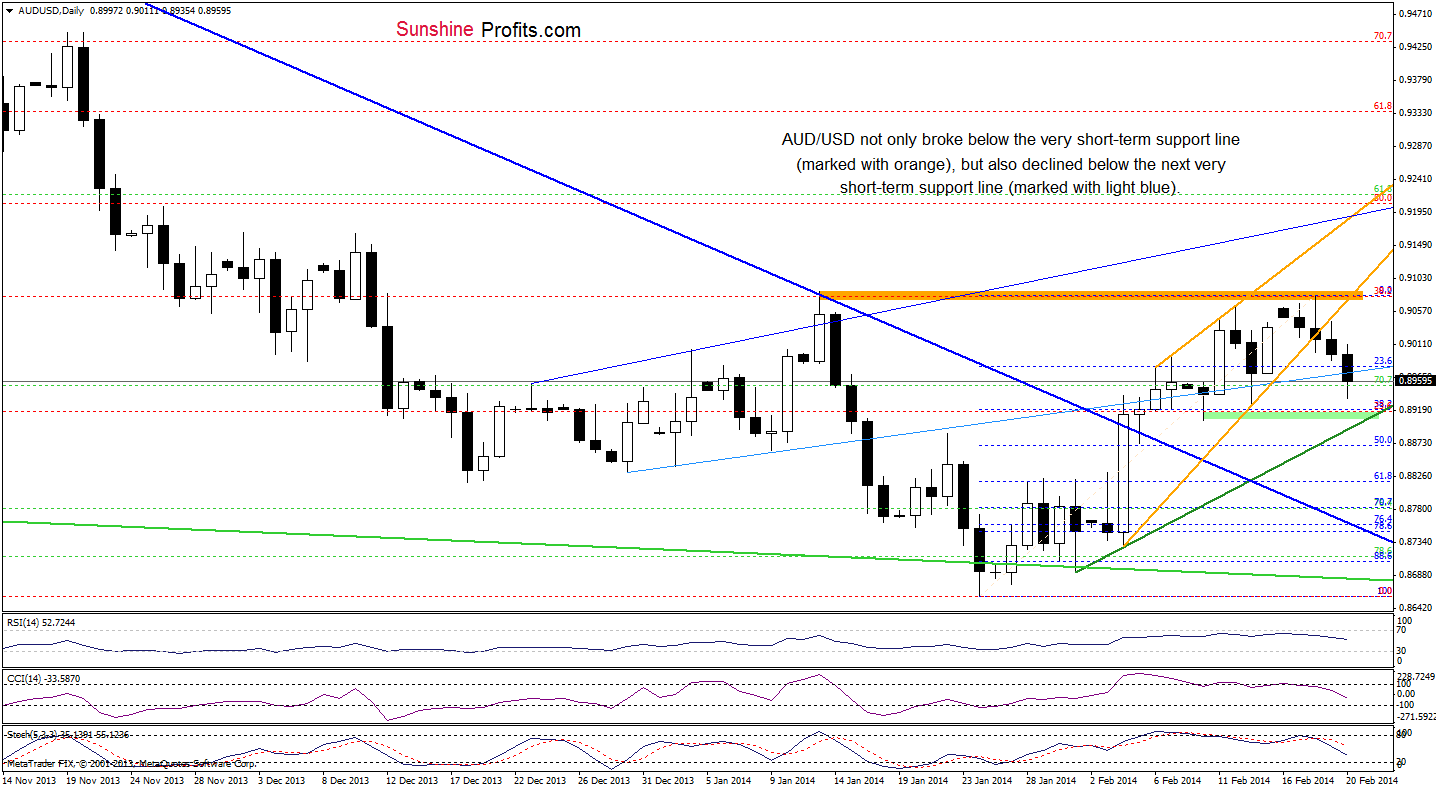
Looking at the above chart, we see that the situation has deteriorated as AUD/USD moved lower and broke below the next very short-term support line (marked with light blue). Although this is a bearish signal, the current correction is similar to the previous one, which means that the very short-term uptrend is not threatened at the moment. As you see on the daily chart, with today’s downswing, the exchange rate approached the Feb.13 low (which together with the Feb.10 low creates the nearest support zone). If this area encourages buyers to trigger an upswing, we may see a comeback to the orange very short-term support line. However, if this support zone is broken, we will likely see further deterioration and the initial downside target will be a very short-term rising support line (marked with dark green). Please note that this scenario is reinforced by the current position of the indicators, which suggests that a bigger pullback is just around the corner.
Very short-term outlook: mixed with bearish bias
Short-term outlook: mixed with bullish bias
MT outlook: bearish
LT outlook: bearish
Trading position (short-term): In our opinion, if the pair drops below the February 10 low, we might consider opening short positions. However, as long as AUD/USD remains between this level and the 38.2% Fibonacci retracement level, no positions are justified from the risk/reward perspective. We will keep you informed should anything change, or should we see a confirmation/invalidation of the above.
Thank you.
Nadia Simmons
Forex & Oil Trading Strategist
Forex Trading Alerts
Oil Investment Updates
Oil Trading Alerts

