
The U.S. currency was little changed near recent lows against major currencies as U.S. markets are shut for the President’s Day holiday and trade volumes remain thin. Nevertheless, it’s worth noting that the greenback declined to a four-year low against the British pound earlier today. What is the current outlook for major currency pairs? We invite you to read our today's Forex Trading Alert.
In our opinion the following forex trading positions are justified - summary:
EUR/USD
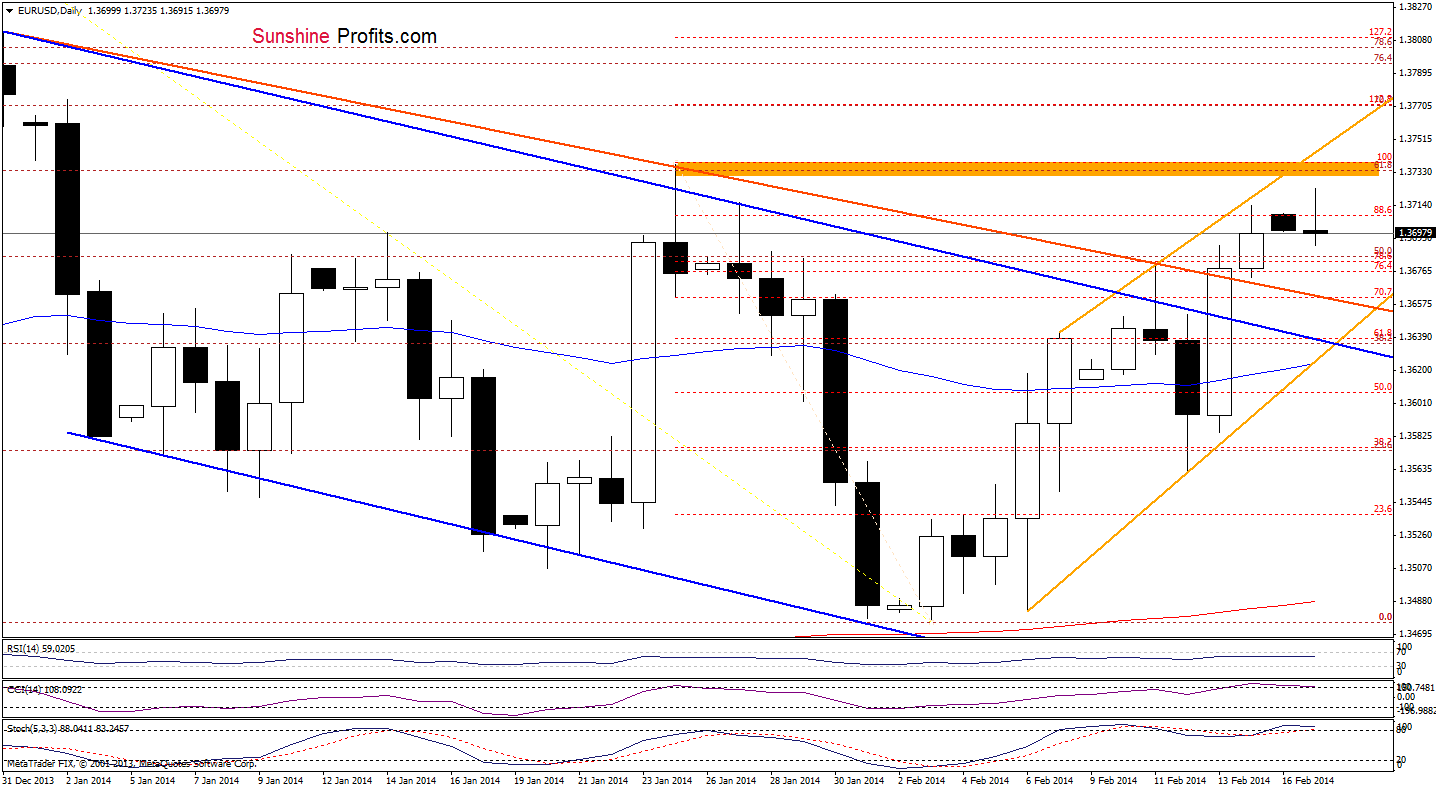
Looking at the above chart, we see that the situation has improved slightly earlier today as EUR/USD extended gains and approached the Jan.24 high (and also the 61.8% Fibonacci retracement based on the entire Dec.-Feb. decline). As you see on the daily chart, this resistance zone is reinforced by the upper line of the rising trend channel (marked with orange). Taking this fact into account, and combining with the current position of the indicators, it seems that a correction is just around the corner.
Very short-term outlook: bullish
Short-term outlook: mixed
MT outlook: mixed
LT outlook: bearish
Trading position (short-term): In our opinion no positions are justified from the risk/reward perspective at the moment. However, if the exchange rate invalidates breakouts above the orange declining line and the upper line of the declining trend channel, we will likely consider opening short positions. We will keep you informed should anything change, or should we see a confirmation/invalidation of the above.
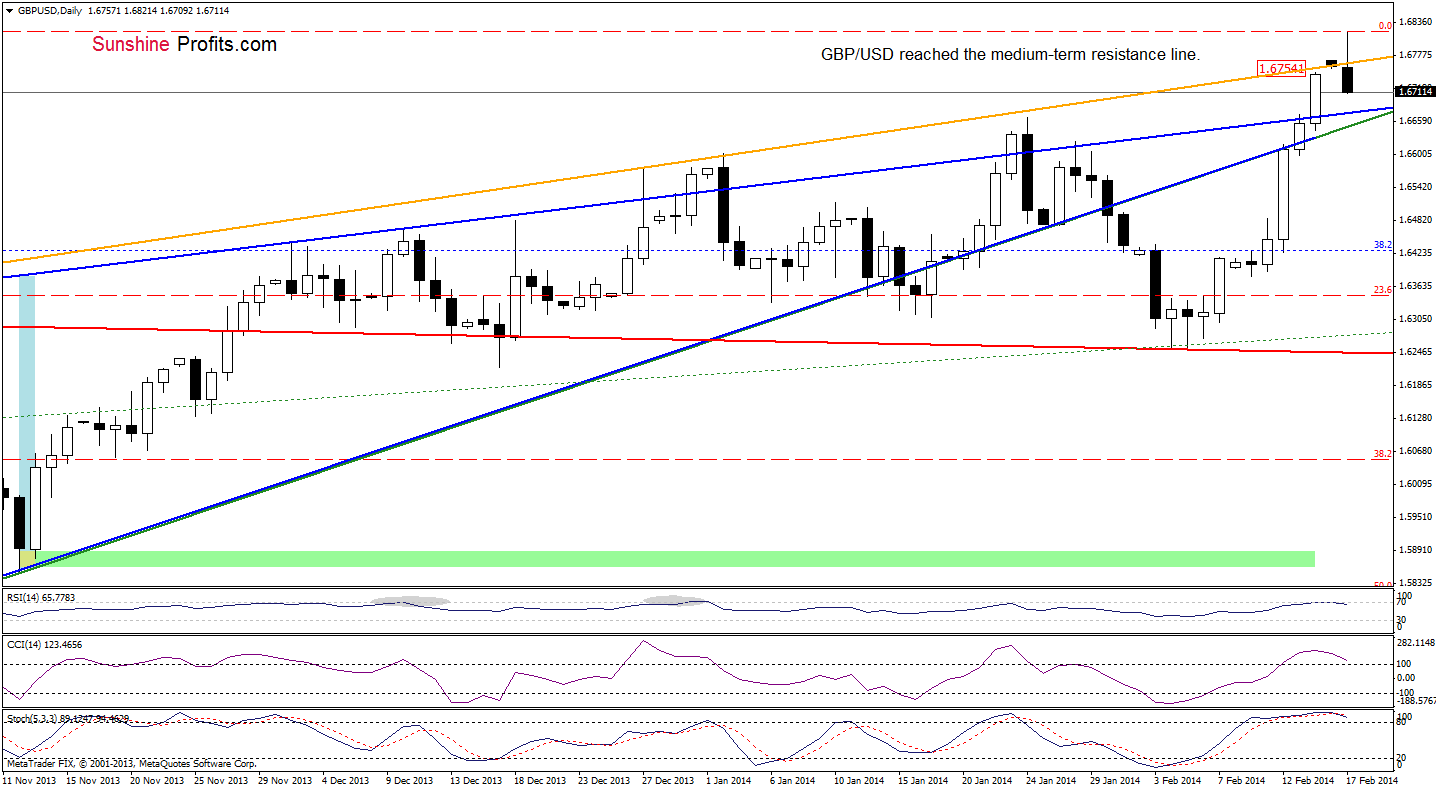
GBP/USD
Quoting our last Forex Trading Alert:
(…) GBP/USD extended gains and (…) broke above the upper border of the rising wedge, which is a strong bullish signal. However, the space for further growth seems limited- especially when we factor in the proximity to the orange resistance line and the current position of the indicators (the RSI reached the level of 70 and two other indicators are overbought). Taking this facts into account, it seems that a pause or a pullback is just around the corner.
As you see on the above chart, GBP/USD moved higher once again and even broke above the medium-term orange resistance line. However, this improvement was only temporarily and the pair slipped below this major resistance line earlier today. Despite this drop, the exchange rate still remains above the previous high and well above the upper border of the rising wedge, which supports buyers. However, if the pair invalidates the breakout and drops below the lower border of the rising wedge, we will likely see further deterioration.
Very short-term outlook: bullish
Short-term outlook: mixed with bullish bias
MT outlook: mixed
LT outlook: mixed
Trading position (short-term): In our opinion no positions are justified from the risk/reward perspective. Nevertheless, if the pair declines below the lower border of the rising wedge, we will consider opening short positions. We will keep you informed should anything change, or should we see a confirmation/invalidation of the above.
USD/JPY
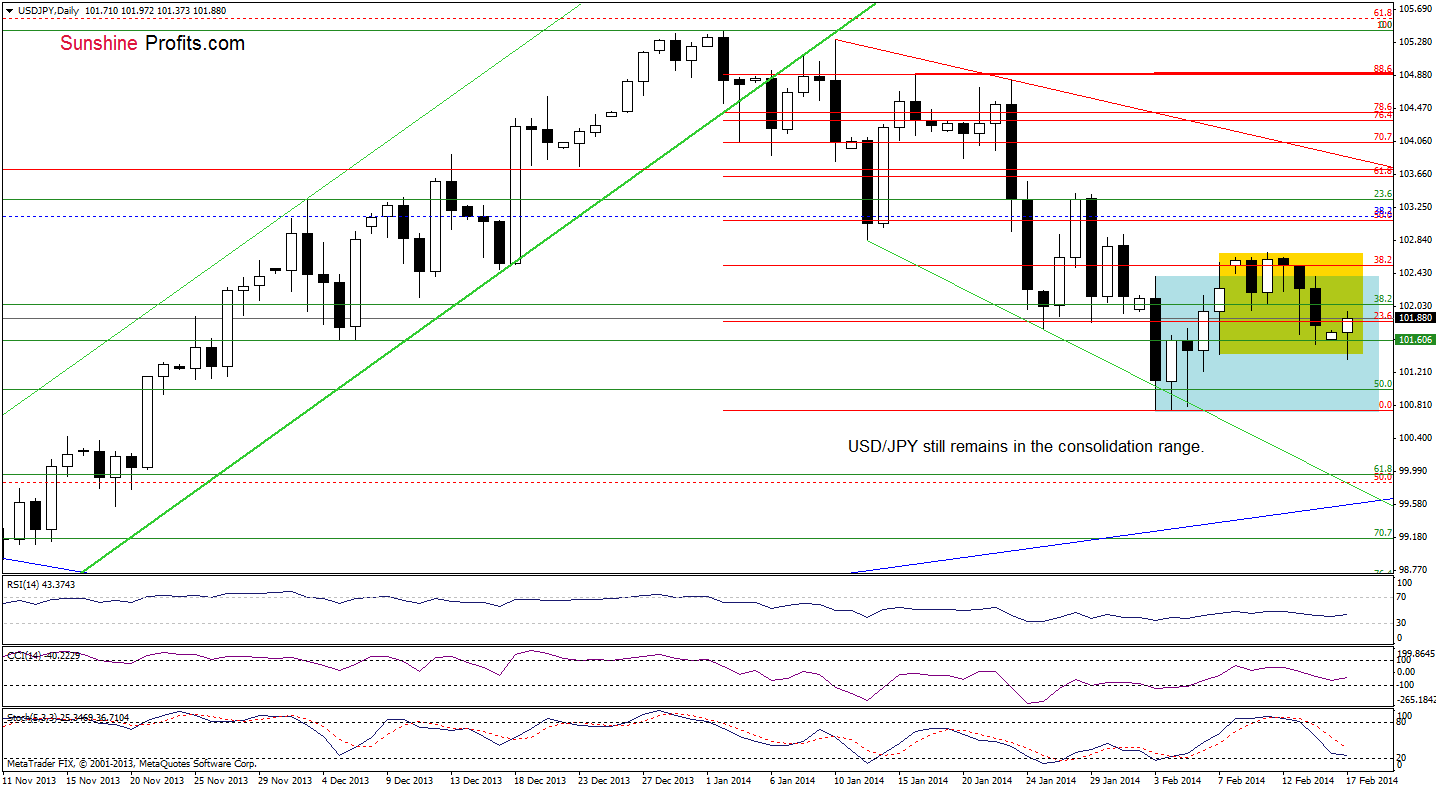
Although the situation has deteriorated earlier today as USD/JPY extended declines and slipped below last Friday low, the pair rebounded and still remains in a narrow range (marked with yellow). On one hand, we may see further improvement and an upswing to the upper border of the consolidation range. On the other hand, when we take a closer look at the position of the indicators, we see that they still support sellers. So, another attempt to move lower should not surprise us.
Very short-term outlook: mixed
Short-term outlook: mixed with bearish bias
MT outlook: bullish
LT outlook: bearish
Trading position (short-term): In our opinion, the situation is too unclear to go short or long at the moment. So, no positions are justified from the risk/reward perspective. We will keep you informed should anything change, or should we see a confirmation/invalidation of the above.
USD/CAD
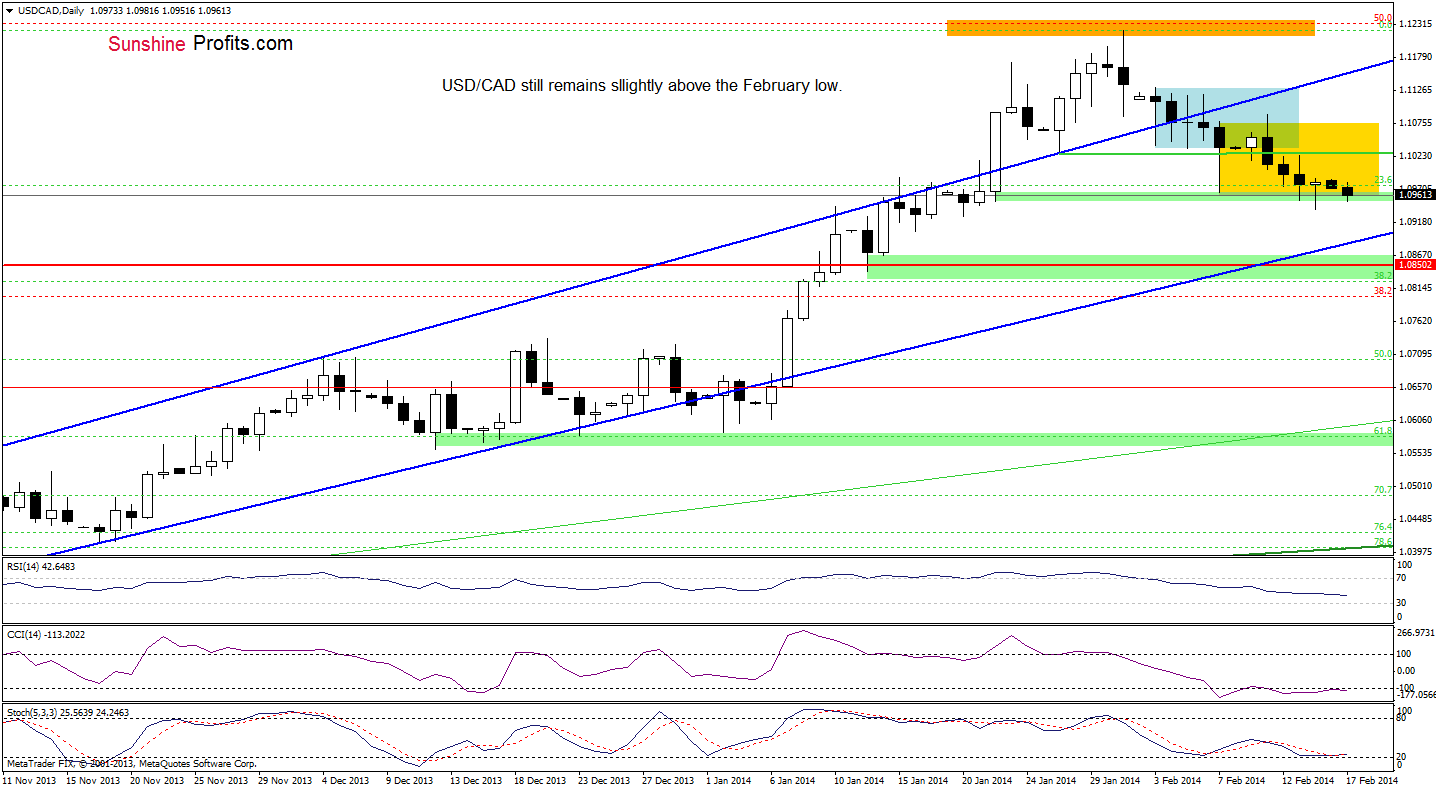
Looking at the above chart, we see that the situation hasn’t changed much as USD/CAD remains in a narrow range slightly above the Jan.22 low. Therefore, what we wrote in our last Forex Trading Alert remains up-to-date also today.
(…) at this point, we should consider two scenarios. If this support level encourages buyers to act, we will likely see another comeback to the consolidation range (marked with blue). However, if it is broken and the exchange rate closes the day below the Jan.22 low, it will likely trigger a decline to 1.0904 (the Jan. 16 low) or even to a strong support zone created by the 38.2% Fibonacci retracement level (based on the entire Sept.-Jan. rally), the lower border of the trend channel, the Jan. 13 low and the 2010 high.
Very short-term outlook: mixed
Short-term outlook: mixed
MT outlook: bullish
LT outlook: bearish
Trading position (short-term): From today’s point of view, even if the pair extended losses, the lower border of the trend channel will likely stop further deterioration. Therefore, in our opinion opening short positions is not justified from the risk/reward perspective. We will keep you informed should anything change, or should we see a confirmation/invalidation of the above.
USD/CHF
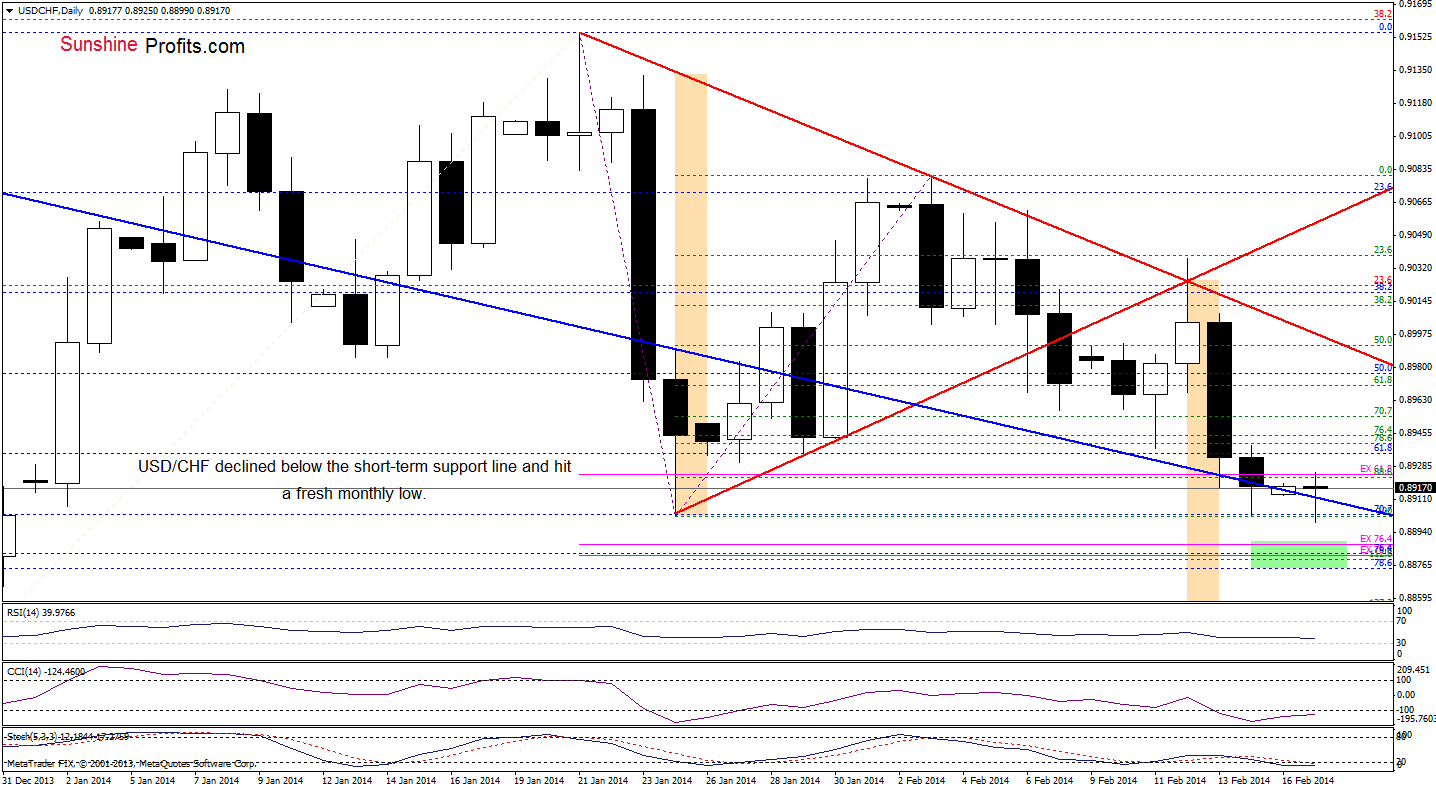
Looking at the above chart, we see that USD/CHF extended declines and dropped below the January low once again. However, similarly to what we saw on Friday, this support level encouraged buyers to act and the pair rebounded. With this upswing, the exchange rate came back above the short-term declining support line (marked with blue), which is a positive signal (especially when we factor in a positive divergence between the CCI and the exchange rate). Nevertheless, we should still keep in mind what we wrote in our last Forex Trading Alert:
(…) a drop below the lower border of the triangle may trigger further deterioration and the downside target for the pattern would be around the December low (…) if the short-term declining support line is successfully broken, we will likely see a drop (…) even to a support zone created by the 76.4%, 78.6% Fibonacci retracement levels (based on the Dec.-Jan. rally) and the 76.4%, 78.6% Fibonacci projections (marked with a green rectangle on the above chart).
Very short-term outlook: bearish
Short-term outlook: mixed
MT outlook: bearish
LT outlook: bearish
Trading position (short-term): Even if the pair drops below the January low once again, the space for further declines seems limited. Therefore, in our opinion opening short positions after such drop is not a good idea from the risk/reward perspective. We will keep you informed should anything change, or should we see a confirmation/invalidation of the above.
AUD/USD
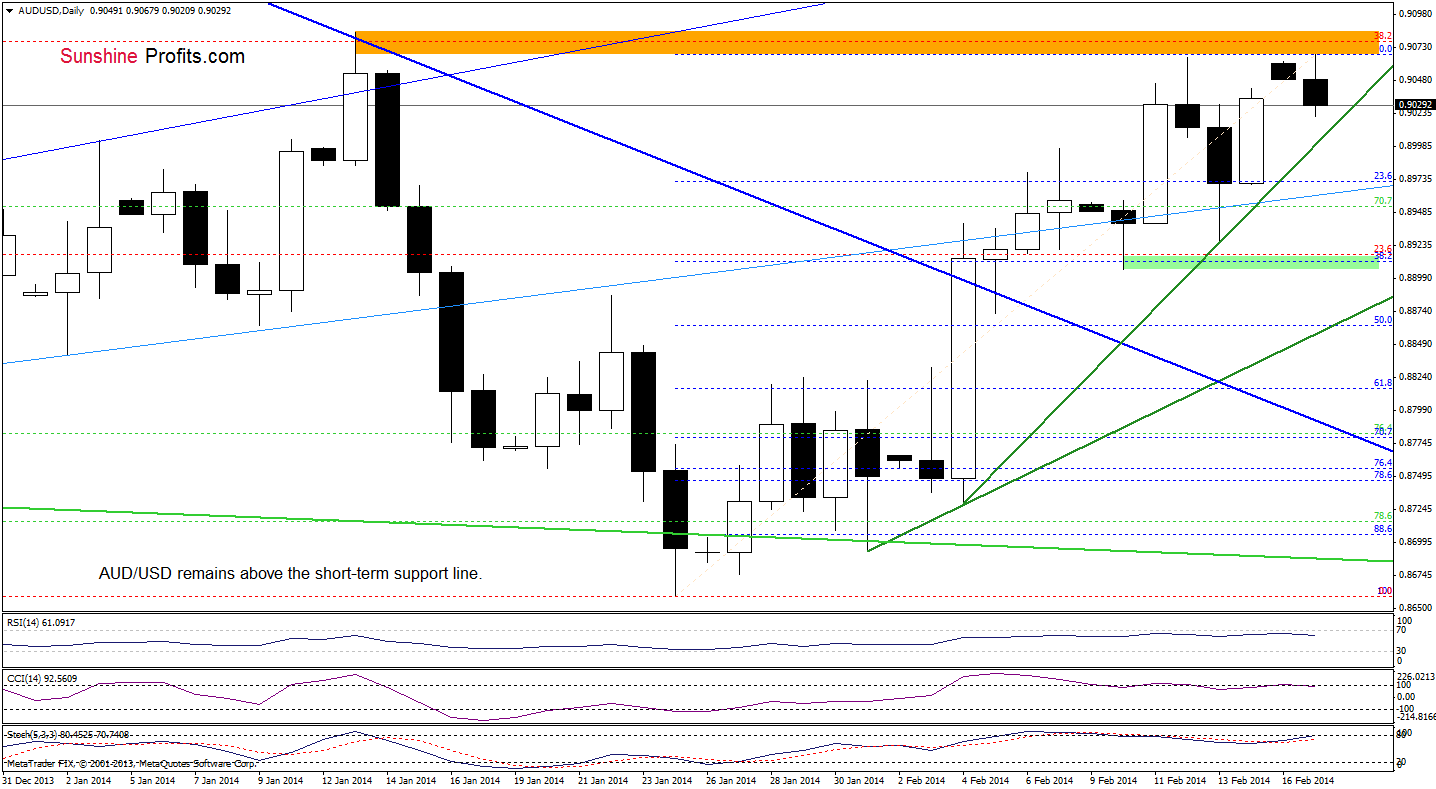
As you see on the above chart, AUD/USD extended gains and hit a fresh monthly high earlier today. Despite this increase, the pair still remains below the 38.2% Fibonacci retracement level, which serves as major resistance at the moment. From today’s point of view, we see that the current correction is similar to the previous one, which means that the very short-term uptrend is not threatened at the moment. Nevertheless, the current position of the indicators suggests that a bigger pullback is just around the corner.
Very short-term outlook: mixed
Short-term outlook: mixed with bullish bias
MT outlook: bearish
LT outlook: bearish
Trading position (short-term): In our opinion, if the pair drops below the February 10 low, we might consider opening short positions. However, as long as AUD/USD remains between above this level and the 38.2% Fibonacci retracement level, no positions are justified from the risk/reward perspective. We will keep you informed should anything change, or should we see a confirmation/invalidation of the above.
Thank you.
Nadia Simmons
Forex & Oil Trading Strategist
Forex Trading Alerts
Oil Investment Updates
Oil Trading Alerts

