
The U.S. dollar moved lower against major currencies after a monthly U.S. employment report came in weaker than expected. Earlier today, the U.S. Labor Department showed that 113,000 jobs were added in January (well below expectations for a 185,000 increase). The report also showed that 142,000 jobs were added in the U.S. private sector last month, below the 189,000 that economists had expected. What impact did these lower-than-expected numbers have on major currency pairs? If you want to know our take on this question, we invite you to read our today's Forex Trading Alert.
In our opinion the following forex trading positions are justified - summary:
- EUR/USD: none
- GBP/USD: none
- USD/JPY: none
- USD/CAD: none
- USD/CHF: none
- AUD/USD: long (stop-loss order: 0.8728 and an upside target: 0.9069)
EUR/USD
Quoting our last Forex Trading Alert:
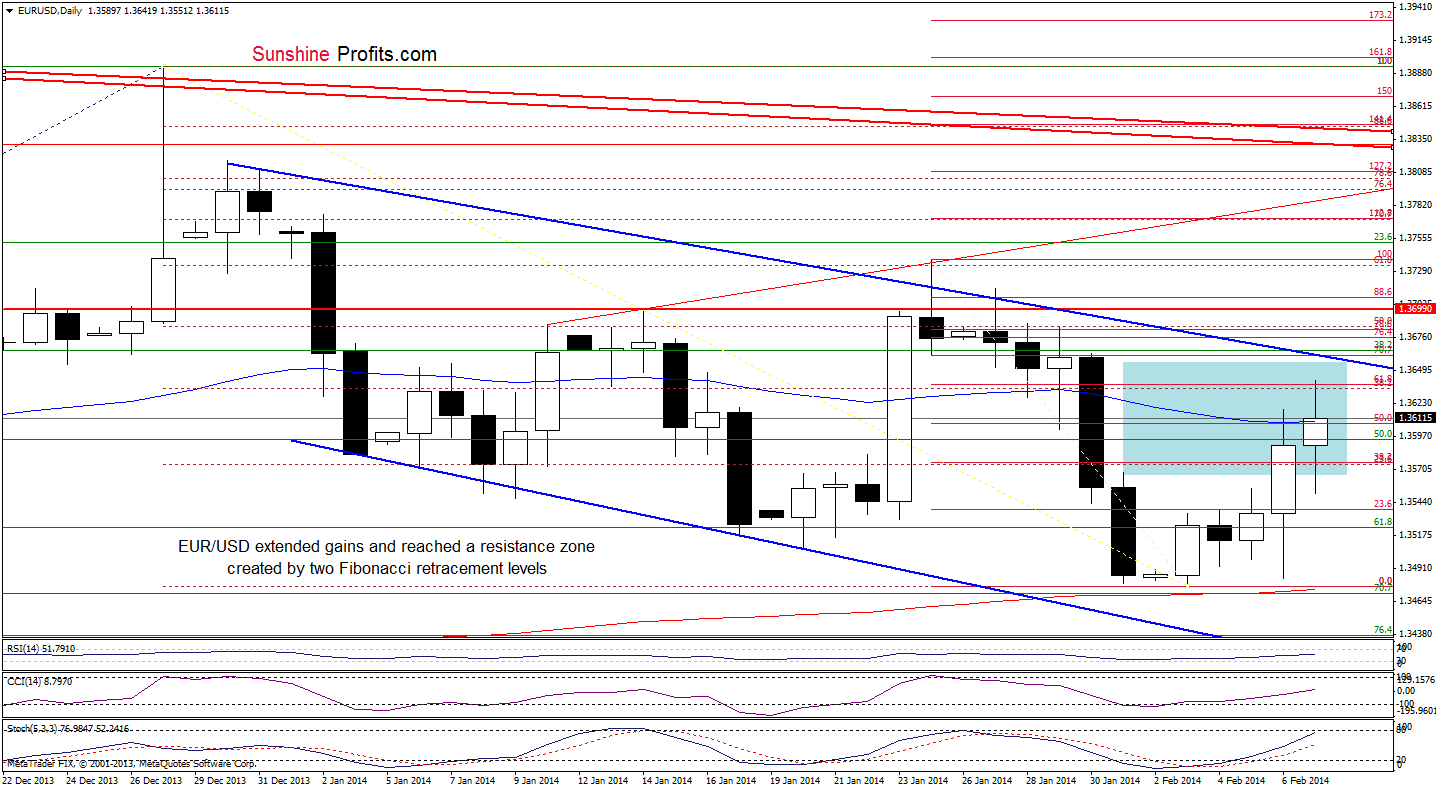
(…) EUR/USD broke above the upper border of the consolidation range, the 50% Fibonacci retracement level and the 50-day moving average. Taking these facts into account and combining with the size of today’s rally and buy signals generated by the indicators, we will likely see further improvement. According to theory, the upside target for this pattern will be around 1.3660 (slightly below the upper line of the declining trend channel and the 70.7% Fibonacci retracement level based on the recent decline).
As you see on the above chart, the pair extended gains earlier today. With this upswing EUR/USD reached a resistance zone created by the 61.8% Fibonacci retracement level (based on the recent decline) and the 38.2% Fibonacci retracement (based on the entire Dec.-Feb. decline). Although this area encouraged sellers to act, the exchange rate remains above the 50-day moving average and buy signals generated by the indicators are still in play. Taking these facts into account, it seems that another attempt to reach the upside target can’t be ruled out.
Very short-term outlook: bullish
Short-term outlook: mixed with bullish bias
MT outlook: mixed
LT outlook: bearish
Trading position (short-term): In our opinion no positions are justified from the risk/reward perspective. We will keep you informed should anything change, or should we see a confirmation/invalidation of the above.
GBP/USD
In our last Forex Trading Alert, we wrote:
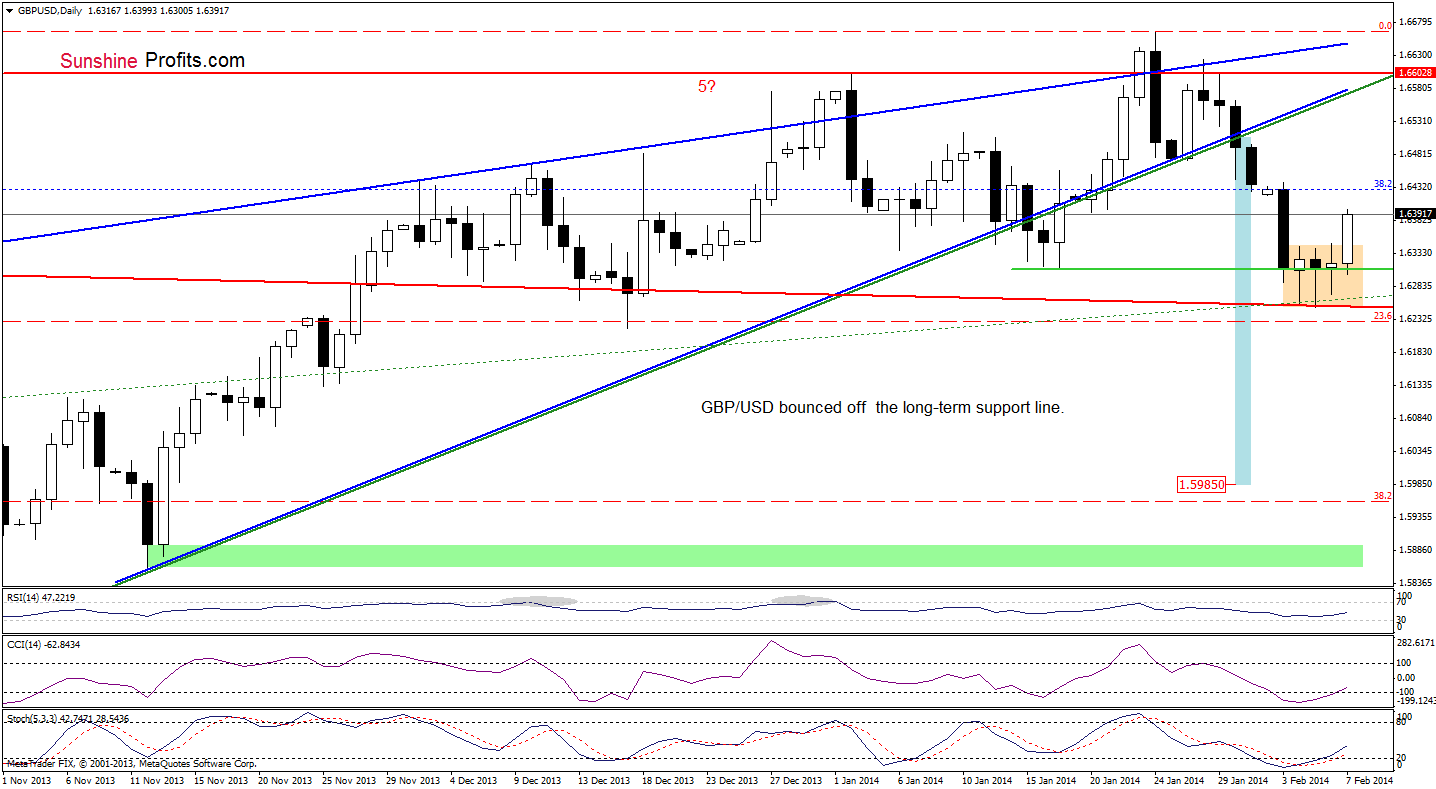
(…) the pair still remains above the long-term declining support line (marked with red), which successfully stopped further deterioration in December and also earlier this week (…) if this strong support line encourages the buyers to push the order button, we will likely see a corrective upswing (…) the indicators are oversold (additionally, the Stochastic Oscillator generated a buy signal), which suggest that the space for further declines may be limited and we may see a see a corrective upswing in the near future.
Looking at the above chart, we see that GBP/USD broke above the upper line of a consolidation range and rebounded. Additionally, the CCI and Stochastic Oscillator generated buy signals, which suggests that further improvement is likely to be seen. Please note that the nearest resistance level is created by Monday high.
Very short-term outlook: mixed with bullish bias
Short-term outlook: mixed
MT outlook: mixed
LT outlook: mixed
Trading position (short-term): In our opinion no positions are justified from the risk/reward perspective. We will keep you informed should anything change, or should we see a confirmation/invalidation of the above.
USD/JPY
Quoting our last Forex Trading Alert:
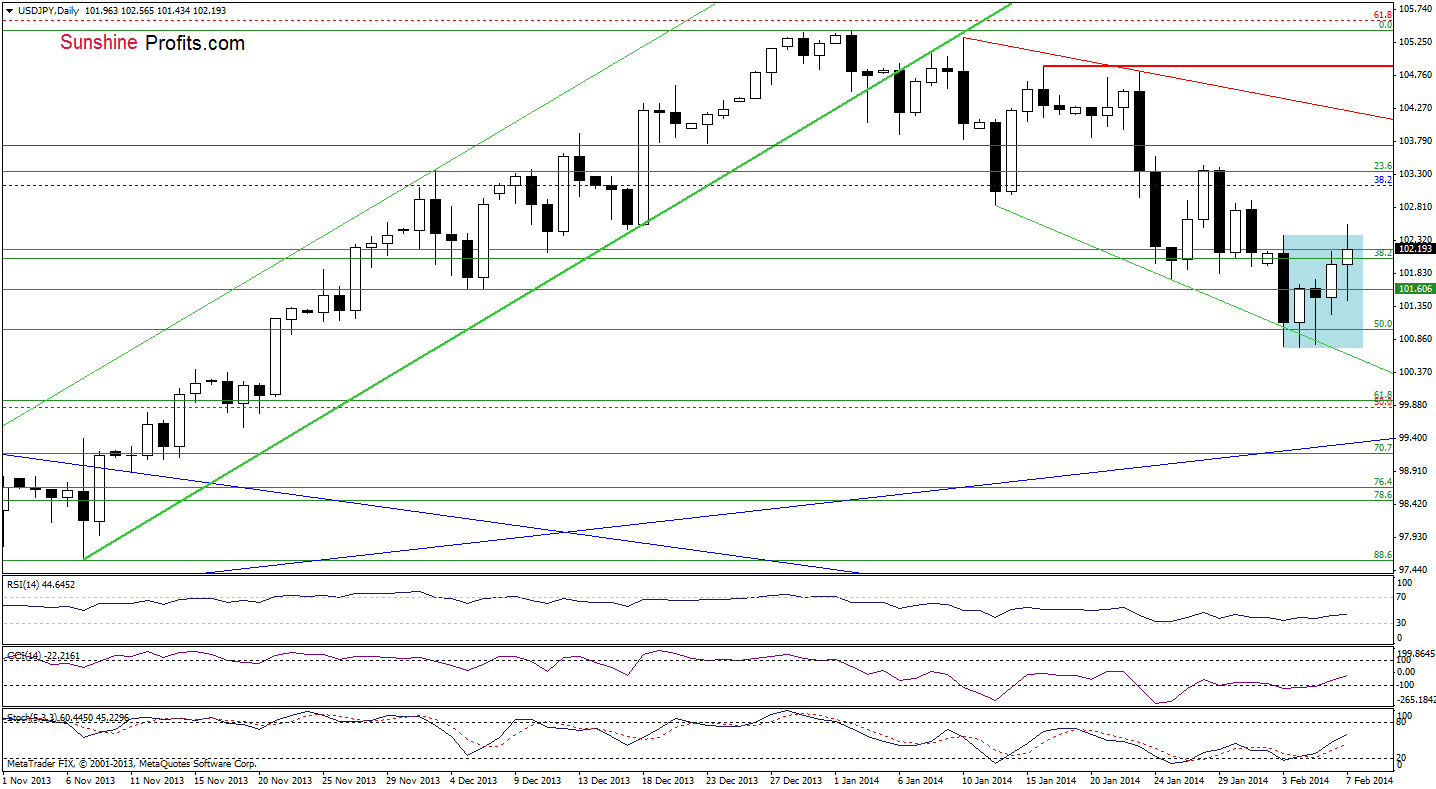
(…) USD/JPY remains in a consolidation range (marked with blue) slightly above declined the support zone created by the 50% Fibonacci retracement level and the very short-term declining support line (marked with green)(…) it seems that a breakout above the upper line (or breakdown below the lower line) will trigger a bigger upward (or downward) move.
On the above chart, we see that the pair extended gains and moved above the upper line of the consolidation range earlier today. Although this improvement was temporary and the exchange rate declined, it still remains slightly below today intraday high. Taking this fact into account and combining with buy signals generated by the CCI and Stochastic Oscillator, it seems that we may see another attempt to move higher. If this is the case, the first upside target will be around 103.40 where the Jan. 29 high is.
Very short-term outlook: mixed
Short-term outlook: mixed with bearish bias
MT outlook: bullish
LT outlook: bearish
Trading position (short-term): In our opinion no positions are justified from the risk/reward perspective. We will keep you informed should anything change, or should we see a confirmation/invalidation of the above.
USD/CAD
In our previous Forex Trading Alert, we wrote:
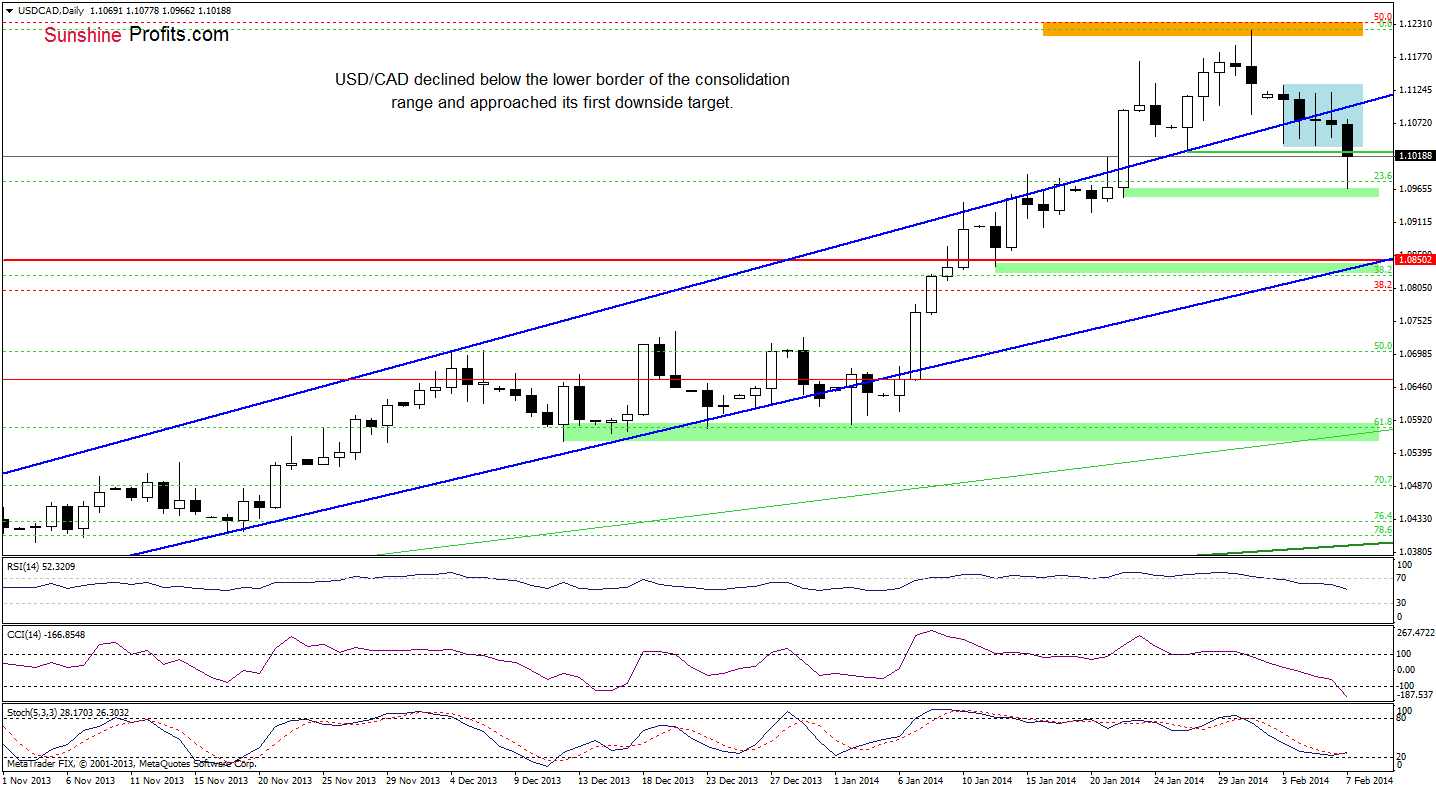
(…) if the exchange rate declines below the lower border of the consolidation once again and also below the Jan.27 low, we may see further deterioration and the first downside target for the sellers would be around 1.0952 where the Jan.22 low is.
Looking at the above chart, we see that USD/CAD dropped below the lower border of the consolidation below, which triggered further decline. With this move, the exchange rate reached the 23.6% Fibonacci retracement level (based on the entire Sept.-Jan. rally) and also approached its first downside target. As you see on the daily chart, this support zone encouraged buyers and the pair rebounded. Nevertheless, it still remains below the lower border of the consolidation, which suggests that we may see another attempt to move lower. If this is the case, a drop below the Jan.22 low will likely trigger a drop to 1.0904 (the Jan. 16 low) or even to a strong support zone created by the 38.2% Fibonacci retracement level (based on the entire Sept.-Jan. rally), the lower border of the trend channel, the Jan. 13 low and the 2010 high.
Very short-term outlook: mixed with bearish bias
Short-term outlook: mixed
MT outlook: bullish
LT outlook: bearish
Trading position (short-term): In our opinion, if the pair closes below the Jan. 27 low at 1.1030, we might consider going short. We will keep you informed should anything change, or should we see a confirmation/invalidation of the above.
USD/CHF
Quoting our last Forex Trading Alert:
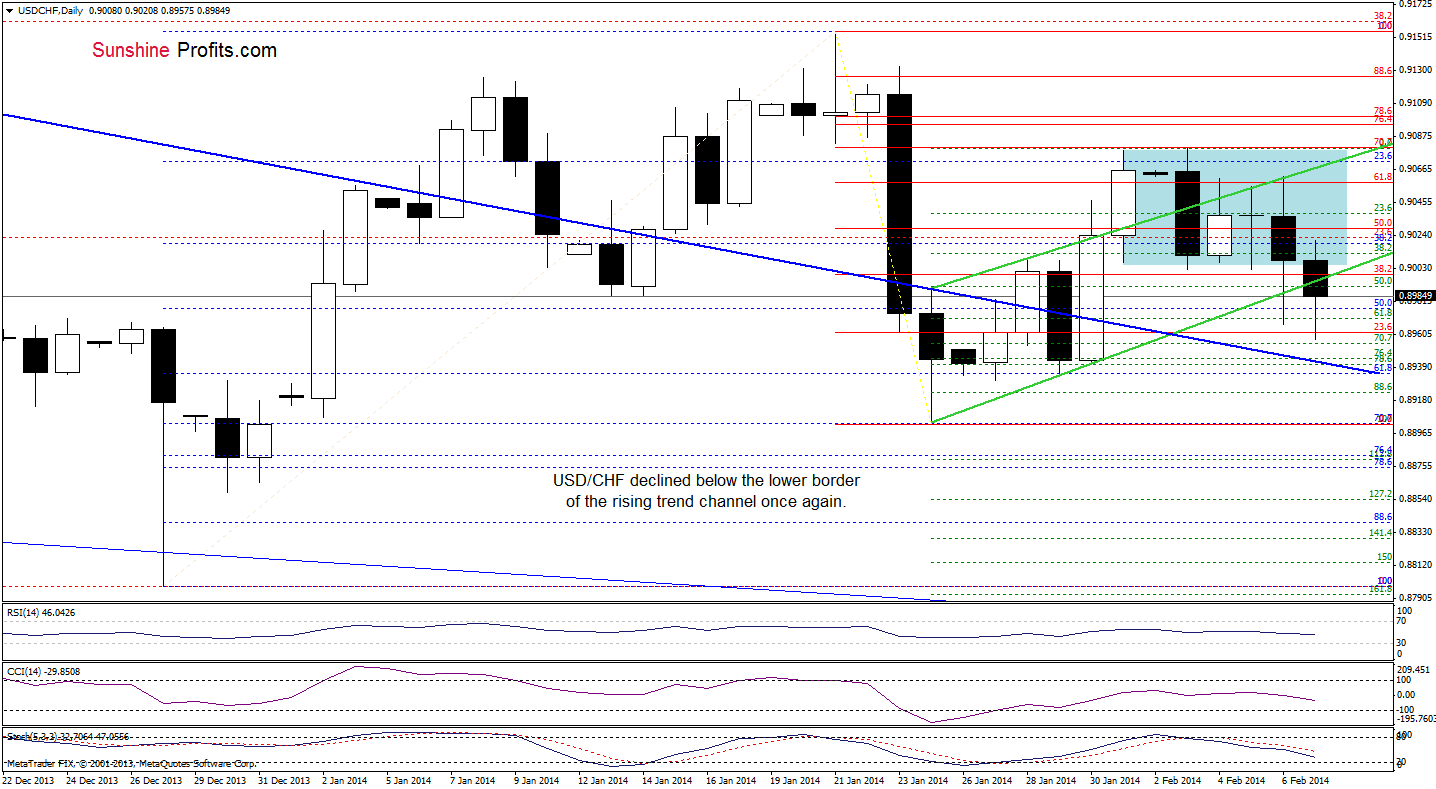
(…) USD/CHF broke below the lower border of the consolidation range (marked with blue) and slipped temporarily below the lower line of the trend channel (…) although the exchange rate reversed, it still remains below the resistance line created by the lower border of the consolidation range. Taking this fact into account, and combining with the position of the indicators, it seems that another attempt to move below the lower line of the trend channel is likely to be seen.
As you see on the above chart, although the pair climbed to the consolidation range, USD/CHF didn’t manage to hold these levels and declined below the lower line of the trend channel once again. With this downswing, the exchange rate almost reached the 70.7% Fibonacci retracement level (based on the recent rally) and approached the short-term declining support line (marked with blue). The proximity to this support encouraged buyers to act and resulted in a comeback to the trend channel. However, looking at the position of the indicators, it seems that another attempt to move to the short-term declining support line can’t be ruled out.
Very short-term outlook: mixed with bearish bias
Short-term outlook: mixed
MT outlook: bearish
LT outlook: bearish
Trading position (short-term): In our opinion no positions are justified from the risk/reward perspective. We will keep you informed should anything change, or should we see a confirmation/invalidation of the above.
AUD/USD
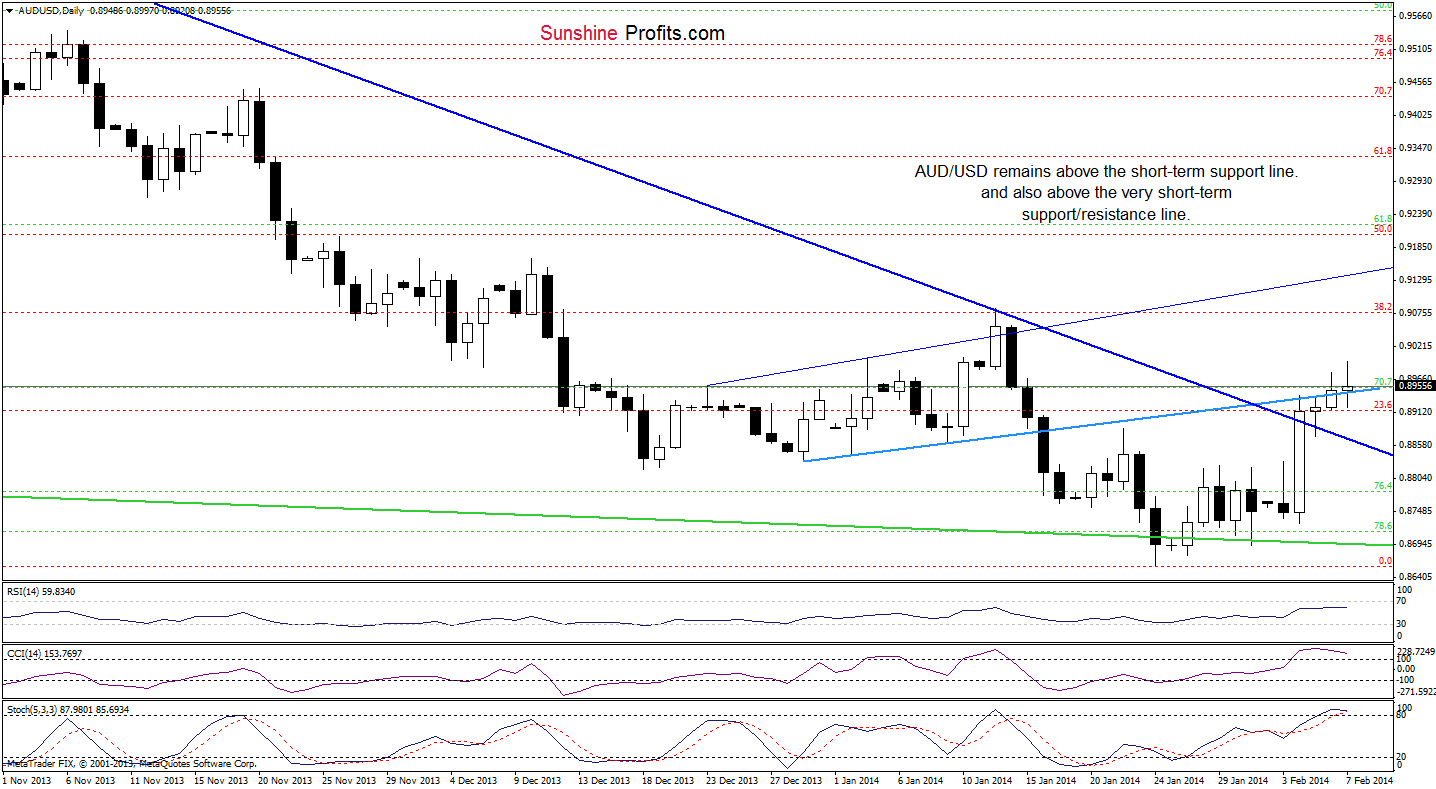
As you see on the above chart, AUD/USD extended gains and hit a fresh February high. Although the pair gave up some gains and declined slightly, it still remains above the very short-term blue rising line, which serves as support at the moment. Taking this fact into account, further improvement is still likely to be seen and the next upside target will be the 38.2% Fibonacci retracement level, which corresponds to the Jan. 13 high. Please note that the CCI and Stochastic Oscillator are overbought, which prescribe caution. Nevertheless, they didn’t generate sell signals and still support the bullish case.
Very short-term outlook: bullish
Short-term outlook: mixed with bullish bias
MT outlook: bearish
LT outlook: bearish
Trading position (short-term): long (stop-loss order: 0.8728 and an upside target: 0.9069). We will keep you informed should anything change as far as our opinion is concerned, or should we see a confirmation/invalidation of the above. The above is not an investment / trading advice and please note that trading (especially using leveraged instruments such as futures or on the Forex market) involves risk.
Thank you.
Nadia Simmons
Forex & Oil Trading Strategist
Forex Trading Alerts
Oil Investment Updates
Oil Trading Alerts

