
Earlier today, the greenback moved higher against the euro, the British pound and its Australian counterpart. However, the U.S. currency declined against the Swiss franc, yen and its Canadian counterpart. Did these moves change the outlook for major currency pairs? We invite you to read our today's Forex Trading Alert.
Forex Trading Positions - Summary:
EUR/USD
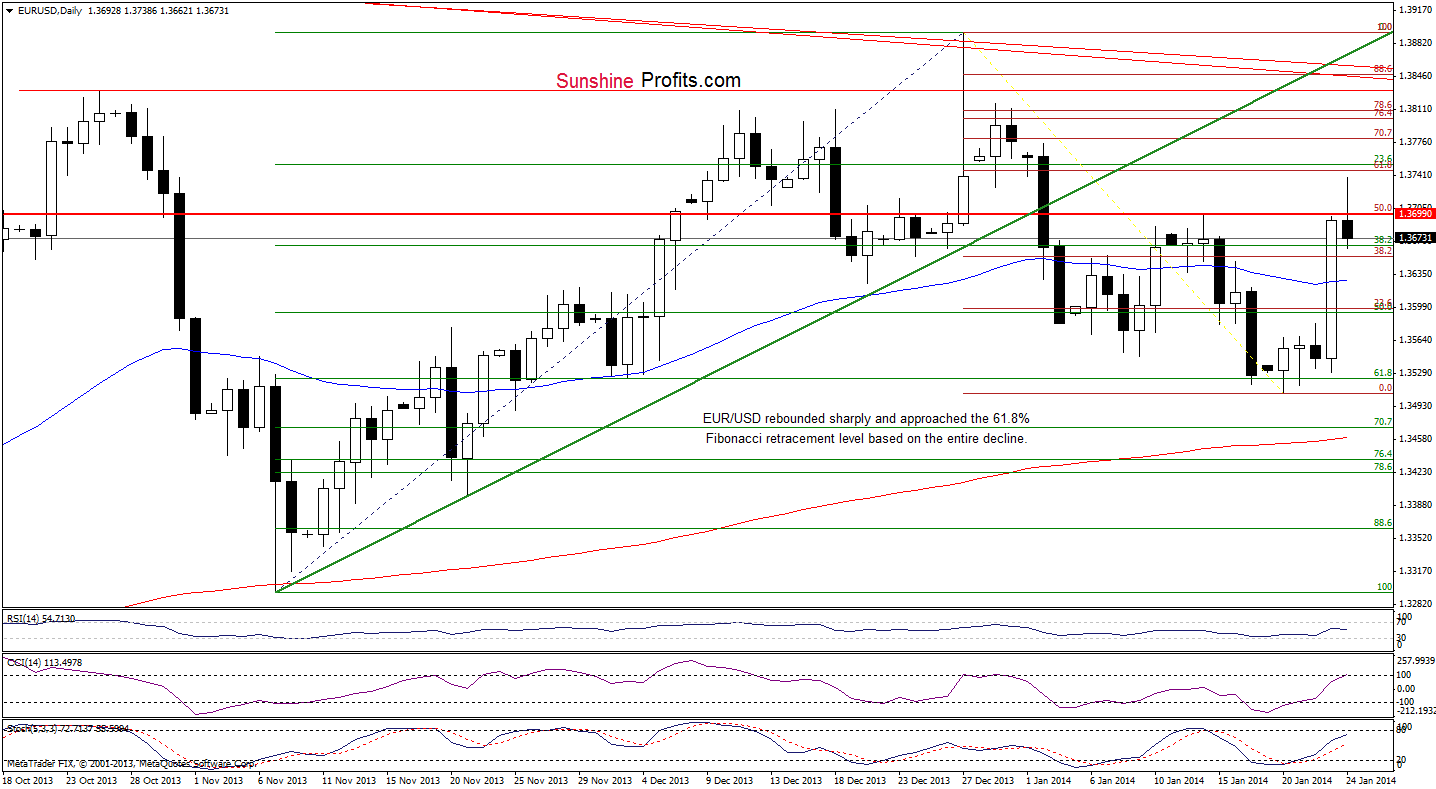
On the above chart, we see that EUR/USD extended gains after a breakout above the 38.2% Fibonacci retracement level based on the entire decline. Yesterday, the pair reached the next Fibonacci retracement level (which corresponds to the Jan. 14 high) and continued the rally earlier today. With this upward move, EUR/USD approached the 61.8% Fibonacci retracement level. However, this strong resistance level encouraged sellers to act and resulted in a pullback in the following hours. With this downswing, the pair invalidated the breakout above the previous Fibonacci retracement level, which is a bearish signal. Nevertheless, the current correction is still shallow and the indicators are not overbought, so we can’t rule out another attempt to reach the 61.8% Fibonacci retracement level.
Very short-term outlook: bullish
Short-term outlook: mixed
MT outlook: mixed with bearish bias
LT outlook: bearish
Trading position (short-term): The previous short position was closed at 1.3699 after we saw unexpected strength in the US currency. All in all, one can be correct no more than 60-80% of the time when it comes to predicting any market. At this time, we had the technical rules on our side (without them, the odds would be less favorable than mentioned above), but that was not enough - this time. Of course, trading is not a one-time event and looking back at this trade a few months from now, after a series of profitable trades, this one should not mean much. Trading is a continuous process and we will continue to do our best to bend the odds in your favor when it comes to profiting on currency price swings.
GBP/USD
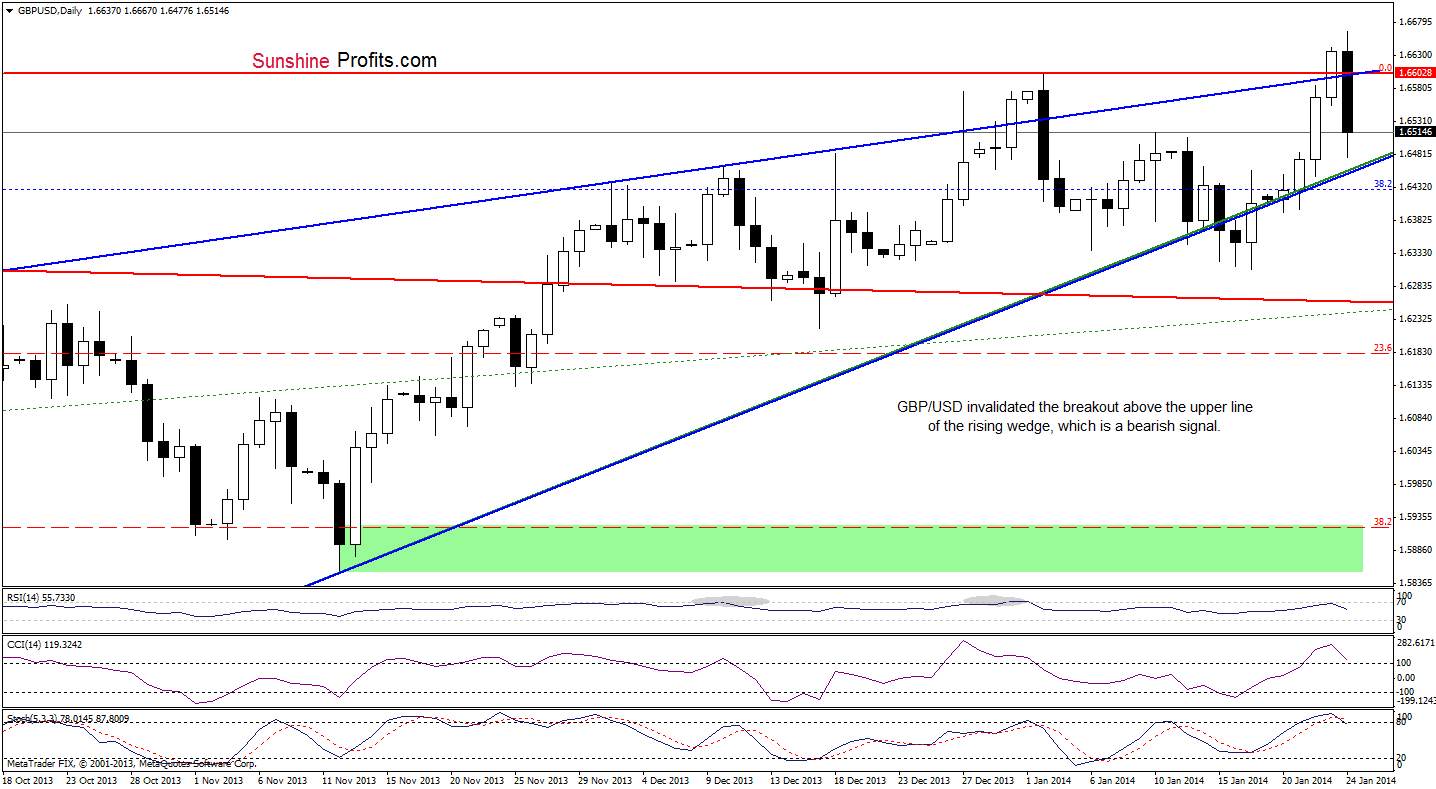
Looking at the above chart, we see that GBP/USD extended gains and hit a fresh January high. With this upward move, the pair broke above the upper border of the rising wedge (marked in blue) yesterday. Although we saw further improvement and a fresh annual high, the pair quickly reversed and invalidated both breakouts – above the previous high and above the upper border of the rising wedge. This was a strong bearish signal, which triggered a sharp decline in the following hours. With this downward move, the pair approached the lower border of the rising wedge and then rebounded. Despite this move, it is apparent that we had already seen similar price action at the beginning of the month. Back then, after an upward corrective move GBP/USD extended its decline and slipped below the lower border of the rising wedge. If history repeats itself once again, we will likely see further deterioration in the coming days. However, a corrective upswing before further declines can’t be ruled out.
Very short-term outlook: mixed with bearish bias
Short-term outlook: mixed
MT outlook: mixed
LT outlook: mixed
Trading position (short-term): we do not suggest opening any trading positions at the moment. We will keep you informed should anything change, or should we see a confirmation/invalidation of the above.
USD/JPY
In our Forex Trading Alert on Wednesday, we wrote:
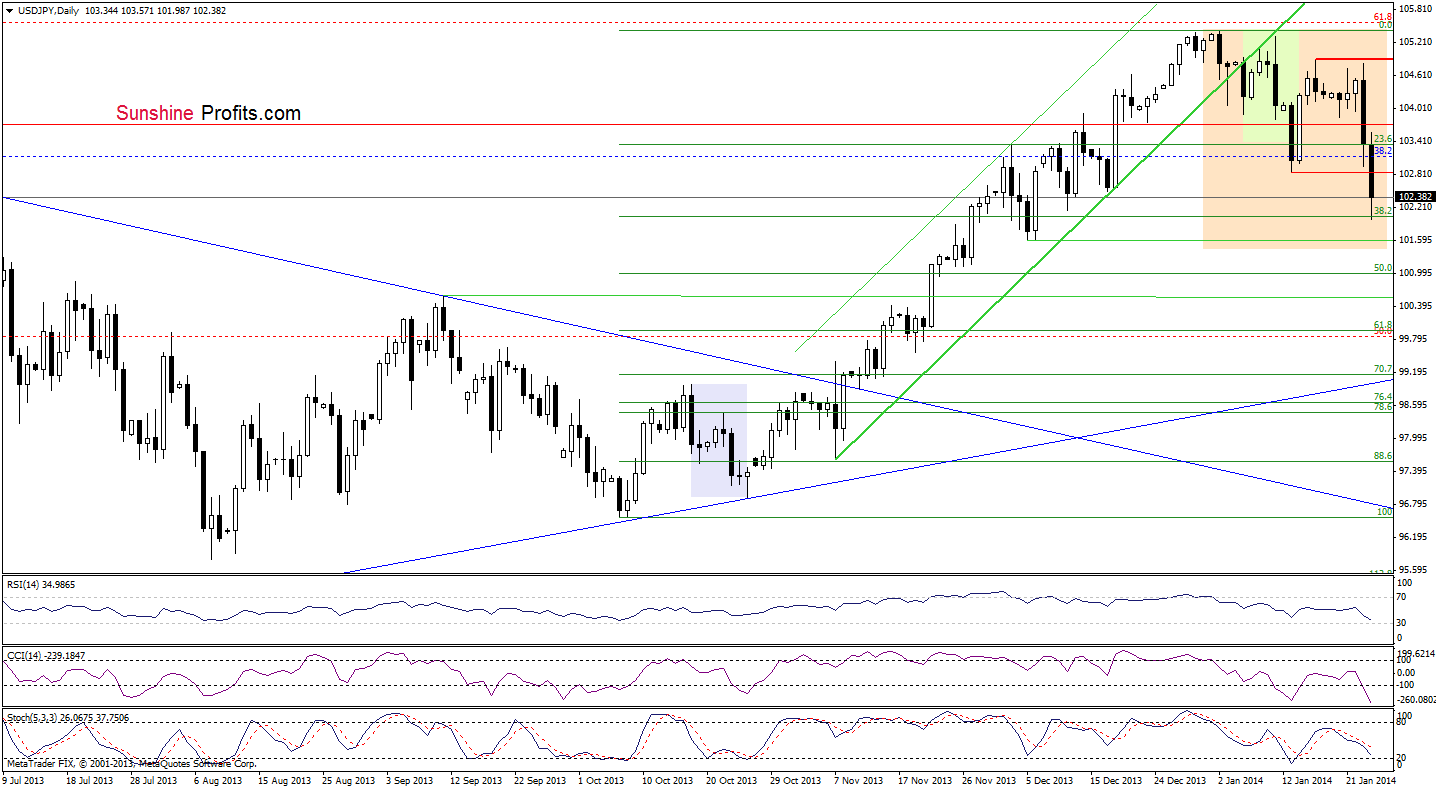
(…) recent days had formed a consolidation on the chart (…) if the pair drops below yesterday’s low, we will likely see further declines and the first downside target will be the January low at 102.84. Please note that the sell signal generated by the Stochastic Oscillator remains in place supporting sellers.
On the above chart, we recognize that we saw such price action as USD/JPY declined sharply after the breakdown below the Jan. 20 low. With this downward move, the pair reached the 38.2% Fibonacci retracement level based on the Oct. - Jan. rally. If this strong support encourages buyers to push the order button, we will likely see an upward corrective move. However, if this level is broken, the first downside target will be the Dec. 5 low at 101.61 and the next the 50% Fibonacci retracement level at 100.99.
Very short-term outlook: bearish
Short-term outlook: mixed with bearish bias
MT outlook: bullish
LT outlook: bearish
Trading position (short-term): we do not suggest opening any trading positions at the moment. We will keep you informed should anything change, or should we see a confirmation/invalidation of the above.
USD/CAD
In our last Forex Trading Alert, we wrote:
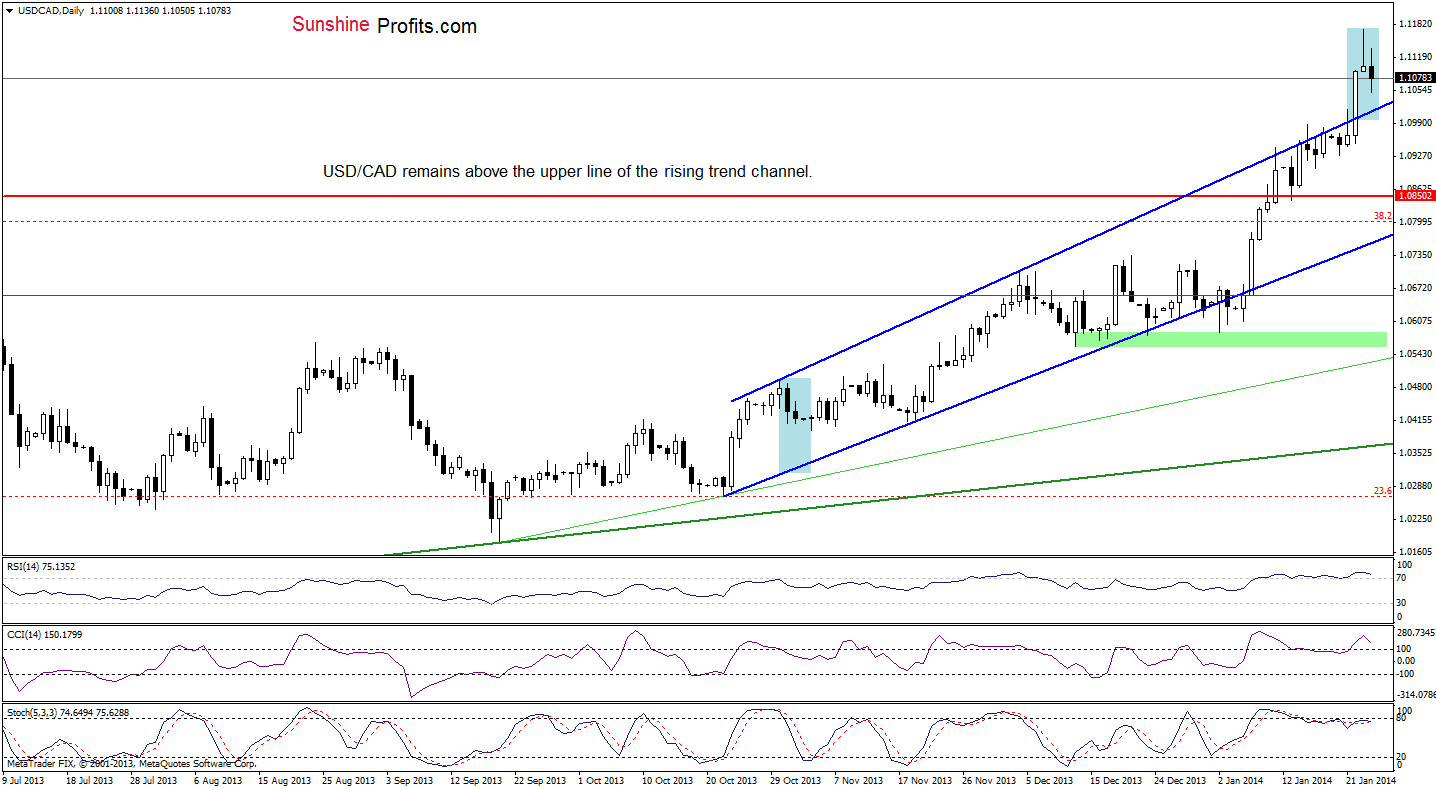
(…) the pair reached its upside target (marked with the blue rectangle) and approached the 50% Fibonacci retracement level. From this perspective, the space for further increases seems limited. Additionally, there are strong negative divergences between the CCI, Stochastic Oscillator and the exchange rate, which is a bearish signal. On top of that, the RSI is still overbought (well above the level of 70), which suggests that a pause or a correction is just around the corner.
Looking at the above chart, we see that USD/CAD reversed earlier today, but this correction is still very shallow and the pair remains above the previously-broken upper line of the rising trend channel (as long as the pair remains above this strong support zone, the space for declines will be limited). Nevertheless, we should keep in mind that the position of the indicators supports the bearish case and if the pair invalidates the breakout above the upper line of the rising trend channel, we will consider opening short positions.
Very short-term outlook: mixed
Short-term outlook: bullish
MT outlook: bullish
LT outlook: bearish
Trading position (short-term): we do not suggest opening any positions at the moment. We will keep you informed should anything change, or should we see a confirmation/invalidation of the above.
USD/CHF
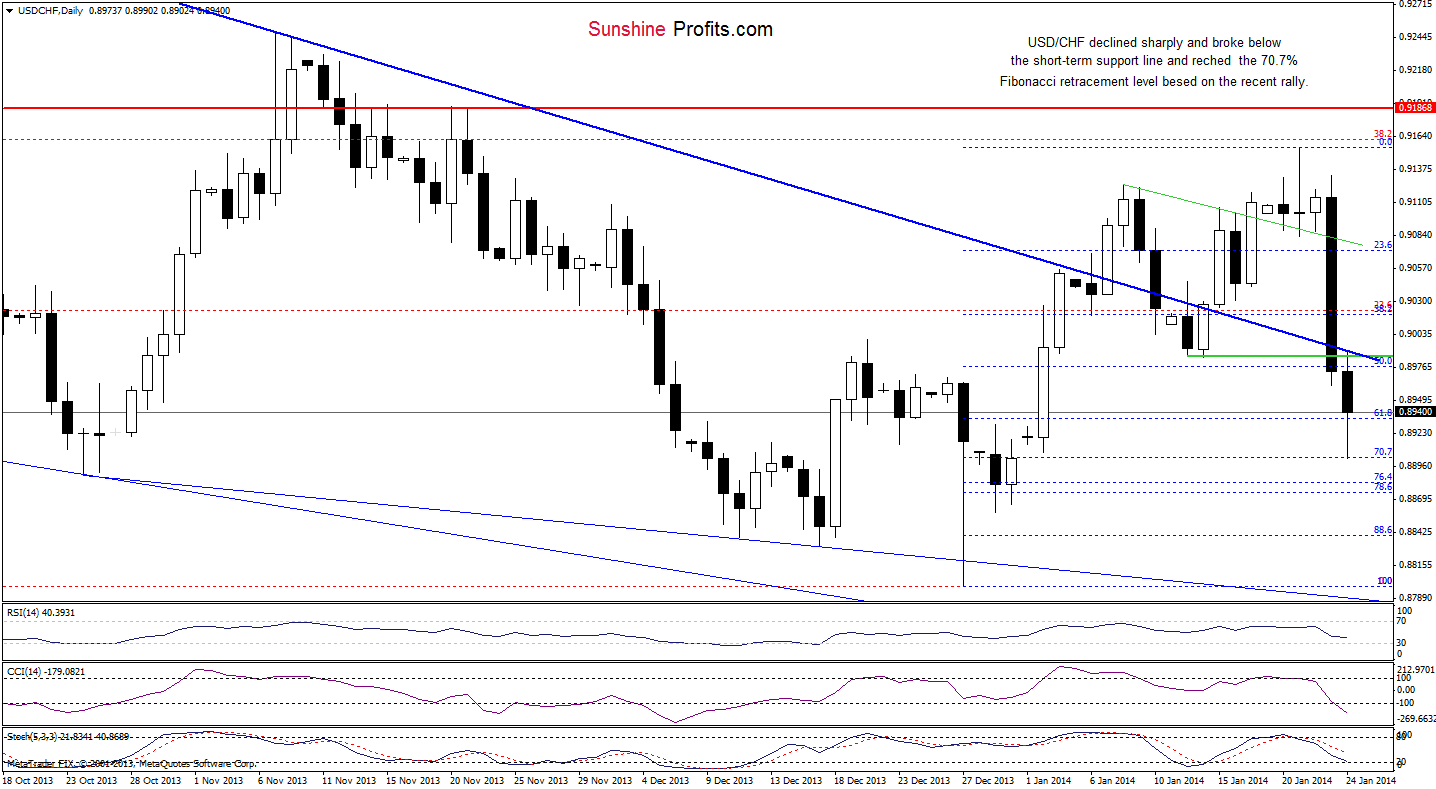
In our last Forex Trading Alert, we wrote:
(…) USD/CHF broke below the very short-term support line (…) reached a support zone created by the lower border of the consolidation range and the 38.2% Fibonacci retracement level based on the entire recent rally (…) if it is broken, we will see further deterioration and the next downside target will be the short-term declining support line (marked in blue) which successfully stopped sellers earlier this month (currently around 0.8989).
Looking at the above chart, we see that USD/CHF broke below the short-term declining support line and invalidated the earlier breakout. This strong negative signal encouraged the sellers to push the button earlier today and triggered further deterioration. With this downswing, the pair reached the 70.7% Fibonacci retracement level based on the entire recent rally. Although we saw some improvement in recent hours, it’s too early to say that the correction is over – especially when we factor in the position of the indicators. From this perspective, it seems that we may see a corrective upswing to the previously broken short-term declining support/resistance line. However, if the buyers fail, we will likely see further deterioration and the next downside target will be around 0.8883 where the next Fibonacci retracement is.
Very short-term outlook: bearish
Short-term outlook: bearish
MT outlook: bearish
LT outlook: bearish
Trading position (short-term): The previous long position was closed at 89.85 after we saw unexpected strength in the US currency. All in all, one can be correct no more than 60-80% of the time when it comes to predicting any market. At this time we had the technical rules on our side (without them, the odds would be less favorable than mentioned above), but that was not enough - this time. Of course, trading is not a one-time event and looking back at this trade a few months from now, after a series of profitable trades, this one should not mean much. Trading is a continuous process and we will continue to do our best to bend the odds in your favor when it comes to profiting on currency price swings.
AUD/USD
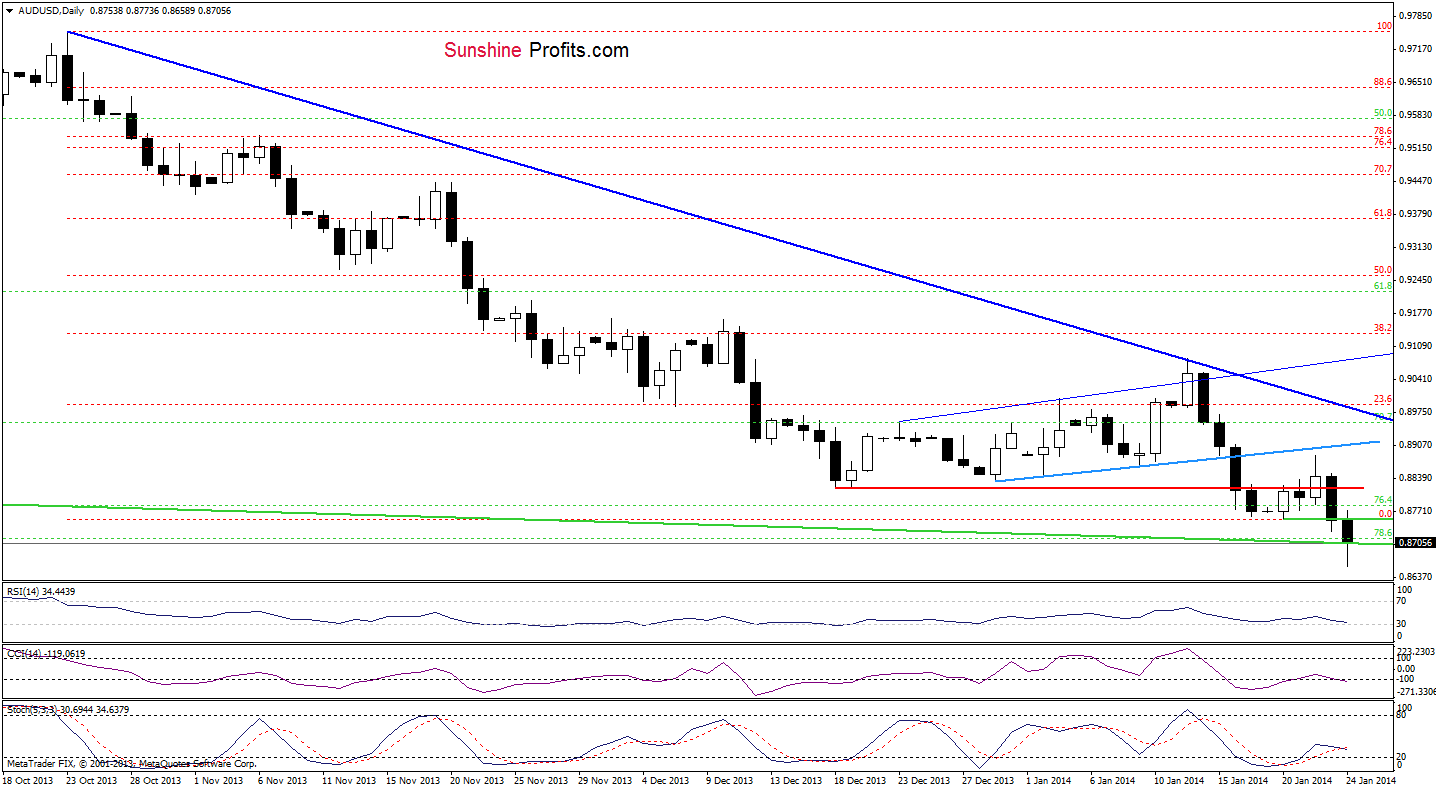
Quoting our last Forex Trading Alert:
(…) it seems that yesterday’s increase was a verification of the breakdown below the very short-term support line. If this is the case, we will likely see further deterioration and a drop below the January low. If the sellers actually break below this support level, the next downside price target will be the 78.6% Fibonacci retracement, which corresponds to the lower border of the declining trend channel.
Looking at the above chart, we notice that we saw such price action as AUD/USD extended the decline and reached its downside price target earlier today. Although the pair rebounded in the following hours, it is too early to say that the worst is behind the holders of the Australian currency.
When we take a closer look at the position of the indicators, we clearly see positive divergences between them and the exchange rate, which is a bullish signal. However, as long as the pair remains below the previous lows, we can’t rule out another downswing.
Very short-term outlook: bearish
Short-term outlook: bearish
MT outlook: bearish
LT outlook: bearish
Trading position (short-term): we do not suggest opening any positions at the moment. We will keep you informed should anything change, or should we see a confirmation/invalidation of the above.
Thank you.
Nadia Simmons
Forex & Oil Trading Strategist
Forex Trading Alerts
Oil Investment Updates
Oil Trading Alerts

