

After quite sharp movements that we could observe last week, currency pairs reached places that could cause consolidation and a momentary holiday calm. But when can we expect another bigger move in the case of EUR/USD, USD/JPY and USD/CHF?
EUR/USD
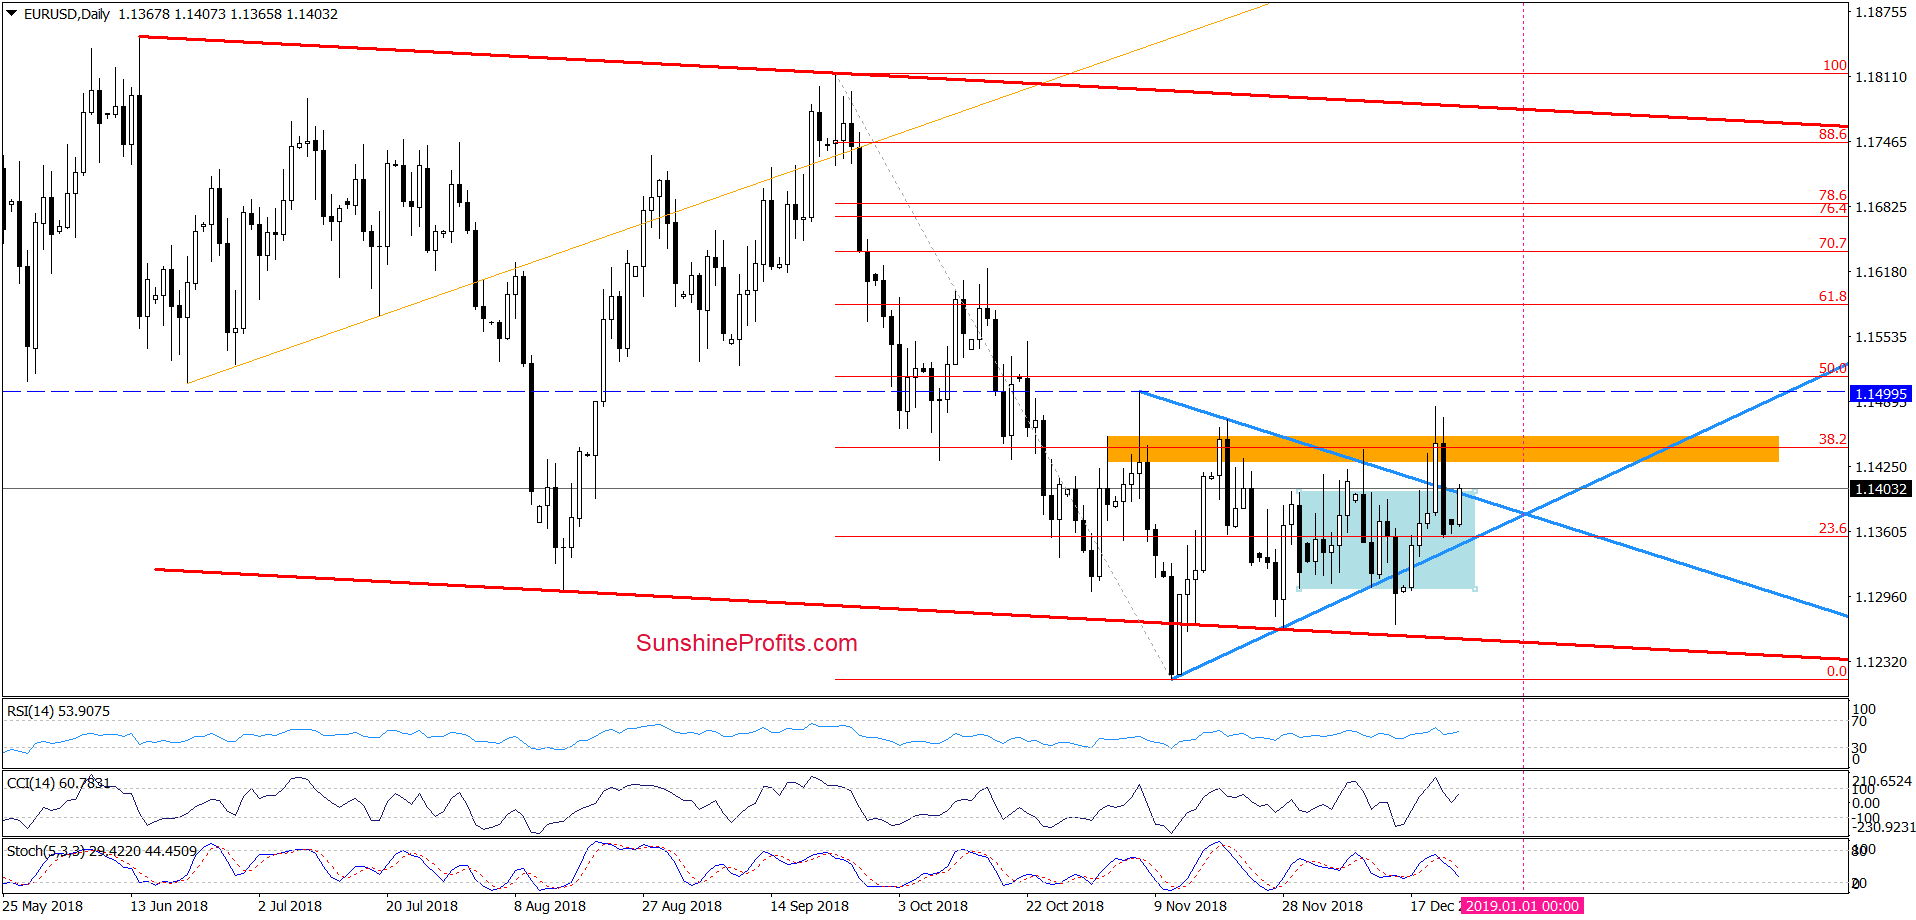
On Friday, EUR/USD slipped under the previously-broken orange zone, invalidating the Thursday’s breakout. This negative development, triggered further deterioration and a drop under the upper line of the blue triangle, making the very short-term situation even more bleak. As a result, the exchange rate wiped off nearly 60% of last week's increases by closing the session inside the blue triangle.
Despite this very bearish event, the buyers have made another attempt to break above the triangle during today's trade. Will their actions prove more effective this time? Unfortunately, we doubt it a little. Why? Because until there is another daily close above the upper line of the formation (the triangle), all upswings can be nothing more than just a verification of the Friday breakdown. In addition, the Stochastic Oscillator generated a sale signal giving the sellers another argument to act in the near future.
Connecting the dots, in our opinion, unless we see an effective breakout above the orange resistance zone or breakdown below the lower line of the triangle (and preferably below the low tit in mid-December) the next bigger move is unlikely and short-lived moves in both directions should not surprise us. We will keep you informed should anything change, or should we see a confirmation/invalidation of the above.
Trading position (short-term; our opinion): No positions are justified from the risk/reward perspective, but if the pair closes today’s session above all the aforementioned resistances, we’ll consider opening long positions.
USD/JPY
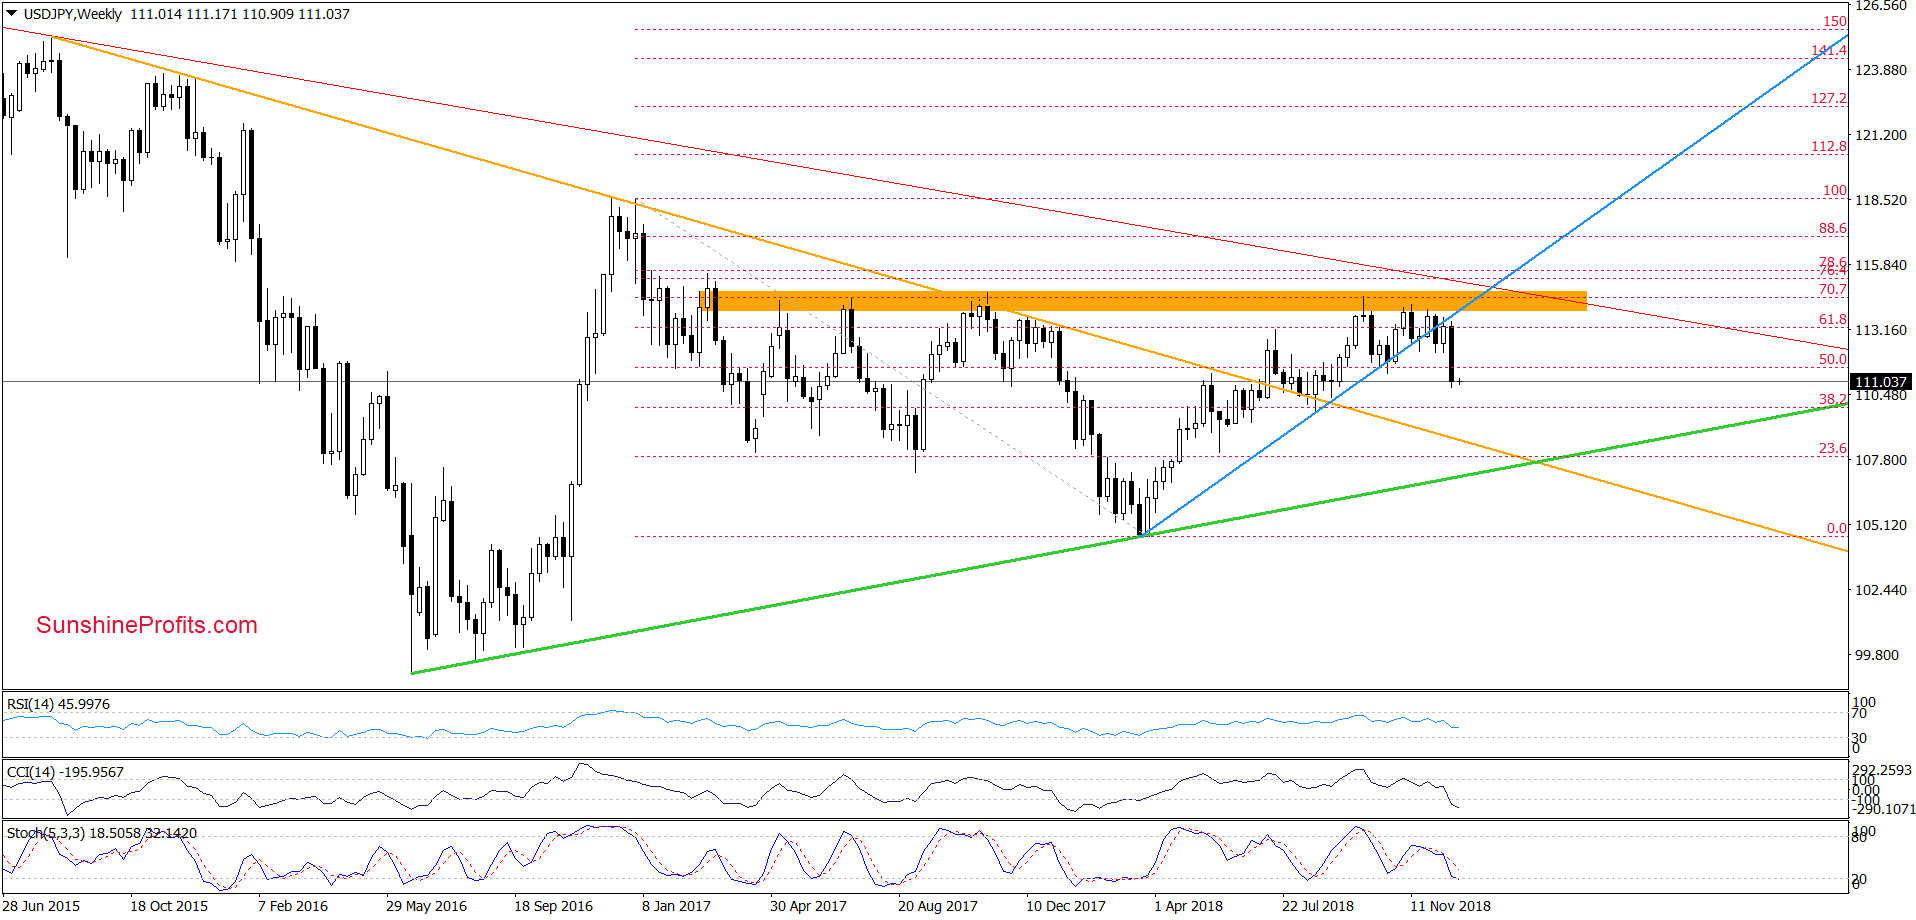
From the weekly perspective, we see that the situation deteriorated after USD/JPY moved sharply lower and broke below the earlier lows in the previous week.
How did this drop affect the short-term picture?
Let’s zoom in our chart to see more details.
In our last commentary on this currency pair, we wrote the following:
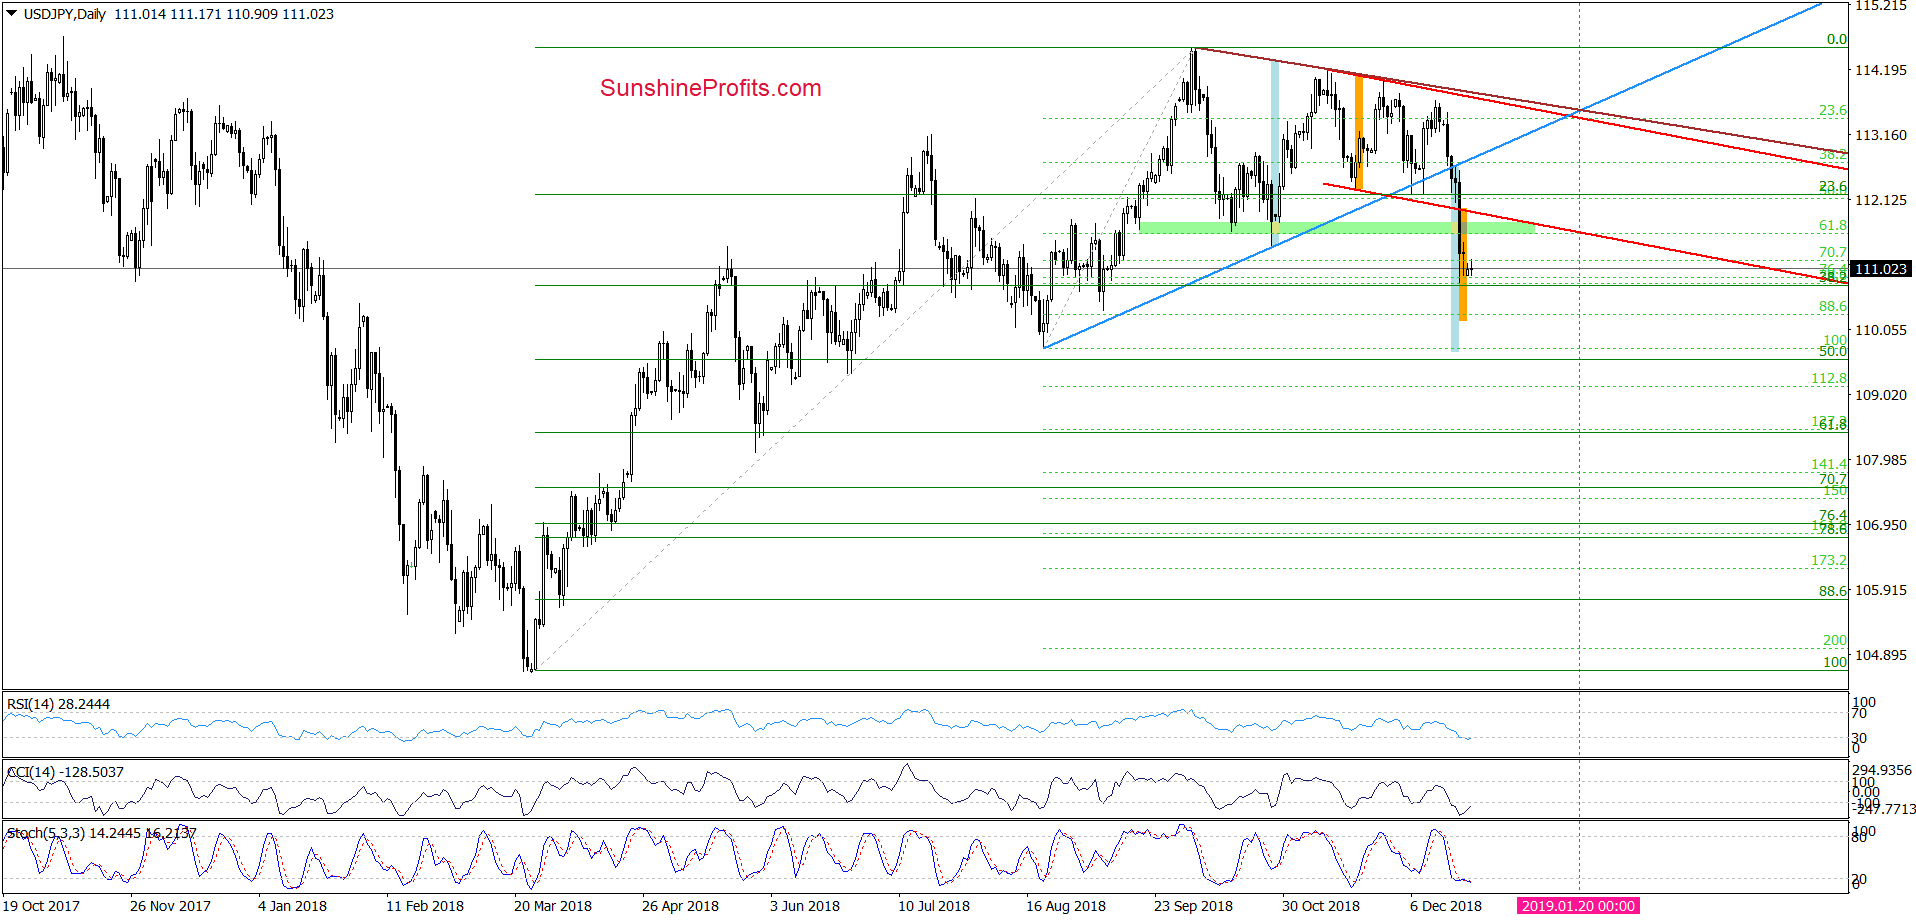
(…) How low USD/JPY could fall if the buyers failed during today's session? In our opinion, the pair could fall to around 111, where the next support zone based on 76.4% and 78.6% Fibonacci retracements is, or even to around 110.22, where the size of the downward movement would correspond to the height of the red declining trend channel.
On the daily chart, we see that currency bulls didn’t manage to hold the green support zone, which resulted in a sharp downward move, which took USD/JPY to our first downside target.
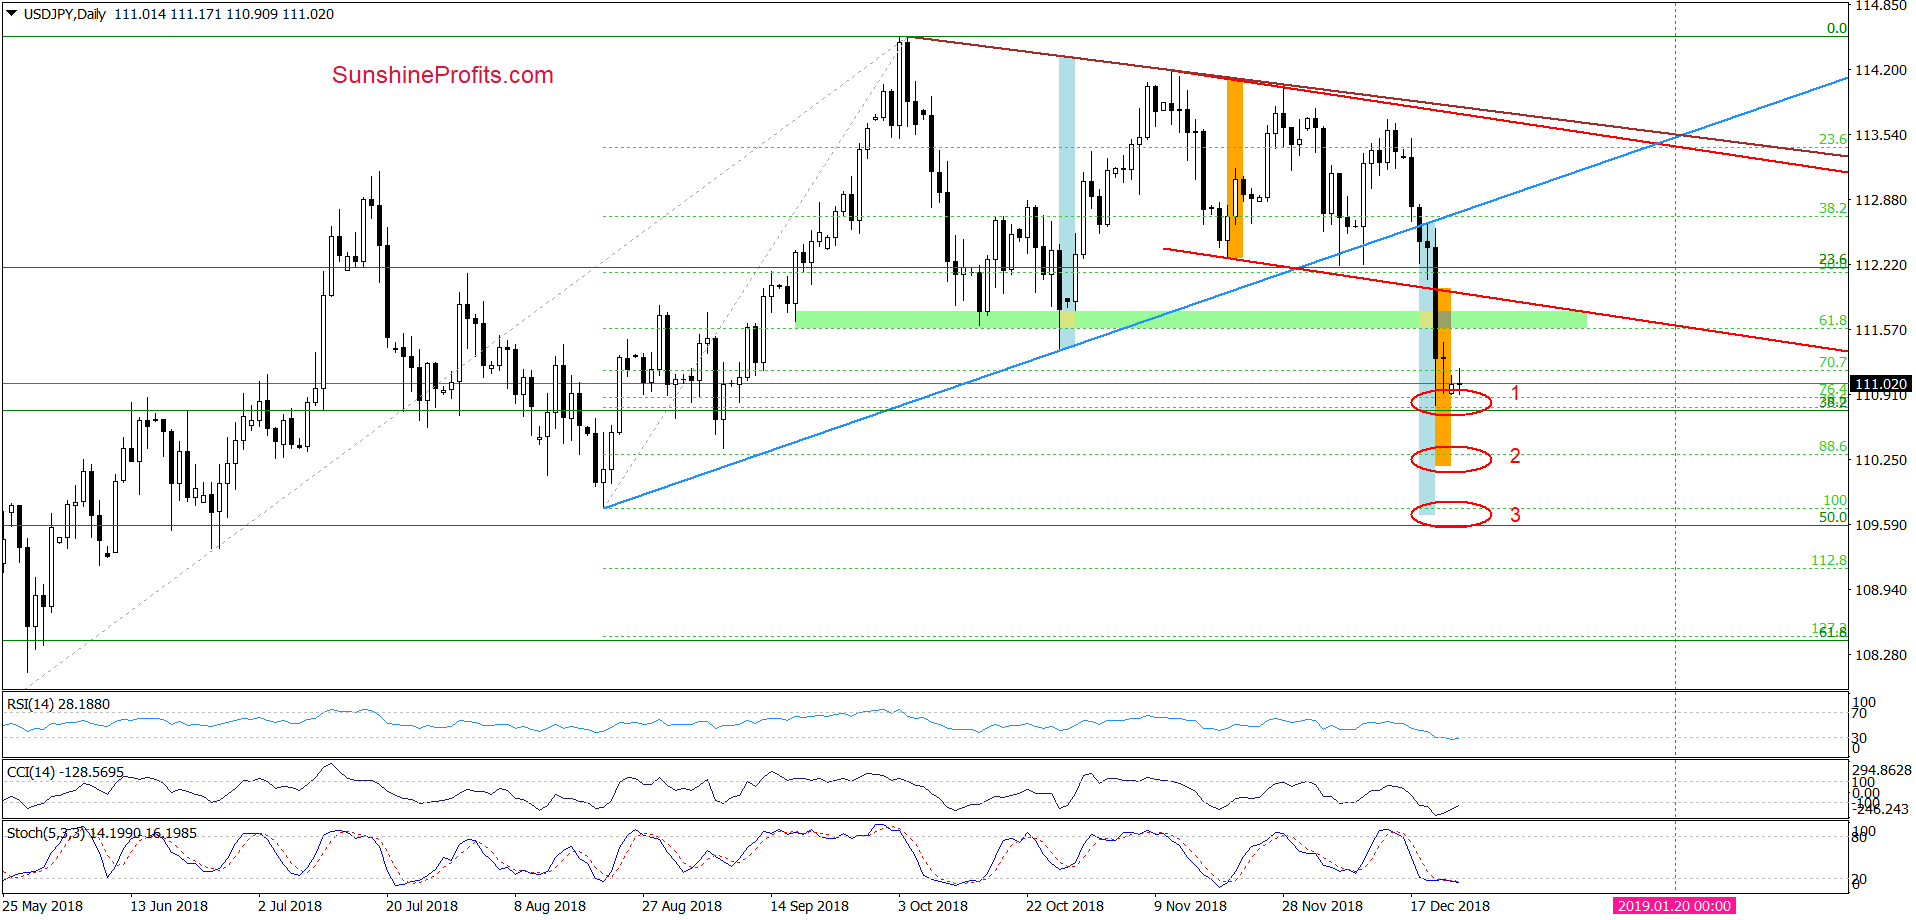
Since that drop, the exchange rate is consolidating slightly above the 38.2% Fibonacci retracement (based on the entire March-October upward move) and the 76.4% and 78.6% Fibonacci retracements (based on the August-October increases), which serves now as the nearest supports (we marked this area with the red ellipse with number 1).
Although the pair rebounded slightly earlier today, we think that one more downswing and a test of the 38.2% retracement is likely. If currency bulls stop their opponents in this area, an upward move and a comeback to the green zone will be quite likely. At this point, it is worth noting that such scenario is also reinforced by the current position of the daily indicators (they all dropped to their oversold areas and there is a visible bullish divergence between the pair and the CCI), which suggests that the space for declines might be limited.
Nevertheless, if the bulls fail once again, we can see further declines to our next downside target (we marked this area with the red ellipse with number 2).
Finishing today’s commentary on this currency pair, we would like to draw your attention to one more downside target - marked with the red ellipse with number 3. Why did we add it on the chart? Because USD/JPY broke below the medium-term blue support line, which is the bottom line of the triangle at the same time (the intersection of both arms of the formation will take place on January 20, but more on this subject will be written in the next commentary on this currency pair).
With this fact in mind, we must also take into account the scenario in which the currency pair can expand the downward move and fall even to the August low. Why? Because in this region the size of the decline will be the same size as the height of the triangle mentioned above. Nevertheless, currency bears will have to overcome much higher support before they can even dream about such low values of the exchange rate.
Trading position (short-term; our opinion): No positions are justified from the risk/reward perspective. We will keep you informed should anything change, or should we see a confirmation/invalidation of the above.
USD/CHF
Quoting our Thursday alert:
(…) although currency bulls took USD/CHF above the short-term brown declining resistance line based on the previous highs yesterday, this improvement did not last long.
Earlier today, currency bears attacked, which led to an invalidation of yesterday’s small breakout above this line. (…) this negative development triggered further deterioration and a comeback to the earlier December low.
Although this price action can translate into a double-bottom formation and cause a rebound from here, we should keep in mind that the sell signals generated by the CCI and the Stochastic Oscillator remain in the cards, suggesting that lower values of USD/CHF are just around the corner.
If this is the case and the pair declines from current levels, the sellers will likely test the mid-October lows and the 50% Fibonacci retracement in the following days (around 0.9833-0.9846).
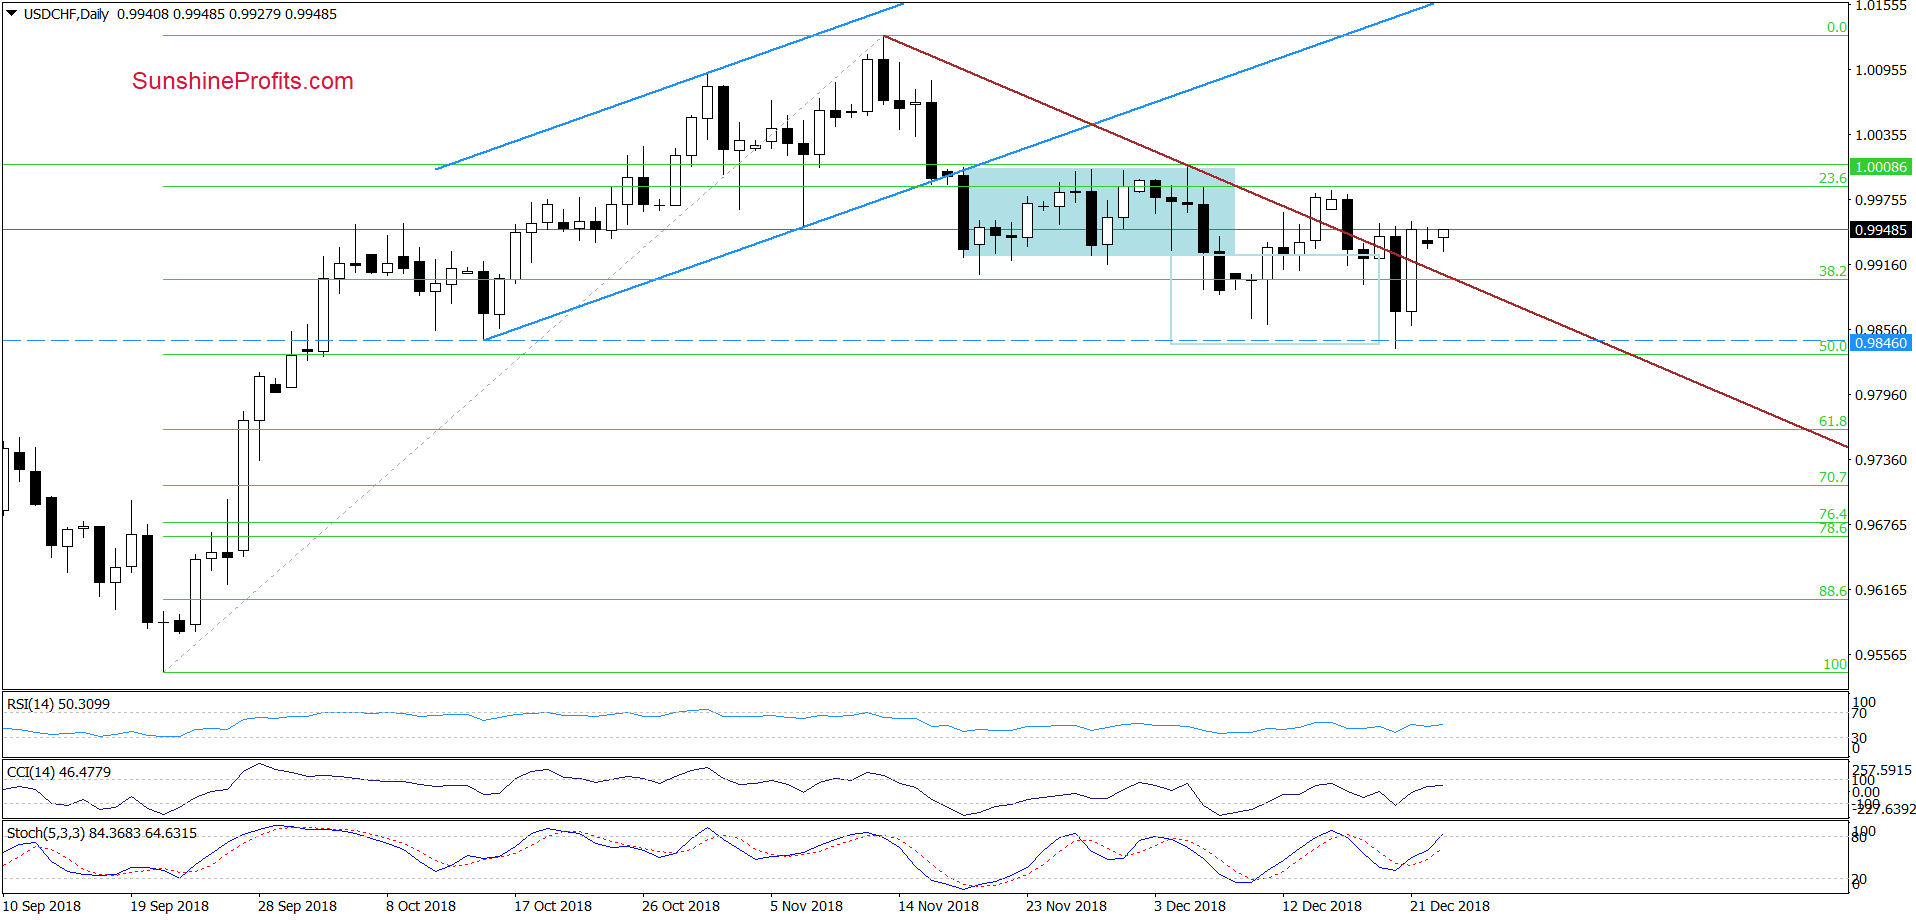
Looking at the daily chart, we see that the situation developed in line with our assumptions and USD/CHF slipped to the downside target, closing our short positions with a profit.
What’s interesting on the following day, the pair rebounded quite sharply, invalidating the earlier breakdown under the brown declining line once again. Earlier today, USD/CHF moved a bit higher, which in combination with the buy signals generated by the daily indicators suggests that we can see a test of the last week’s peaks.
Nevertheless, in our opinion, as long as there is no daily closure above them and a comeback above the upper border of the blue consolidation another reversal can’t be ruled out.
Trading position (short-term; our opinion): No short positions are justified from the risk/reward perspective.
On an administrative note, due to holiday travel plans, there will be no Forex Trading Alert on Wednesday, December 26, 2018. The next Forex Trading Alert is scheduled for Thursday, December 27, 2018.
Thank you.
Nadia Simmons
Forex & Oil Trading Strategist
Przemyslaw Radomski, CFA
Founder, Editor-in-chief, Gold & Silver Fund Manager
Gold & Silver Trading Alerts
Forex Trading Alerts
Oil Investment Updates
Oil Trading Alerts

