

In our opinion, the following forex trading positions are justified - summary:
- EUR/USD: long (a stop-loss order at 1.0954; the initial upside target at 1.1157)
- GBP/USD: long (a stop-loss order at 1.2720; the initial upside target at 1.2976)
- USD/JPY: short (a stop-loss order at 110.03; the initial downside target at 107.14)
- USD/CAD: long (a stop-loss order at 1.3070; the exit target at 1.3278)
- USD/CHF: short (a stop-loss order at 1.0001; the initial downside target at 0.9849)
- AUD/USD: none
EUR/USD
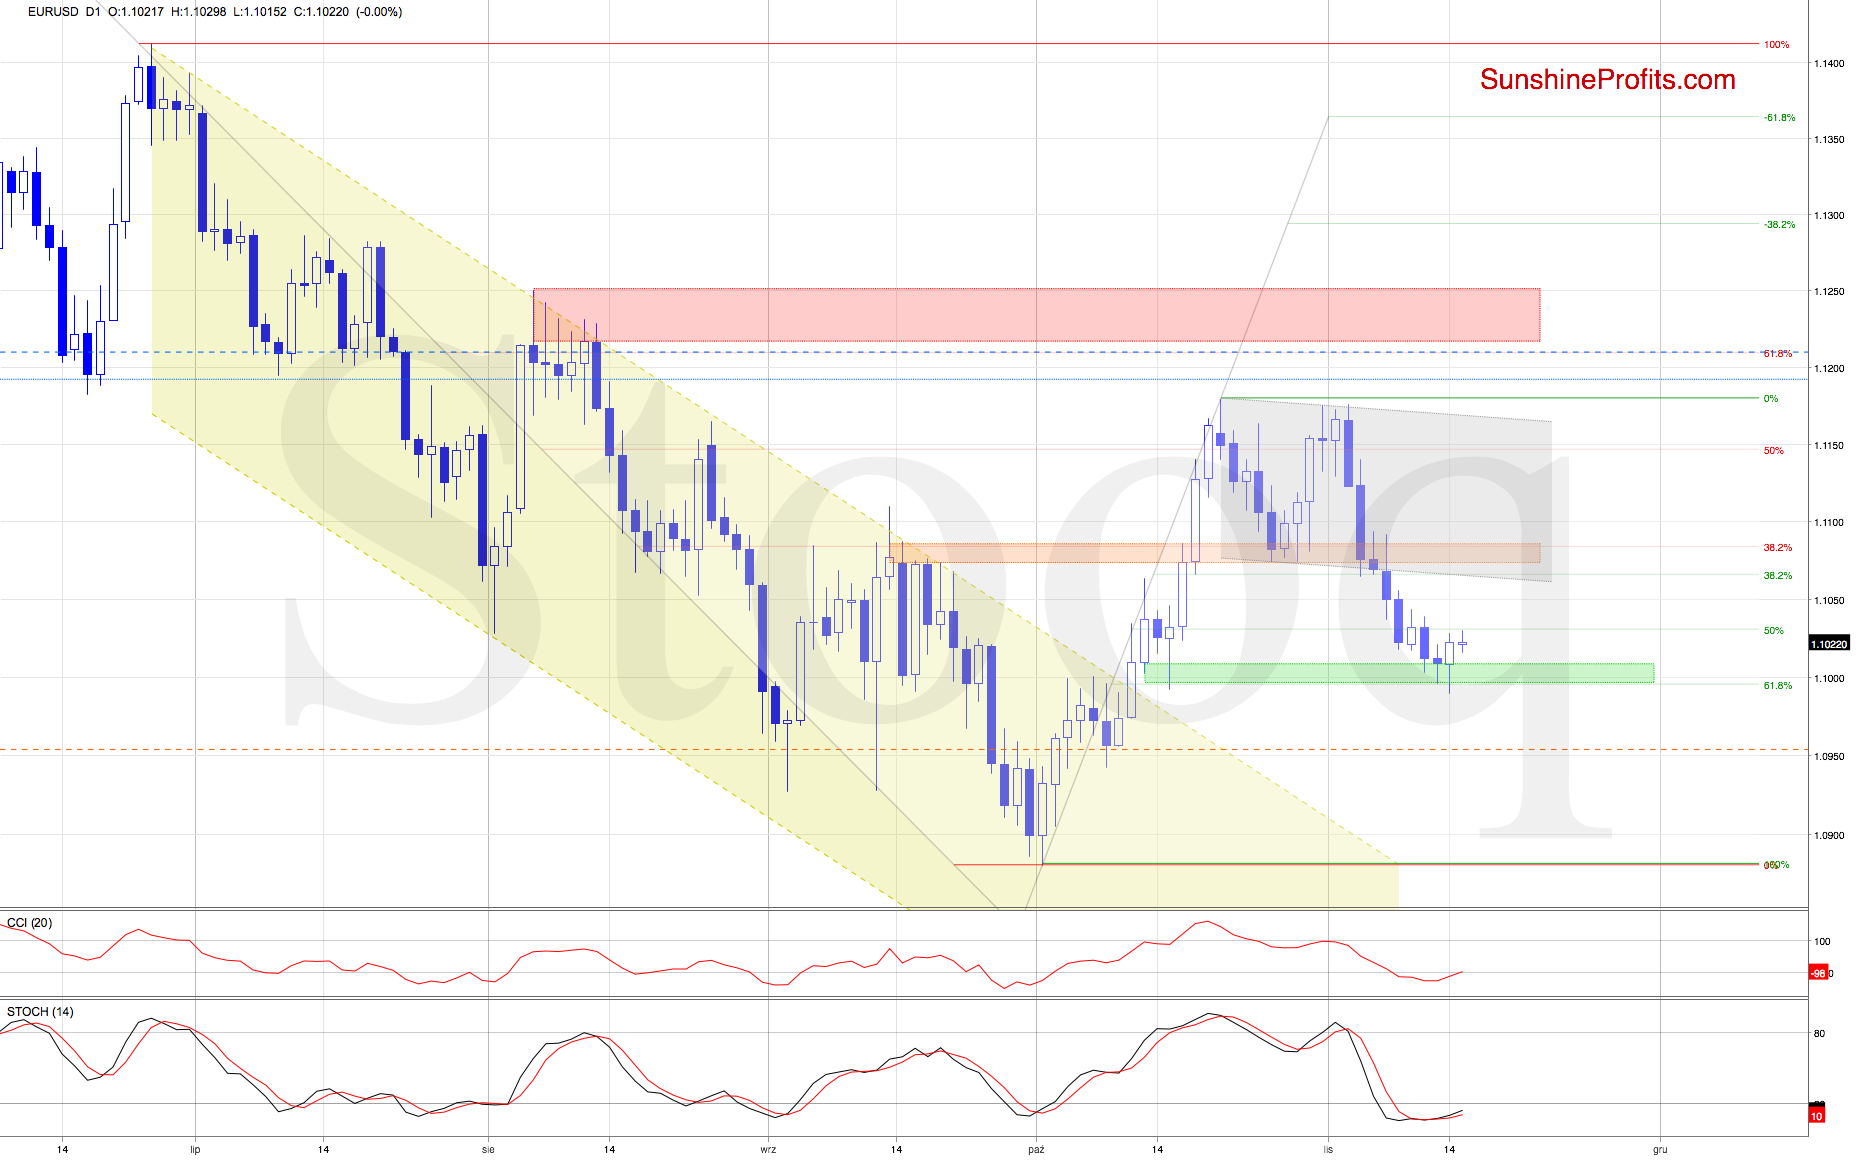
The EUR/USD bears were stopped at the combination of the green support zone based on mid-Oct lows and the 61.8% Fibonacci retracement yesterday. A rebound followed, resulting in the exchange rate invalidating the earlier tiny breakdown below these supports.
This suggests further improvement, especially when we factor in the buy signals generated by the daily indicators.
Should it be the case and the pair extends gains from here, we'll see at least an increase to the previously broken lower border of the declining grey trend channel in the coming week.
Trading position (short-term; our opinion): long positions with a stop-loss order at 1.0954 and the initial upside target at 1.1157 are justified from the risk/reward perspective.
USD/JPY
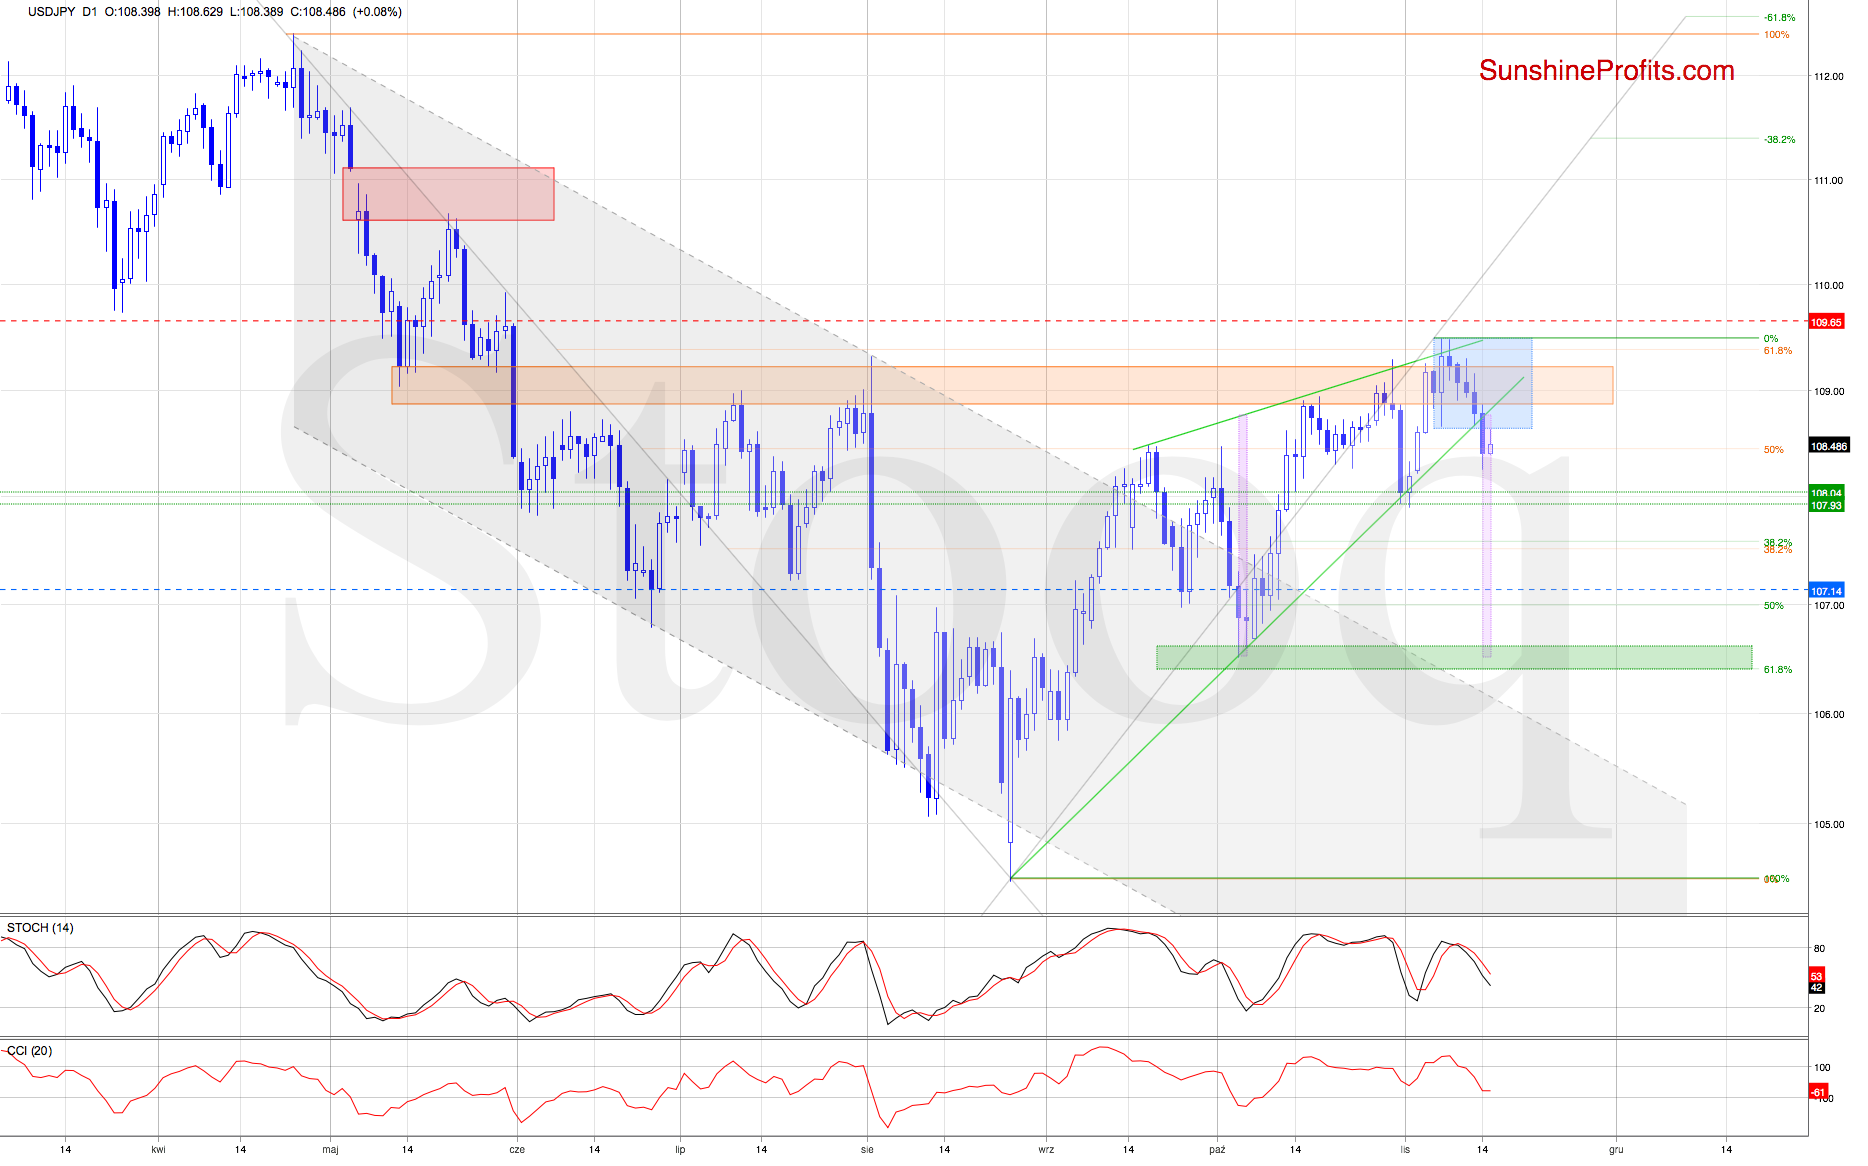
USD/JPY has been steadily decreasing in recent days, as the bulls had trouble overcoming the orange resistance zone. The pair has ended its losing streak with today's rise, however. Does it mark the end of its decline, or is there more to come?
Let's recall our Wednesday's commentary on this currency pair:
(...) USD/JPY recently attempted breakout above both the upper border of the rising green wedge, and the upper border of the orange resistance zone. It has been invalidated, though. The fact is that invalidation of a breakout is a bearish development.
Additionally, both the CCI and the Stochastic Oscillator have generated their sell signals, which increases the probability of upcoming deterioration.
The exchange rate is however still trading inside the blue consolidation and the rising green wedge. A bigger move to the downside will be more likely and reliable only if the bears push USD/JPY below the lower borders of both formations.
Should we see such price action, the way to the early-Nov lows will be open.
The situation has indeed developed in tune with the above, and the pair's move lower has made our short positions more profitable.
Yesterday brought us a breakdown below the lower border of the rising green wedge, which is a bearish development. This is especially the case when we factor in the sell signals generated by the daily indicators and yesterday's breakdown below the lower border of the blue consolidation.
Then, there is also today's tiny move to the upside, which looks like a verification of yesterday's breakdown below the consolidation. All in all, the short positions are justified from the risk/reward perspective, and it seems we won't have to wait long for the bearish scenario to be realized.
Indeed, yesterday's breakdown below the green wedge has opened the way to even lower levels. Should USD/JPY break below the support area created by the recent lows (marked with two horizontal lines on the above chart) the way to the green support zone created by the early-Oct lows and the 61.8% Fibonacci retracement would be then up for grabs.
Interestingly, this is where the size of the downward move would correspond to the height of the rising wedge, which raises the likelihood of the bears cashing profits in this area. In other words, should we see reliable signs of the bulls' weakness there, we could move our current profit target lower. It'll be interesting, so stay tuned.
Trading position (short-term; our opinion): Short positions with a stop-loss order at 110.03 and the initial downside target at 107.14 are justified from the risk/reward perspective.
USD/CAD
On Friday, we noted that:
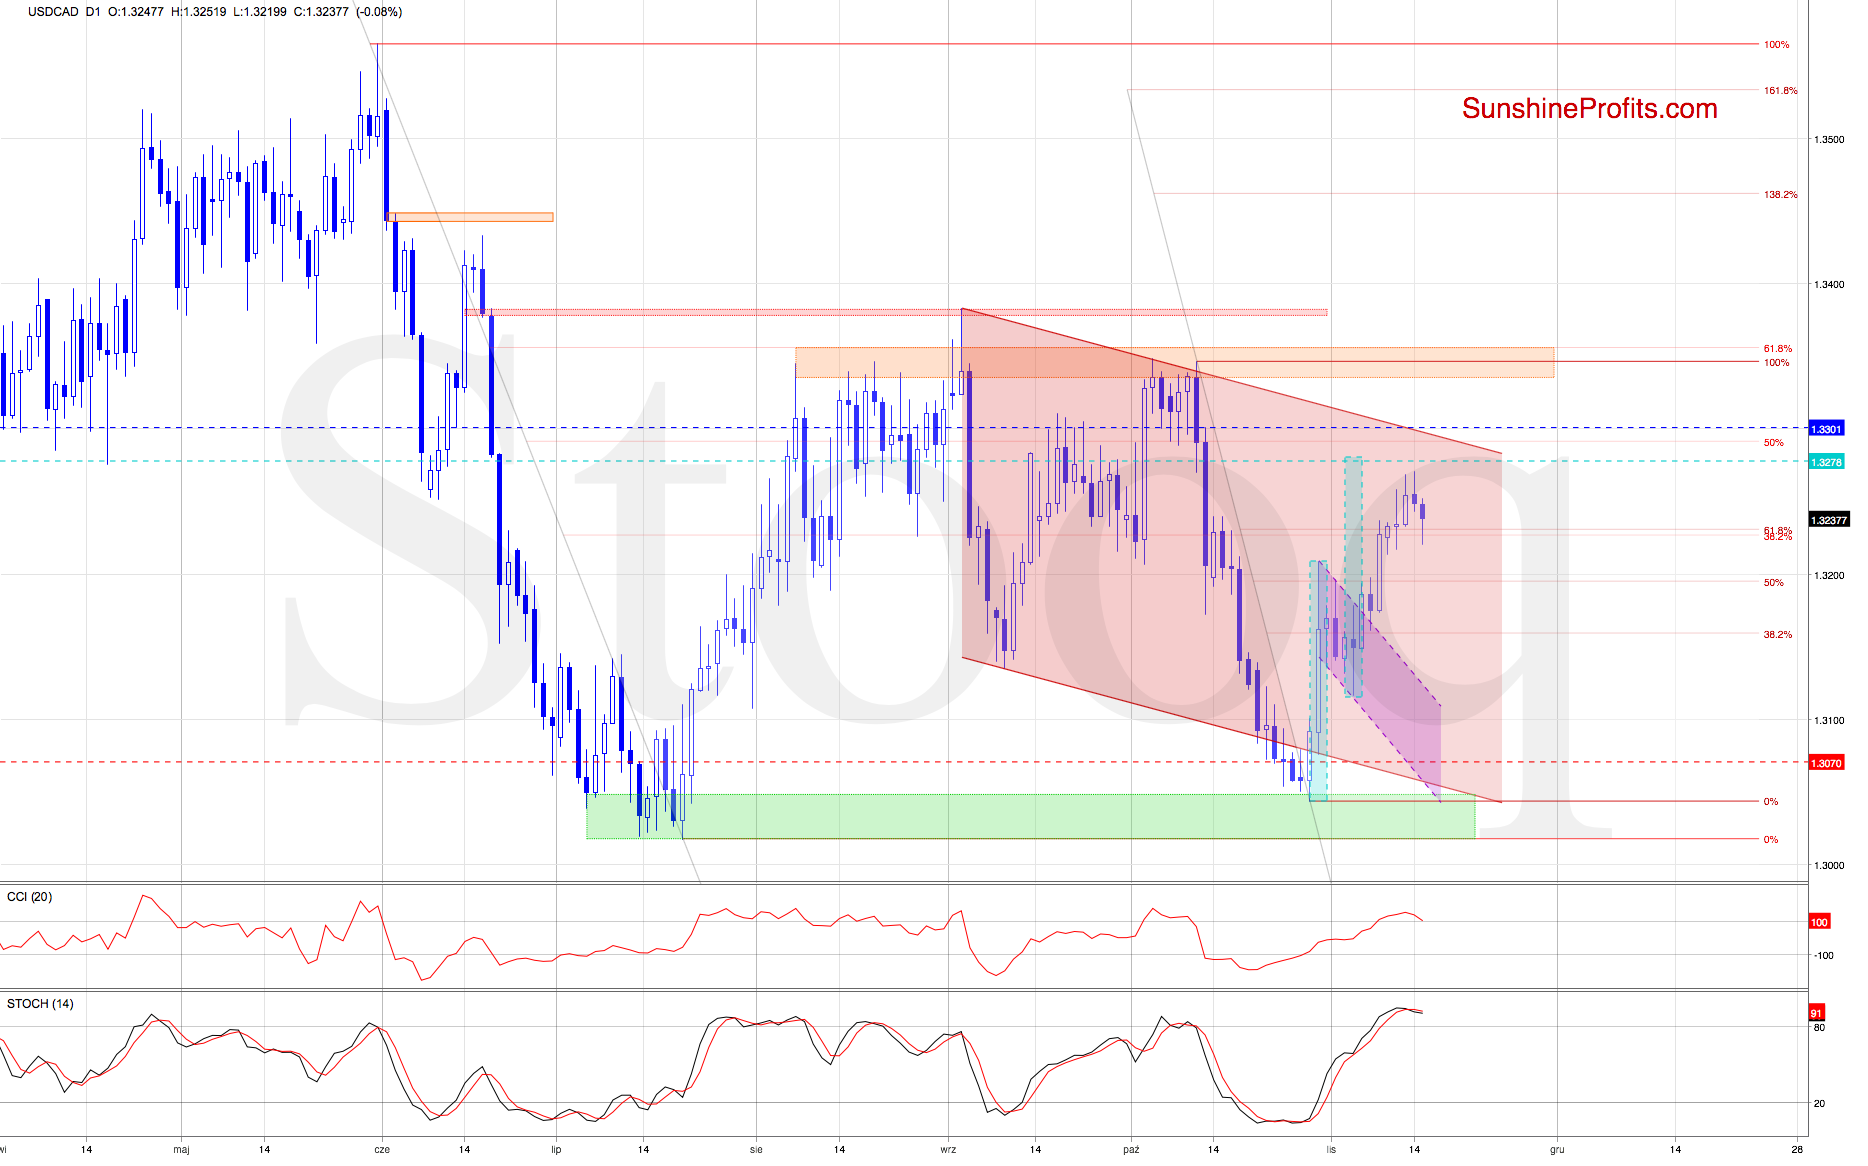
(...) Yesterday brought us verification of the breakout above the declining purple trend channel, suggesting that higher values of USD/CAD are just around the corner.
Should we see the pair rise from here, the first target for the bulls will be the last week's peak and then the 61.8% Fibonacci retracement (at around 1.3232).
And these were our Wednesday's observations:
(...) The situation indeed developed in tune with the above, and USD/CAD overcame not only the late-Oct high, but also the 61.8% Fibonacci retracement, making our long positions even more profitable.
Despite the pair pulling back yesterday, the bulls managed to keep the price action above the previously broken retracements . This suggests that yesterday's drop could be nothing more than verification of the earlier breakout.
Should it be the case, the way to the 50% Fibonacci retracement (based on the entire May-July decline) or even the upper border of the declining red trend channel may be open.
As expected, the previously broken retracement withstood Wednesday's selling pressure. This way, the pair verified the earlier breakout, going higher and hitting a fresh Nov peak during yesterday's session.
The bulls however took take some profits, triggering a pullback. Earlier today, we saw further deterioration, but the previously broken 61.8% Fibonacci retracement continues to serve as support, triggering a rebound in the following hours.
This means the tiny intraday breakdown invalidation, which is a bullish development. Another move higher may follow. It would be supported by the positive price action since late-October. What are we getting at exactly?
When October gave way to November, USD/CAD moved sharply higher, up to the 50% Fibonacci retracement. Then, it pulled back, sliding inside the declining purple trend channel, reversing and continuing even higher. This is what a flag pattern looks like: it's a consolidation within the pre-existing trend. In a flag, prices are reluctant to move much lower, and the correction tends to wear you off rather in time. And patience was exactly what we needed back then in USD/CAD.
Should it be the case and we're again looking at a flag, we'll likely see further improvement and a fresh November peak hit in the coming week.
Take a look slightly above the recent highs. The size of the upward move would correspond there to the height of the mentioned formation (marked with the turquoise rectangles for your convenience).
Connecting the dots, we lowered our upside target a little, and changed it to the exit target to make sure that our long position will be closed with a satisfactory profit without the risk of a sudden reversal when other bulls start cashing their profits.
The cautious approach is also supported by overextended levels of daily indicators. The Stochastic Oscillator even generated its sales signal, which underscores the risk of reversal in the very near future.
Trading position (short-term; our opinion): Long positions with a stop-loss order at 1.3070 and the exit target at 1.3278 are justified from the risk/reward perspective.
Thank you.
Nadia Simmons
Forex & Oil Trading Strategist

