

EUR/USD looks to be slowly but surely building on recent gains. Can it last and how high can the pair go? The Swiss frank and Australian dollar are also deserve our attention. Are there any indications for us to act?
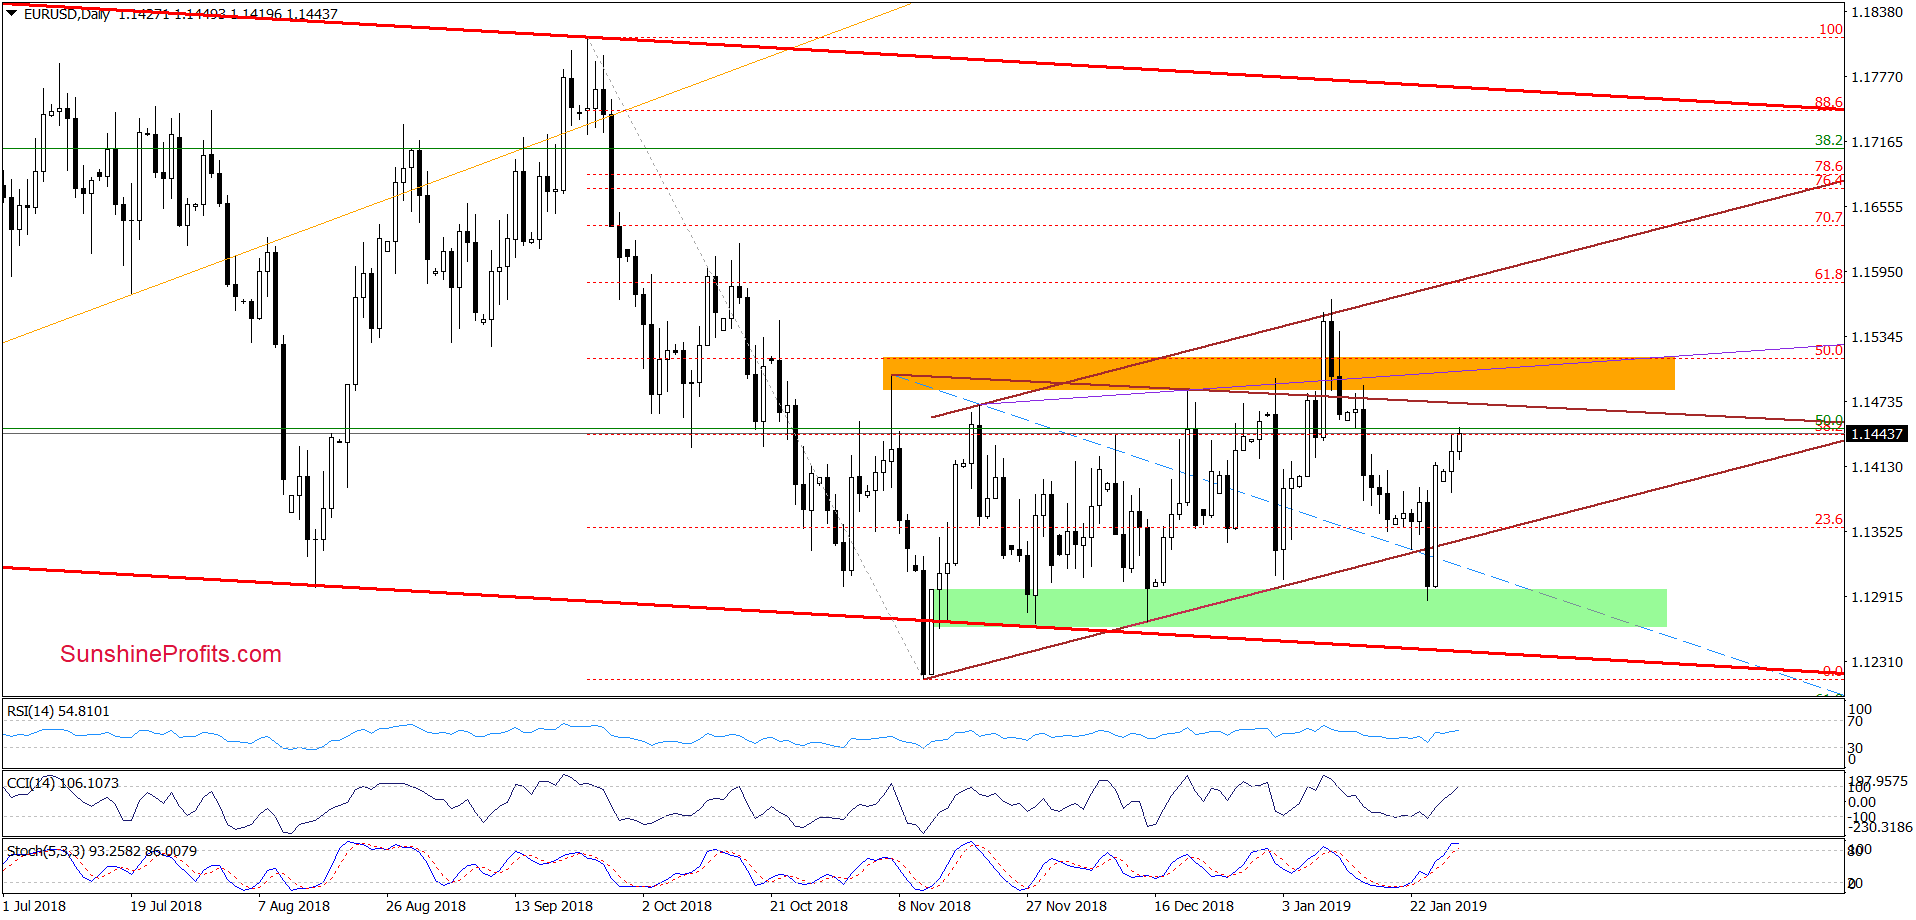
On Monday, EUR/USD refused to move lower and extended gains instead. Today's price action is building on them and the pair is currently trading at yesterday's intraday highs. We made a right decision to close the previous very profitable short position and cash in the profits.
What we wrote yesterday, is up-to-date also today:
(…) If this is the case and the pair extends gains from the current levels, we’ll likely see a test of the upper border of the brown triangle and the orange resistance zone in the coming days.
Short-term indicators are positioned in a bullish way with CCI leading the pack. No surprise, because CCI is a sensitive indicator that is generally fast to display market changes. However, the proximity of the upper border of the brown triangle is likely to provide at least a short-term hurdle to the bulls, and the same goes for the 38.2% Fibonacci retracement. That means a limited upside potential for the time being and as a result, we will watch the pair for further developments. These can come in the form of either a verified breakout above resistances (namely the upper border of the brown triangle and the orange resistance zone) or more likely as a rejection of breakout attempts and accompanying exhaustion of the buyers.
We will keep you informed should anything change, or should we see a confirmation/invalidation of the above.
Trading position (short-term; our opinion): No positions are justified from the risk/reward perspective.
USD/CHF
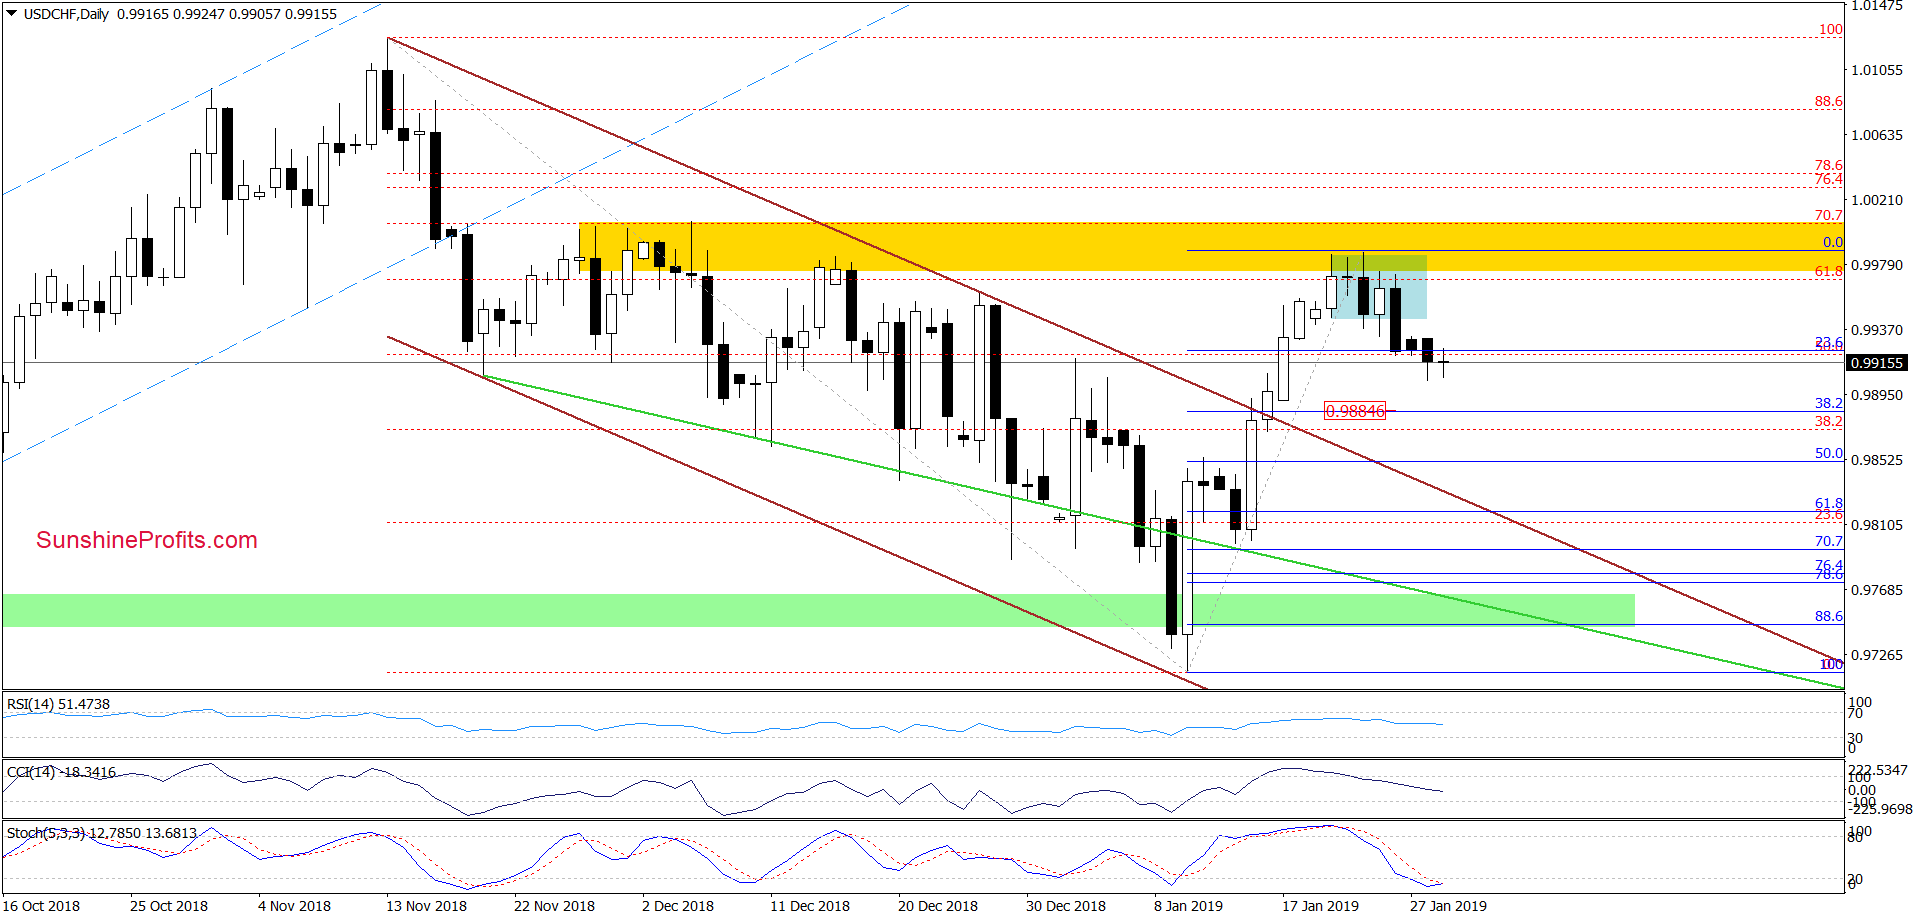
The daily chart shows that the yellow resistance zone remains a formidable obstacle to the currency bulls. This is in line with what we wrote recently:
(…) We see that although the sellers tried to go south in recent days, their attempts failed, and USD/CHF came back into the blue consolidation. Although this is a positive sign, we should keep in mind that the exchange rate is still trading under the yellow resistance zone and the sell signals generated by the indicators continue to support the sellers and lower values of the pair.
Indeed, USD/CHF broke below the lower border of the blue consolidation, which in combination with the sell signals generated by the daily indicators and the mentioned proximity to the yellow resistance zone triggered a correction of the recent upward move.
Yesterday, the pair slipped under the 23.6% Fibonacci retracement, which suggests that we’ll likely see further deterioration and a test of the 38.2% Fibonacci retracement in the following days. This scenario is also reinforced by the lack of buy signals on the daily indicators. There are no bullish divergences forming on the horizon to support the bulls either. Therefore, a test of the declining upper border of the brown channel would not surprise us further down the road.
We will keep a watchful eye should anything warranting a change happen.
Trading position (short-term; our opinion): No positions are justified from the risk/reward perspective.
AUD/USD
Let's start with our Friday observations on this pair:
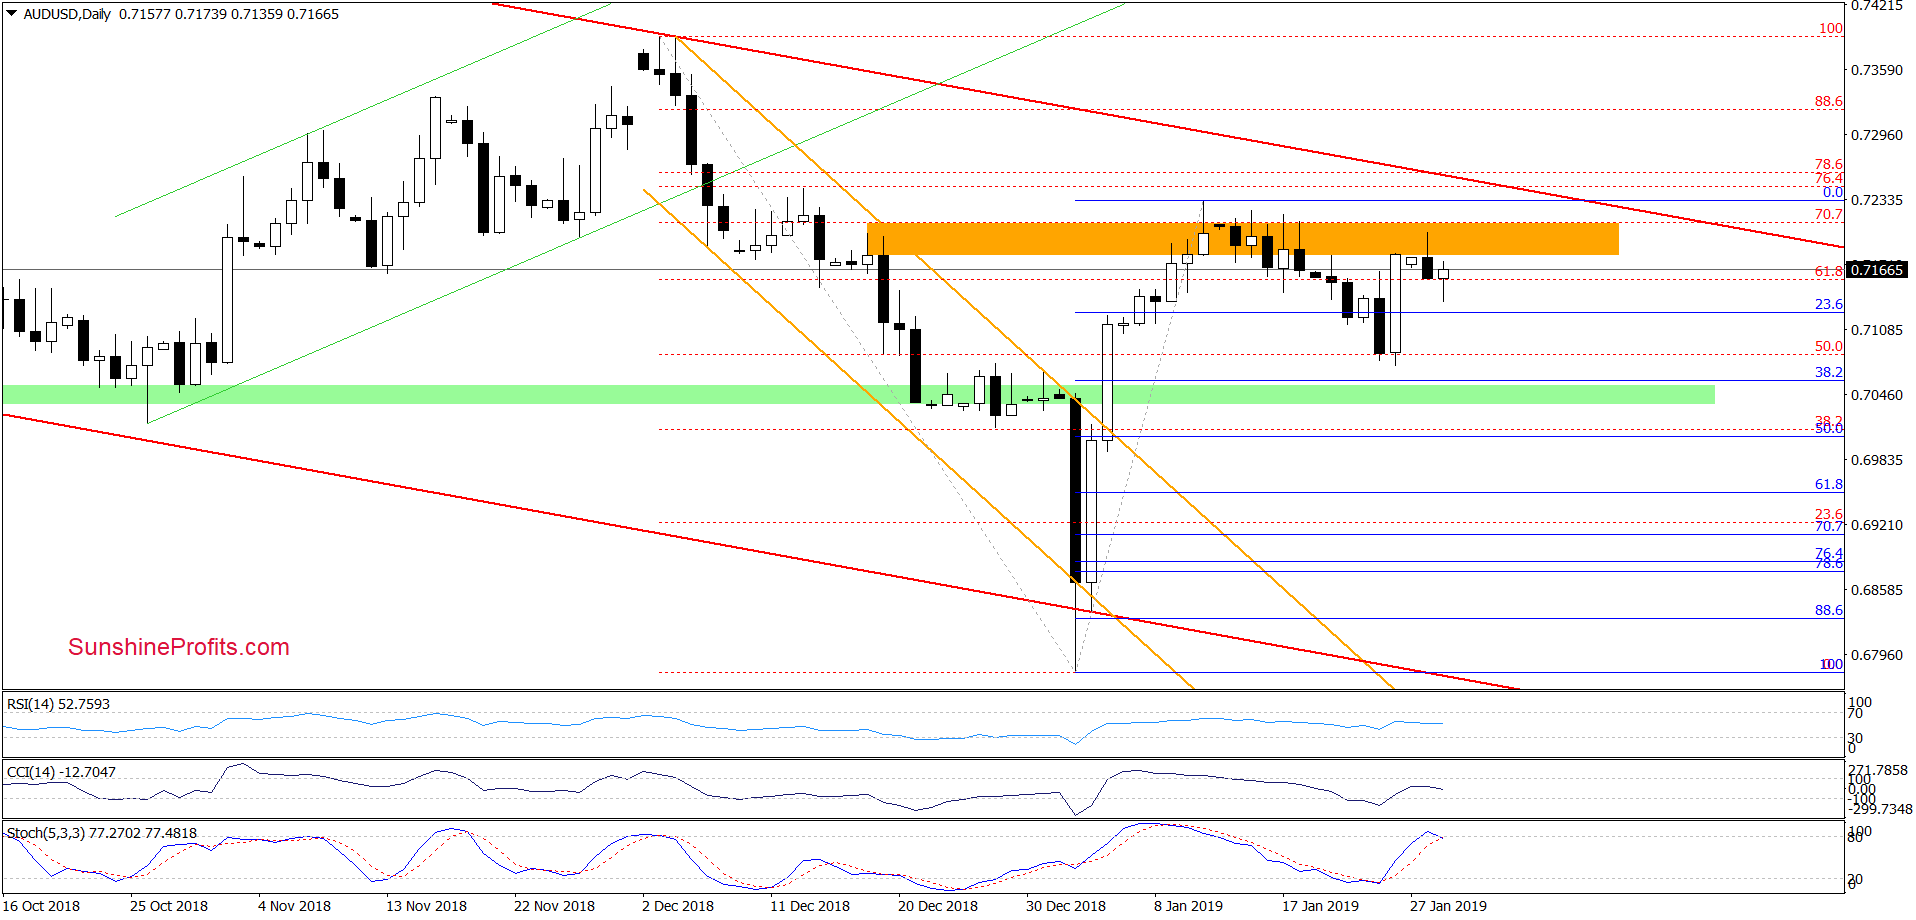
(…) Although the pair closed the day under the retracement, the proximity to the 38.2% Fibonacci retracement encouraged the bulls to act. As a result, they triggered a rebound and the pair headed north (similarly to wat we saw in the case of EUR/USD). Taking this fact into account and combining it with the current position of the indicators, it seems that further improvement is just around the corner.
This has indeed happened as Friday’s session ended in a sharp upswing. Monday's determination of the bulls fizzled out and AUD/USD reversed to end the day at its lows after being rejected at the orange resistance zone. It looks like the bulls currently have a problem overcoming this area. Today's price action gives an impression of a weak upside momentum and a short-term indecision in the market. The bearish scenario is further supported by the current position of the Stochastic Oscillator – it is about to flash a sell signal though another retest of the orange resistance zone before that would not surprise us.
Nevertheless, even if the bulls manage to take AUD/USD higher, the next important resistance levels (the upper border of the red declining trend channel, the 76.4% and the 78.6% Fibonacci retracements) are quite close and can stop a bigger move to the upside. That could provide an opportune short entry point.
Should we see signs of the buyers’ weakness, we’ll consider opening short positions. We will keep you informed should anything change, or should we see a confirmation/invalidation of the above.
Trading position (short-term; our opinion): No positions are justified from the risk/reward perspective.
Thank you.
Nadia Simmons
Forex & Oil Trading Strategist
Przemyslaw Radomski, CFA
Editor-in-chief, Gold & Silver Fund Manager

