

The highlight of Friday’s session was successful breakdown not only below the consolidation, but also under the lower border of the triangle. On top of that, the exchange rate closed the day under these supports, suggesting further declines. How did currency bulls react to these events and what are the implications?
- EUR/USD: none
- GBP/USD: none
- USD/JPY: short (a stop-loss order at 114.68; the exit target at 112.34)
- USD/CAD:none
- USD/CHF: short (a stop loss order at 1.0192; the exit target at 0.9850)
- AUD/USD:none
EUR/USD
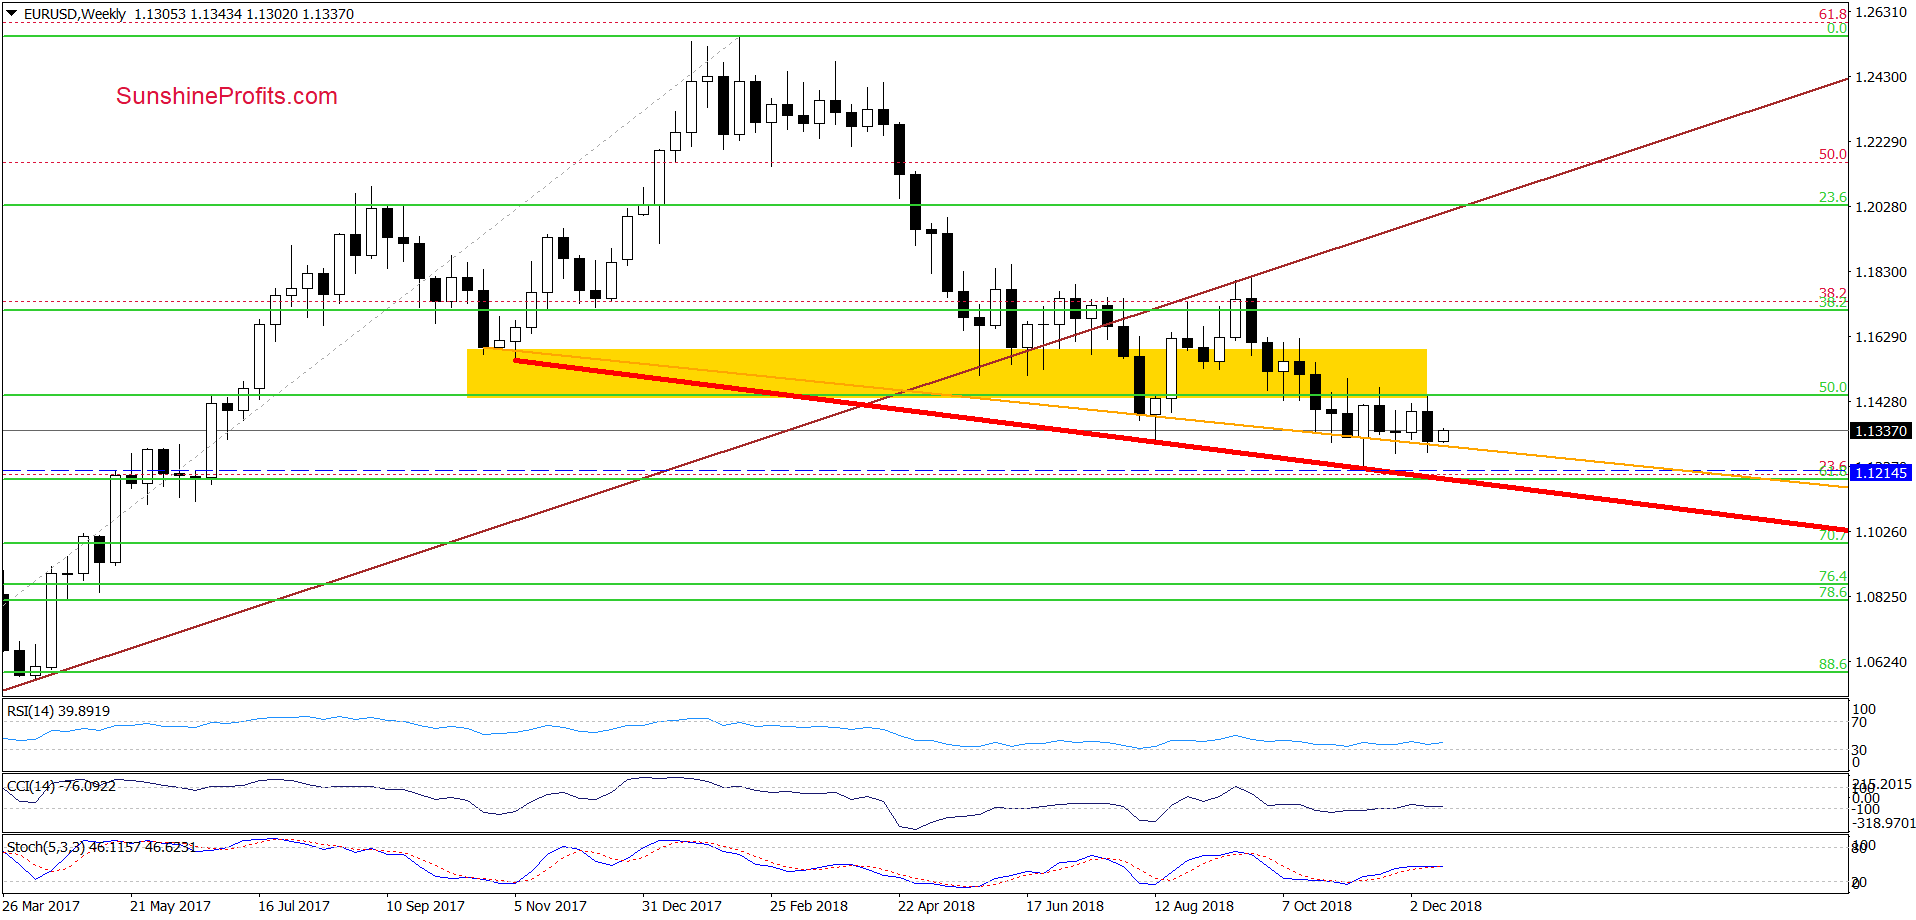
Looking at the weekly chart, we see that although EUR/USD declined in the previous week, the long-term orange support line (based on the October 2017 and August 2018 lows (in terms of weekly closures) stopped the sellers once again.
As you see on the chart, similar price action, we could observe several times in the previous months, which suggests that as long as there is no weekly closure under this support another rebound from this area is very likely.
How did this price action affect the daily chart? Let’s take a look at the chart below.
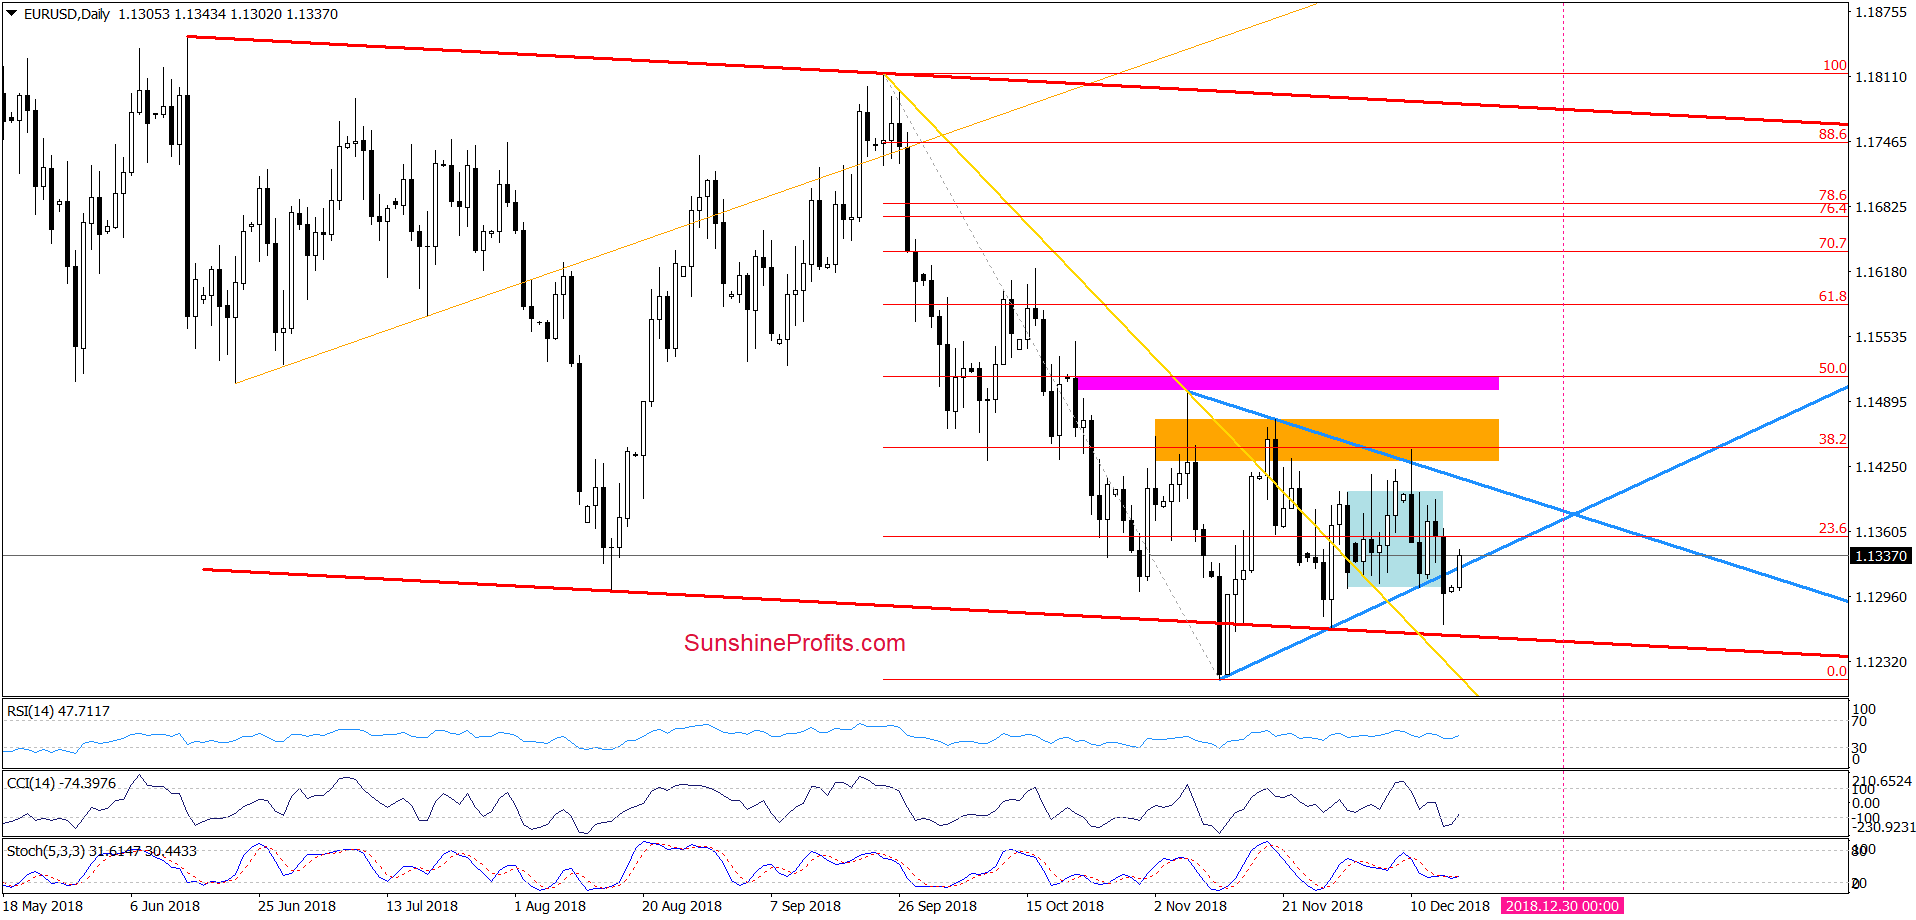
From this perspective, we see that although EUR/USD broke below the lower border of the blue consolidation and the lower line of the blue triangle, currency bulls managed to trigger a rebound earlier today.
Thanks to their determination, the exchange rate came back above both previously-broken supports, invalidating Friday’s breakdowns. This is a bullish development, which in combination with the current position of the daily indicators (the CCI and the Stochastic Oscillator generated buy signals) suggests further improvement in the following days – especially if currency bulls close today’s session above both blue lines.
How high can the pair go?
In our opinion, if we see a daily closure inside the triangle and the consolidation, the buyers will likely extend gains and test the upper borders of both formation in the very near future (currently at around 1.4002-1.1412).
Nevertheless, we continue to think that a long as there is no successful breakout above the triangle a sizable move to the upside is questionable. We will keep you informed should anything change, or should we see a confirmation/invalidation of the above.
Trading position (short-term; our opinion): No positions are justified from the risk/reward perspective.
GBP/USD
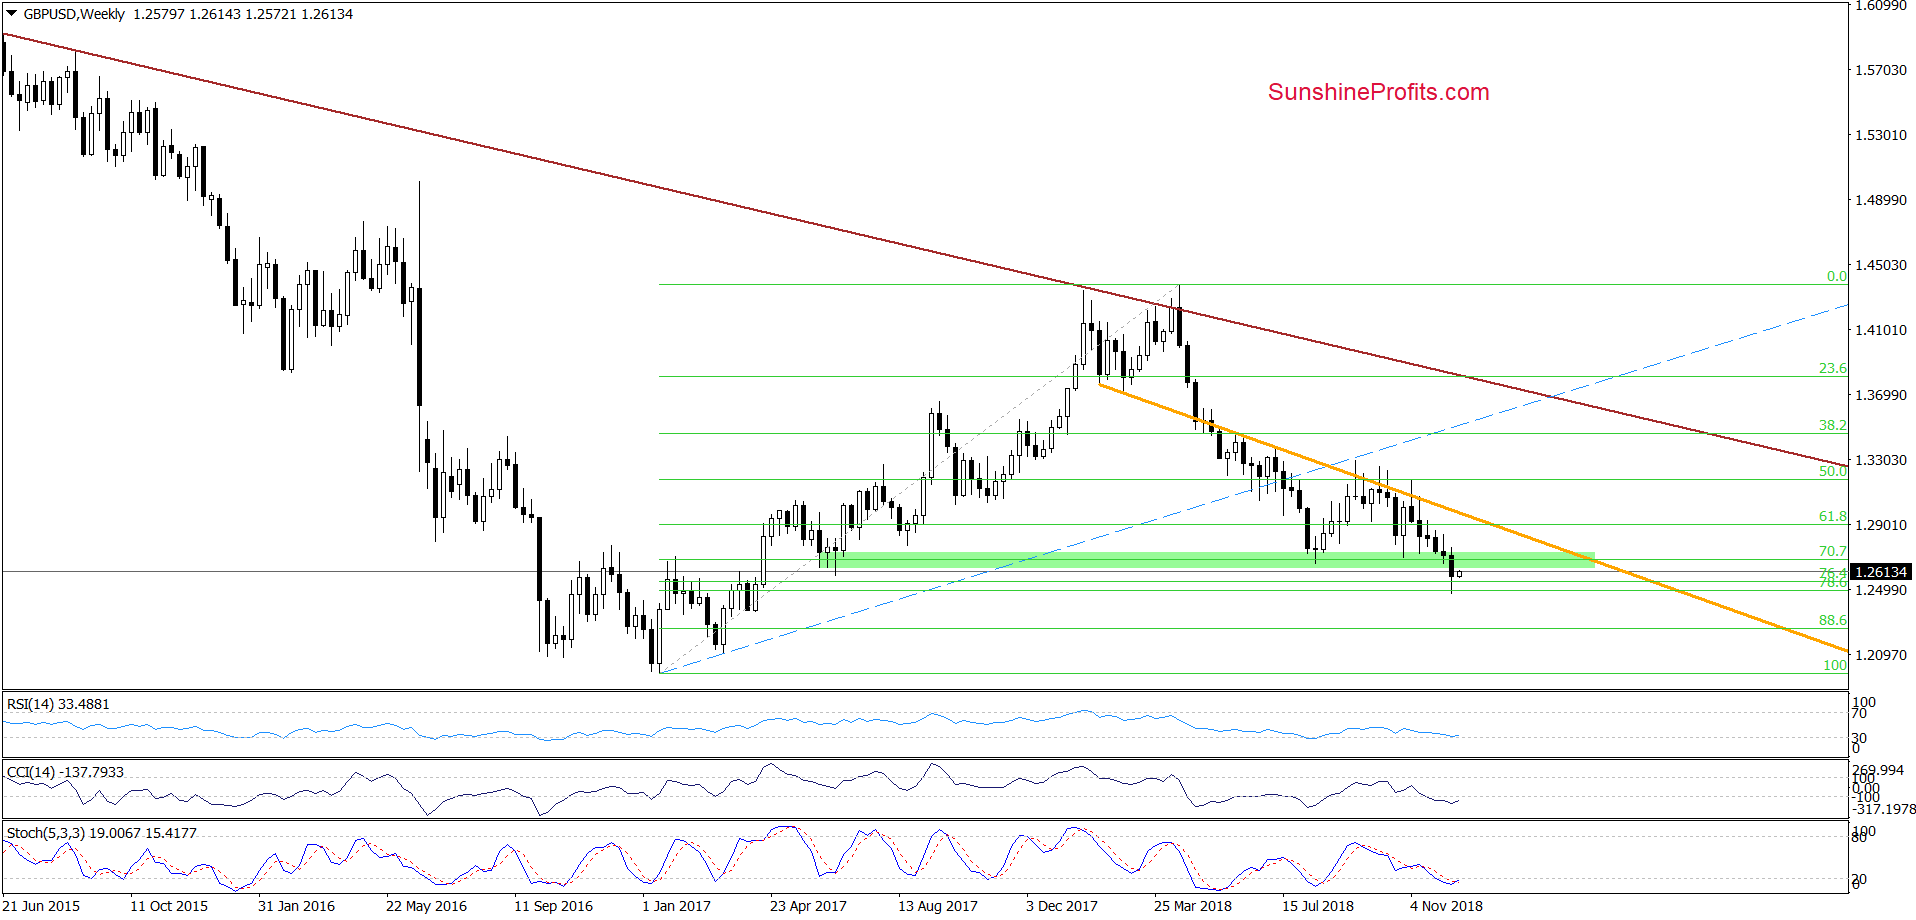
In the previous week, currency bears showed their claws and pushed GBP/USD below the green support zone. Despite this deterioration, the combination of the 76.4% and 78.6% Fibonacci retracements encouraged the buyers to fight for higher values of the exchange rate. As a result, the pair rebounded, but there was no invalidation of the earlier breakdown, which suggests that the recent move to the upside could be nothing more than a verification of the earlier breakdown.
Nevertheless, taking into account today’s another attempt to move higher and the current position of the indicators (they are very close to generating buy signals), it seems that the buyers have not lost their desire to fight for higher levels yet.
If this is the case and they manage to climb above the green zone, we’ll likely see further improvement and a test of the major resistance line (marked with orange) in the following week(s).
Are there any other technical factors that can support currency bulls in the coming days?
Let’s examine the daily chart to find out.
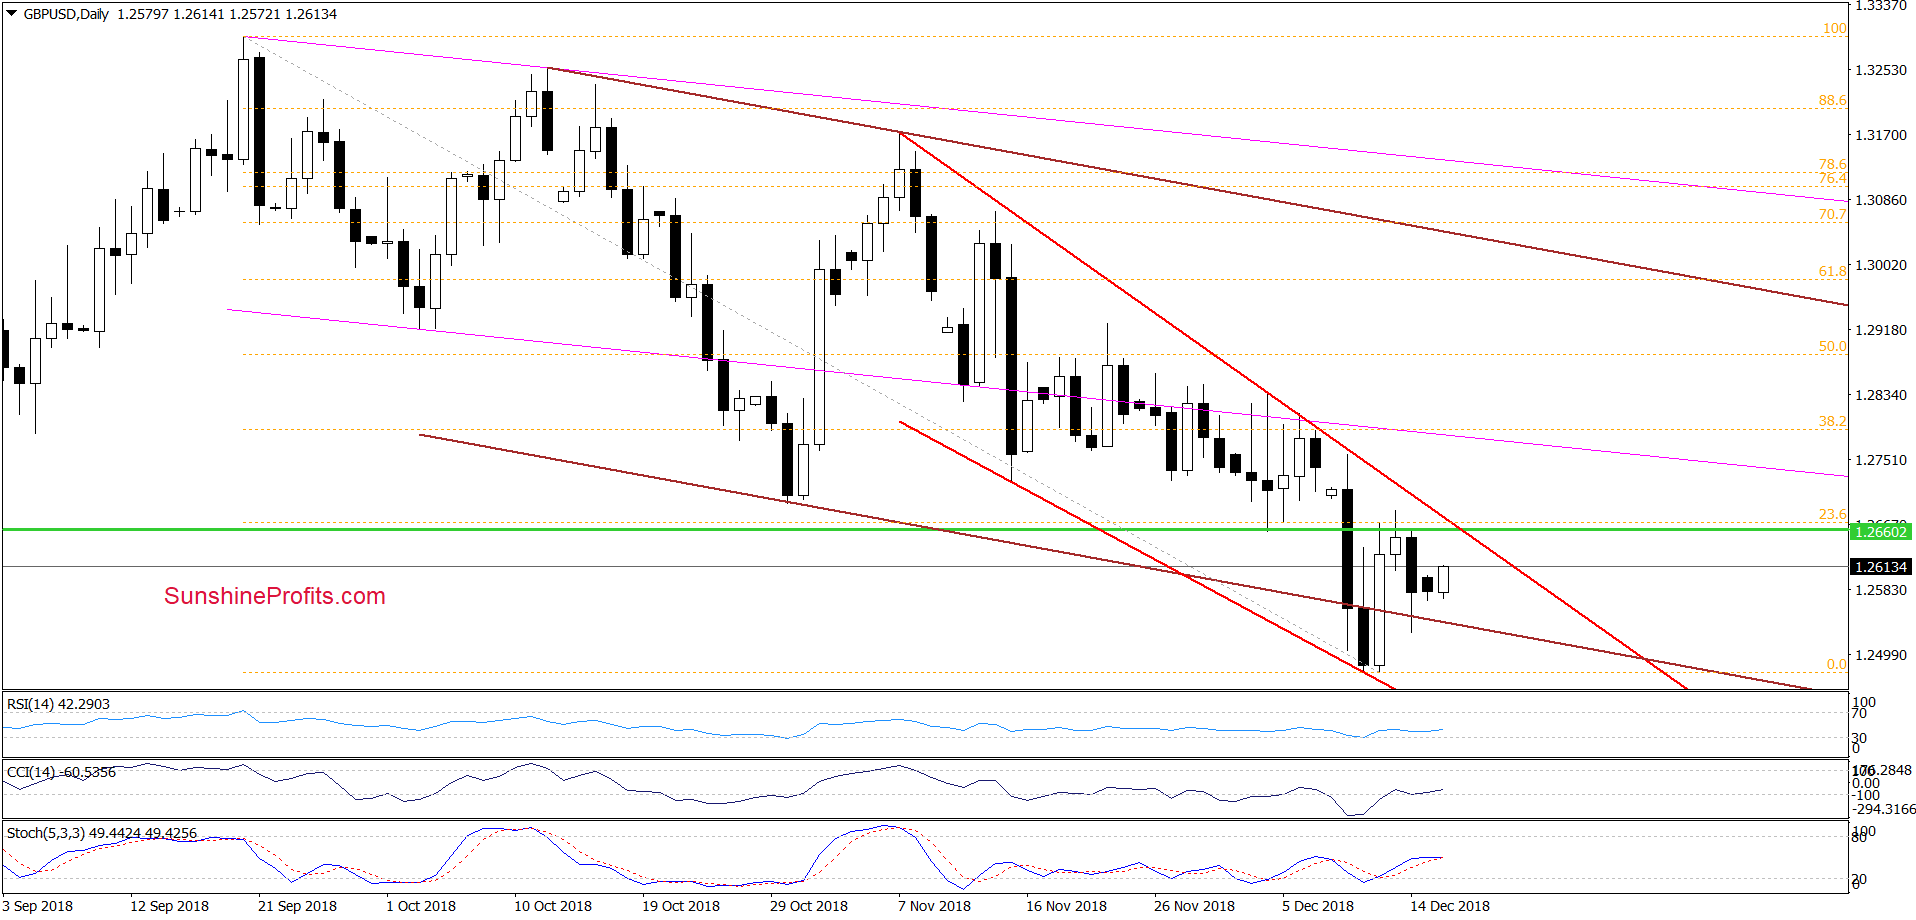
From this perspective, we see that currency bulls pushed GBP/USD above the lower border of the brown declining trend channel, invalidating the earlier breakdown at the beginning of the previous week.
Despite this improvement, they weren’t strong enough to close any of the next sessions above the green horizontal line (based on the above-mentioned mid-August low). Although such price action doesn’t confirm their strength, the buyers have defended the lower border of the brown declining trend channel, which together with the buy signals generated by all daily indicators suggests that another attempt to move higher might be just around the corner.
How high can GBP/USD go in the coming week?
In our opinion, if the buyers manage to break above the green horizontal line (based on the above-mentioned mid-August low) and close the day above it and the red resistance line, we’ll likely see a test of the early-December highs.
Nevertheless, if currency bulls fail and show weakness in this area, the way to the lower border of the brown declining trend channel (or even this week’s lows) will be open.
Trading position (short-term; our opinion): No positions are justified from the risk/reward perspective. We will keep you informed should anything change, or should we see a confirmation/invalidation of the above.
USD/CAD
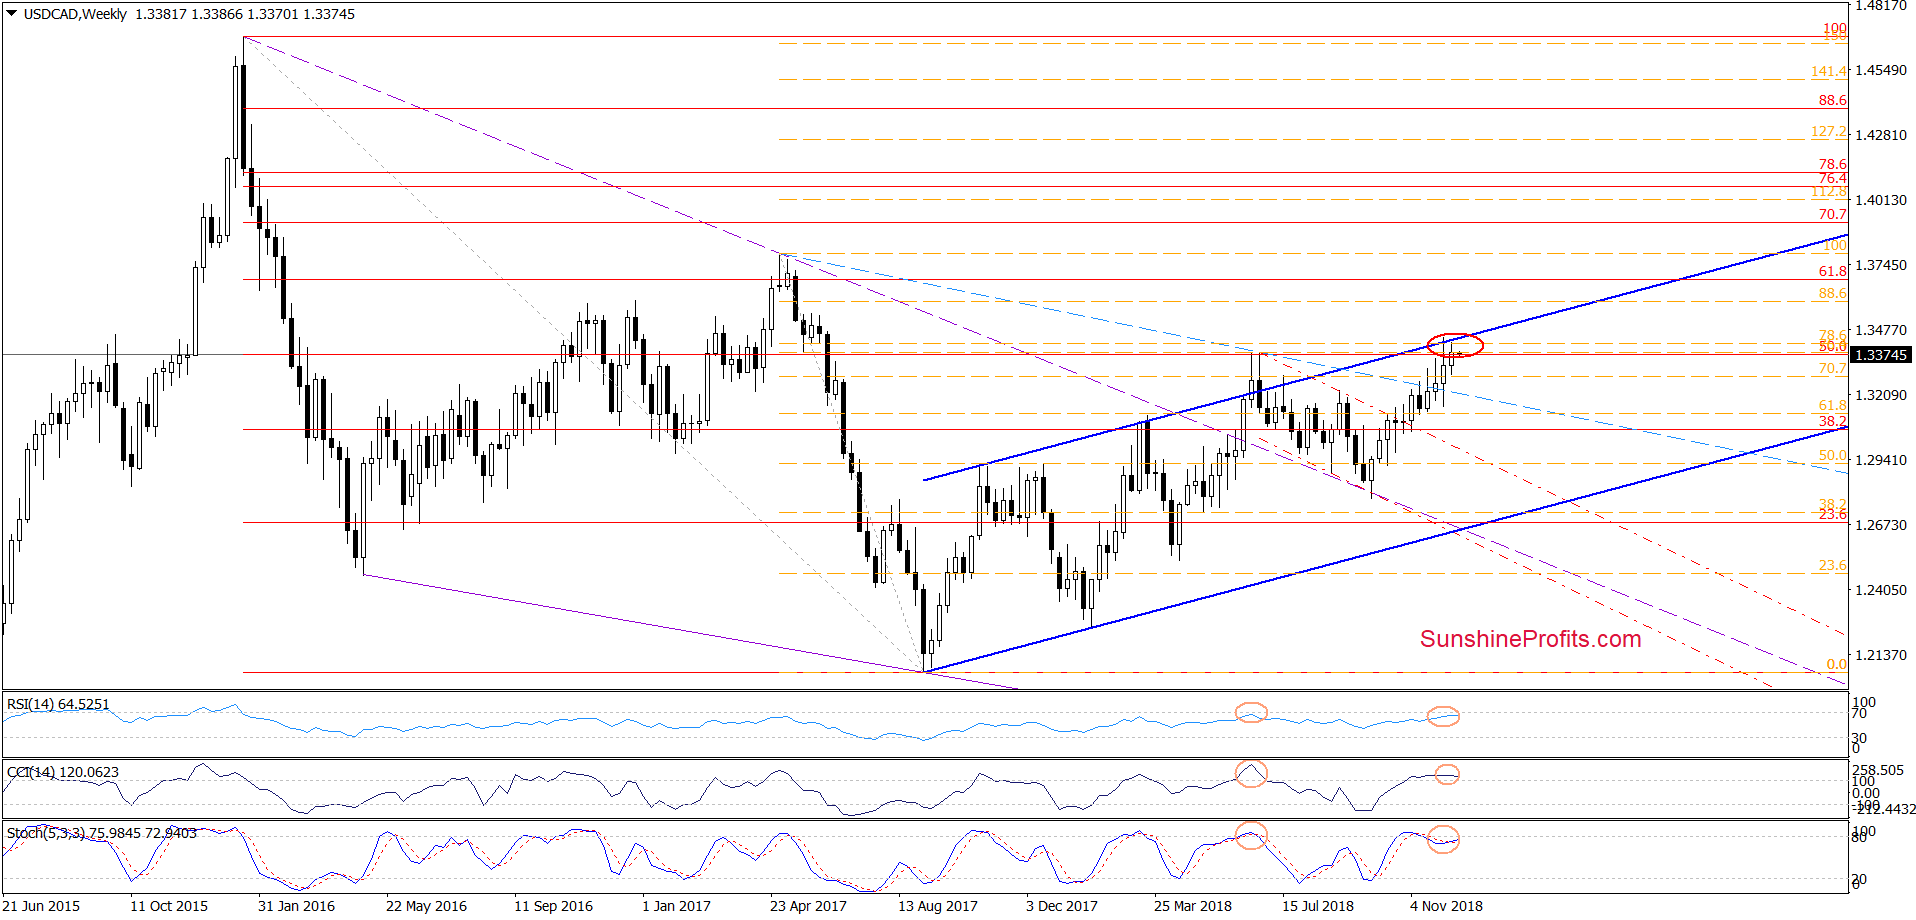
Looking at the medium-term chart, we see that the overall situation remains almost unchanged as USD/CAD is still trading slightly below a very important resistance area created by the 50% Fibonacci retracement based on the entire 2016-2017 downward move, the 76.4% and 78.6% Fibonacci retracements based on the late-April 2017- early-September 2017 declines and the upper border of the long-term blue rising trend channel (marked with the red ellipse).
Additionally, this area is reinforced by the short-term resistances marked on the daily chart below.
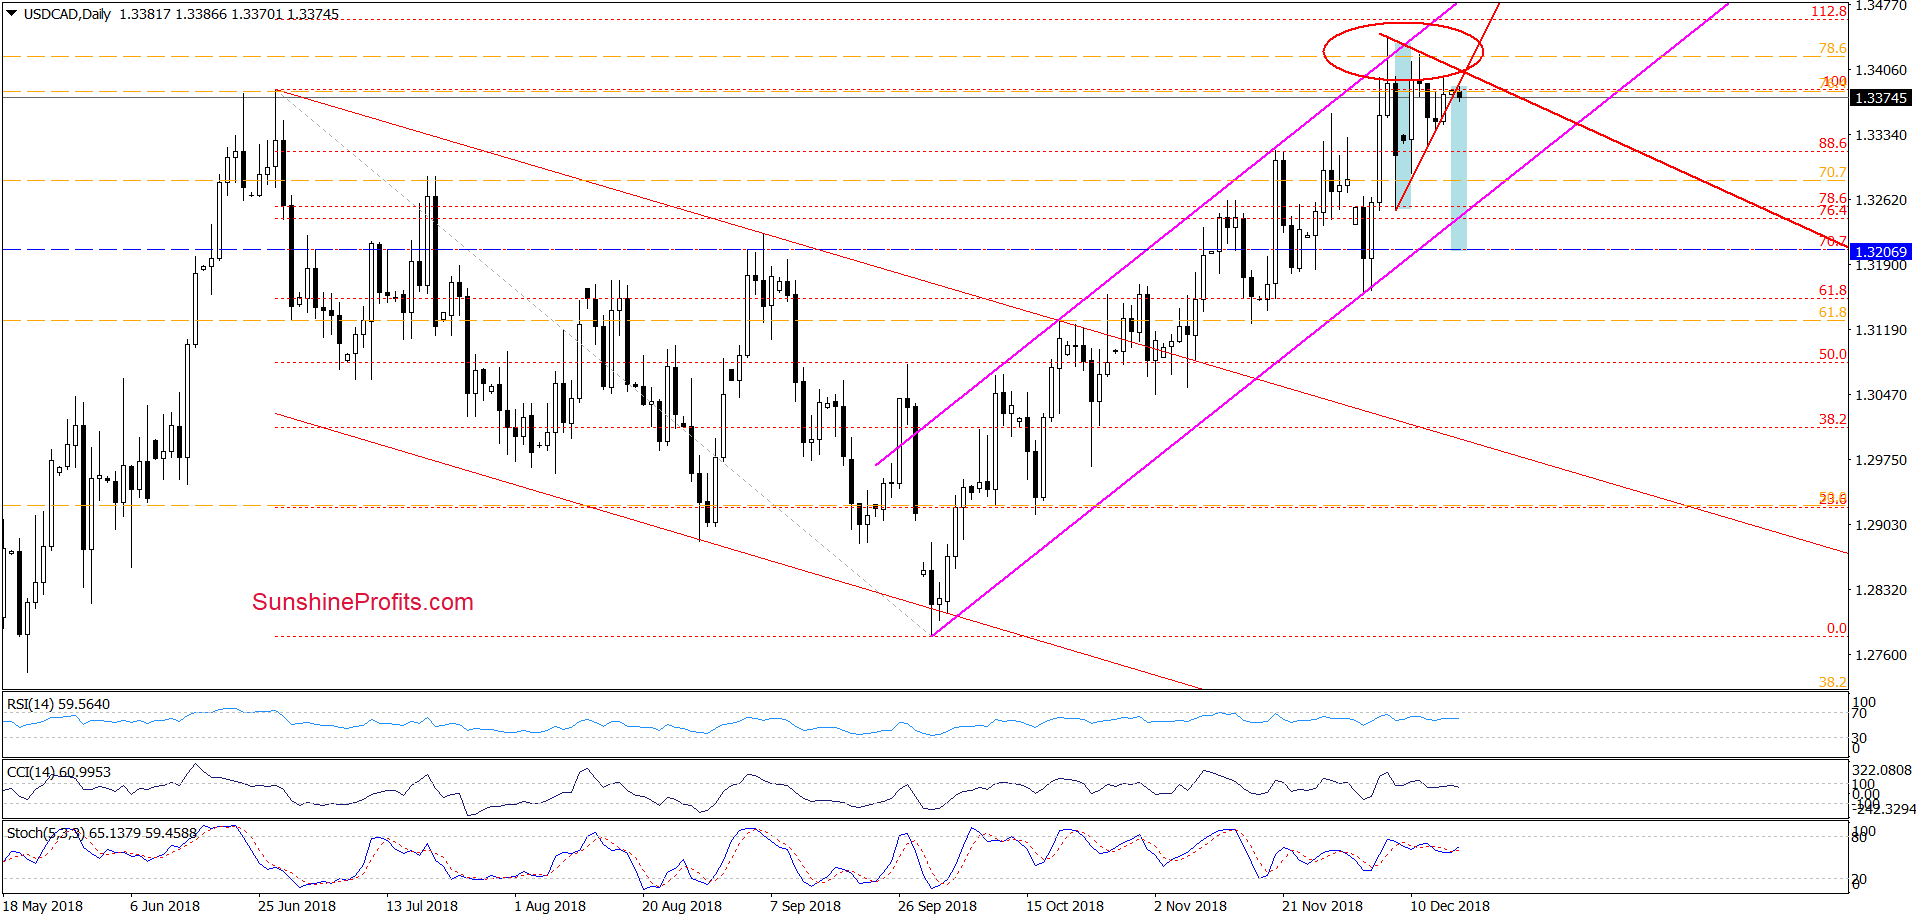
On the daily chart, we see that the proximity to the upper border of the short-term pink rising trend channel, the above-mentioned medium-term resistances and the 112.8% Fibonacci extension encouraged currency bears to act.
Thanks to the last week’s price action USD/CAD created a red triangle, which suggests that a successful breakout above the upper line of the formation (or a breakdown under the lower line) will indicate the direction of the next (at least) a very short-term move.
Earlier today, currency bears pushed the exchange rate lower, but we think that this event will be more reliable if we see a daily closure under the lower red line. If the situation develops in tune with the pro-declining scenario, we’ll see a decline to around 1.3207, where the size of the downward move will correspond to the height of the triangle.
Trading position (short-term; our opinion): No positions are justified from the risk/reward perspective. We will keep you informed should anything change, or should we see a confirmation/invalidation of the above.
Thank you.
Nadia Simmons
Forex & Oil Trading Strategist
Przemyslaw Radomski, CFA
Founder, Editor-in-chief, Gold & Silver Fund Manager
Gold & Silver Trading Alerts
Forex Trading Alerts
Oil Investment Updates
Oil Trading Alerts

