

Although the beginning of the new year brought a fresh almost two-month peak in EUR/USD, the happiness of the buyers lasted very shortly. An unsuccessful attempt to break above the resistance line ended with a reversal and a sharp decline in the last hours. What can we expect in upcoming days?
- EUR/USD: short (a stop-loss order at 1.1525; the initial downside target at 1.1250)
- GBP/USD: short (a stop-loss order at 1.2844; the initial downside target at 1.2490)
- USD/JPY: none
- USD/CAD:none
- USD/CHF:none
- AUD/USD:none
EUR/USD
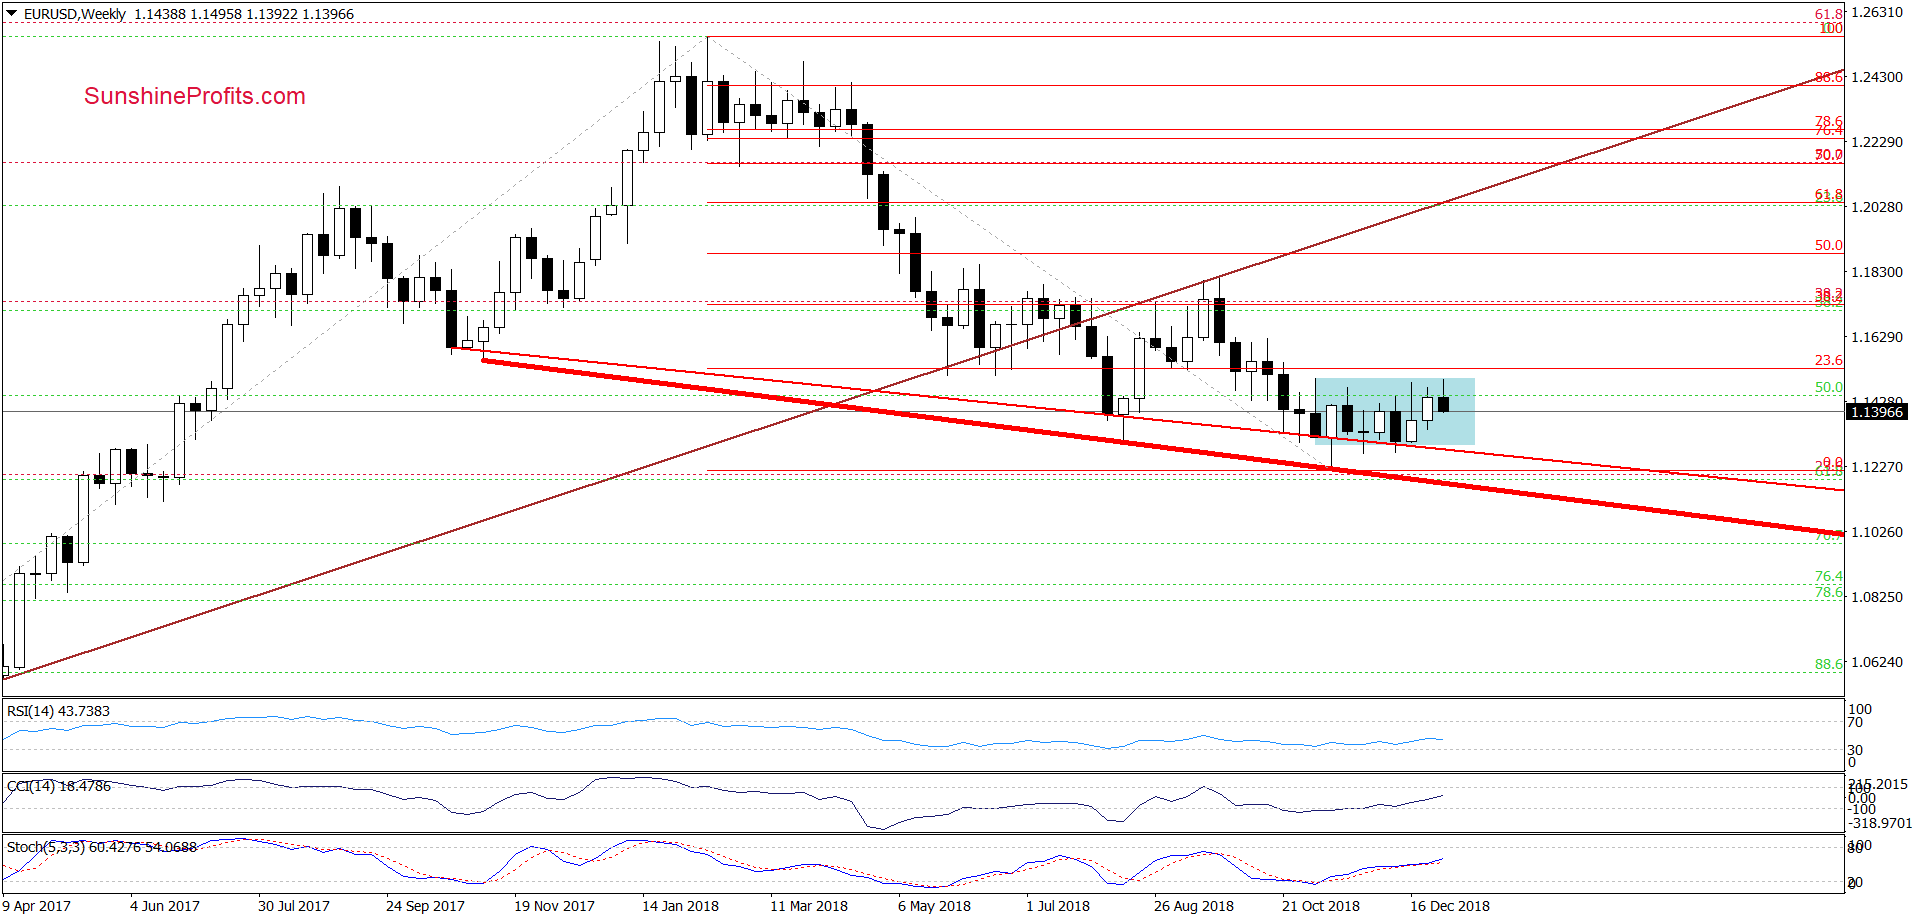
On the weekly chart, we see that the proximity to the upper border of the blue consolidation encouraged currency bears to act. How did this drop affect the daily chart?
Before we answer this question, let’s recall the quotes from our last alert:
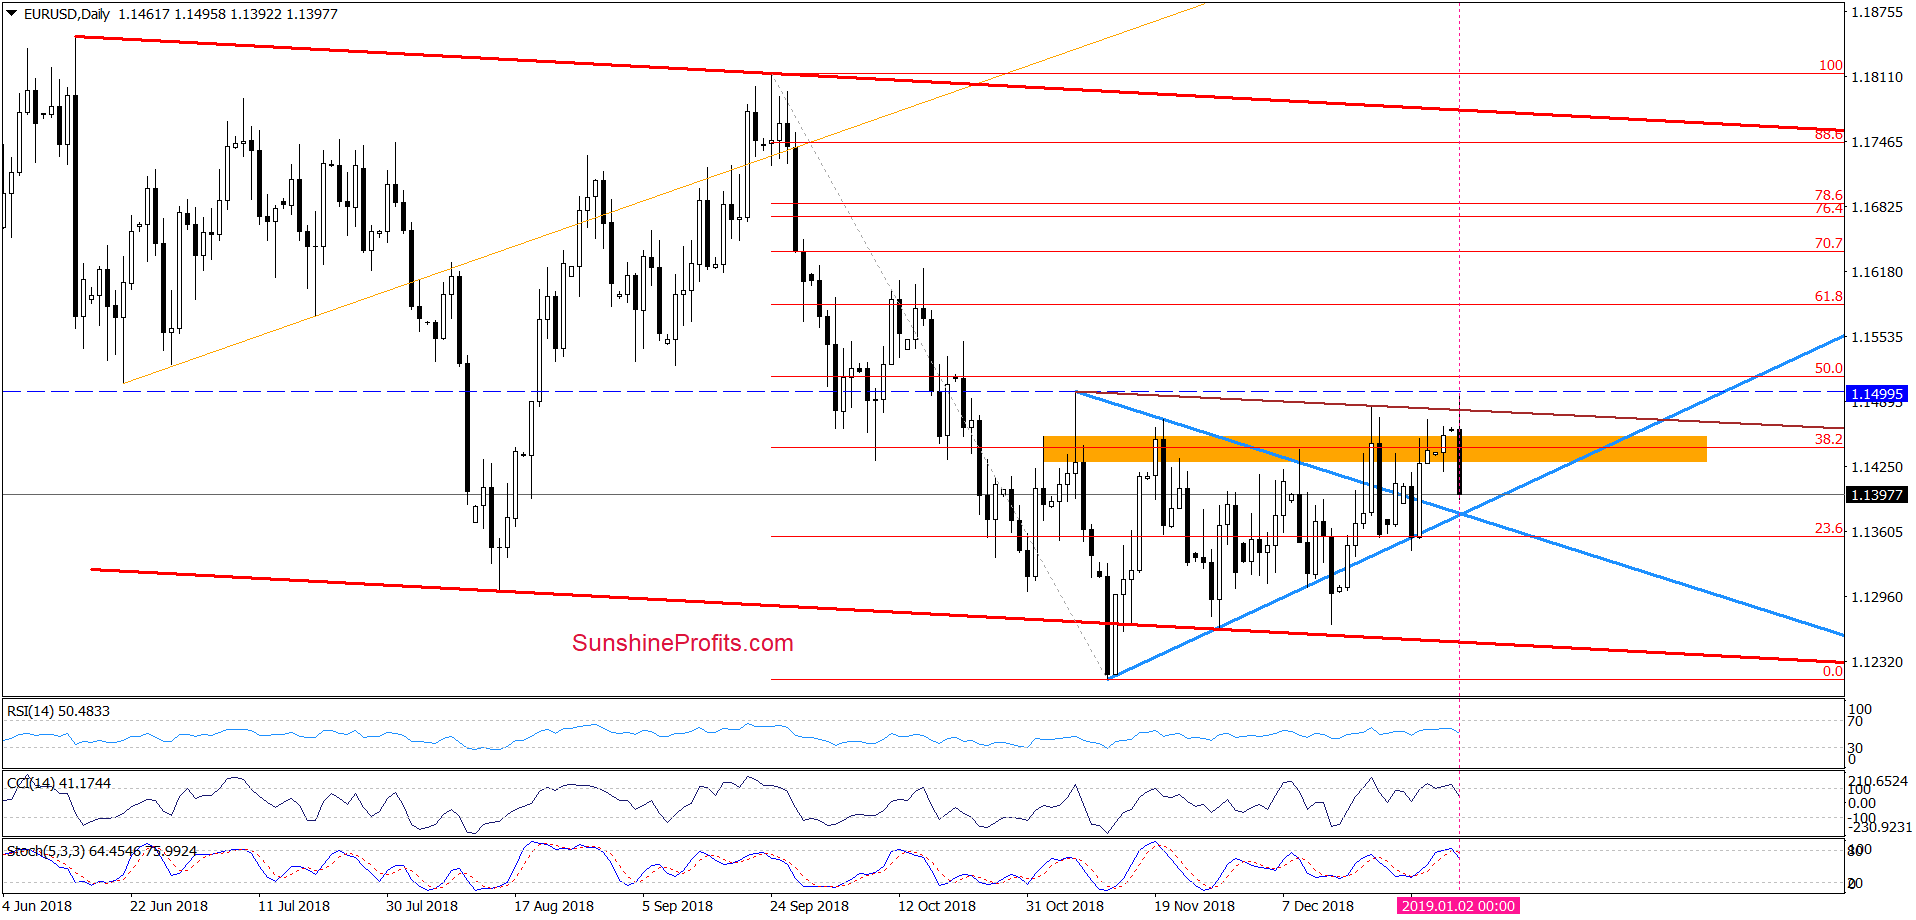
(…) although currency bulls took EUR/USD above the upper border of the blue triangle and tested the orange zone, there was no daily closure above this resistance area, which raises some doubts about the buyers’ strength.
Nevertheless, as long as the exchange rate remains above the triangle one more upswing is likely. How high can the pair go if currency bulls do not fail later in the day?
(…) we’ll likely see a test of the December high or even the early-November peak and the 50% Fibonacci retracement in the coming days.
Nevertheless, we think that this pro-growth scenario will be more likely and reliable if the exchange rate closes today’s session above the orange resistance area.
Finishing today’s commentary on this currency pair, please keep in mind what we wrote yesterday about potential reversal:
(…) The intersection of the arms of the triangle will take place at the beginning of the next year, which means that both Monday and Wednesday sessions may indicate the place where the reversal will take place - according to the Triangle Apex Reversal technique.
Depending on where this happens, we will take further investment decisions. In other words, if the bulls push the currency pair above the orange resistance zone and fail to keep the EUR/USD above this resistance once again, we will consider the opening short positions. (…)
From today’s point of view, we see that the situation developed in line with the above scenario and EUR/USD moved sharply lower earlier today. Thanks to this decline the exchange rate invalidated not only the earlier breakout above the previous peak and the orange zone, but also the brown declining resistance line based on the previous highs.
Additionally, the CCI and the Stochastic Oscillator generated sell signals, suggesting further deterioration in the following days. This scenario will be even more likely and reliable if EUR/USD drops under both arms of the blue triangle.
If we see such price action, the way to the lower border of the red declining trend channel will be open (around 1.1250 at the moment of writing this alert). Taking all the above into account, we believe that opening short positions is justified from the risk/reward perspective.
Trading position (short-term; our opinion): Short positions with a stop-loss order at 1.1525 and the initial downside target at 1.1250 are justified from the risk/reward perspective. We will keep you informed should anything change, or should we see a confirmation/invalidation of the above.
GBP/USD
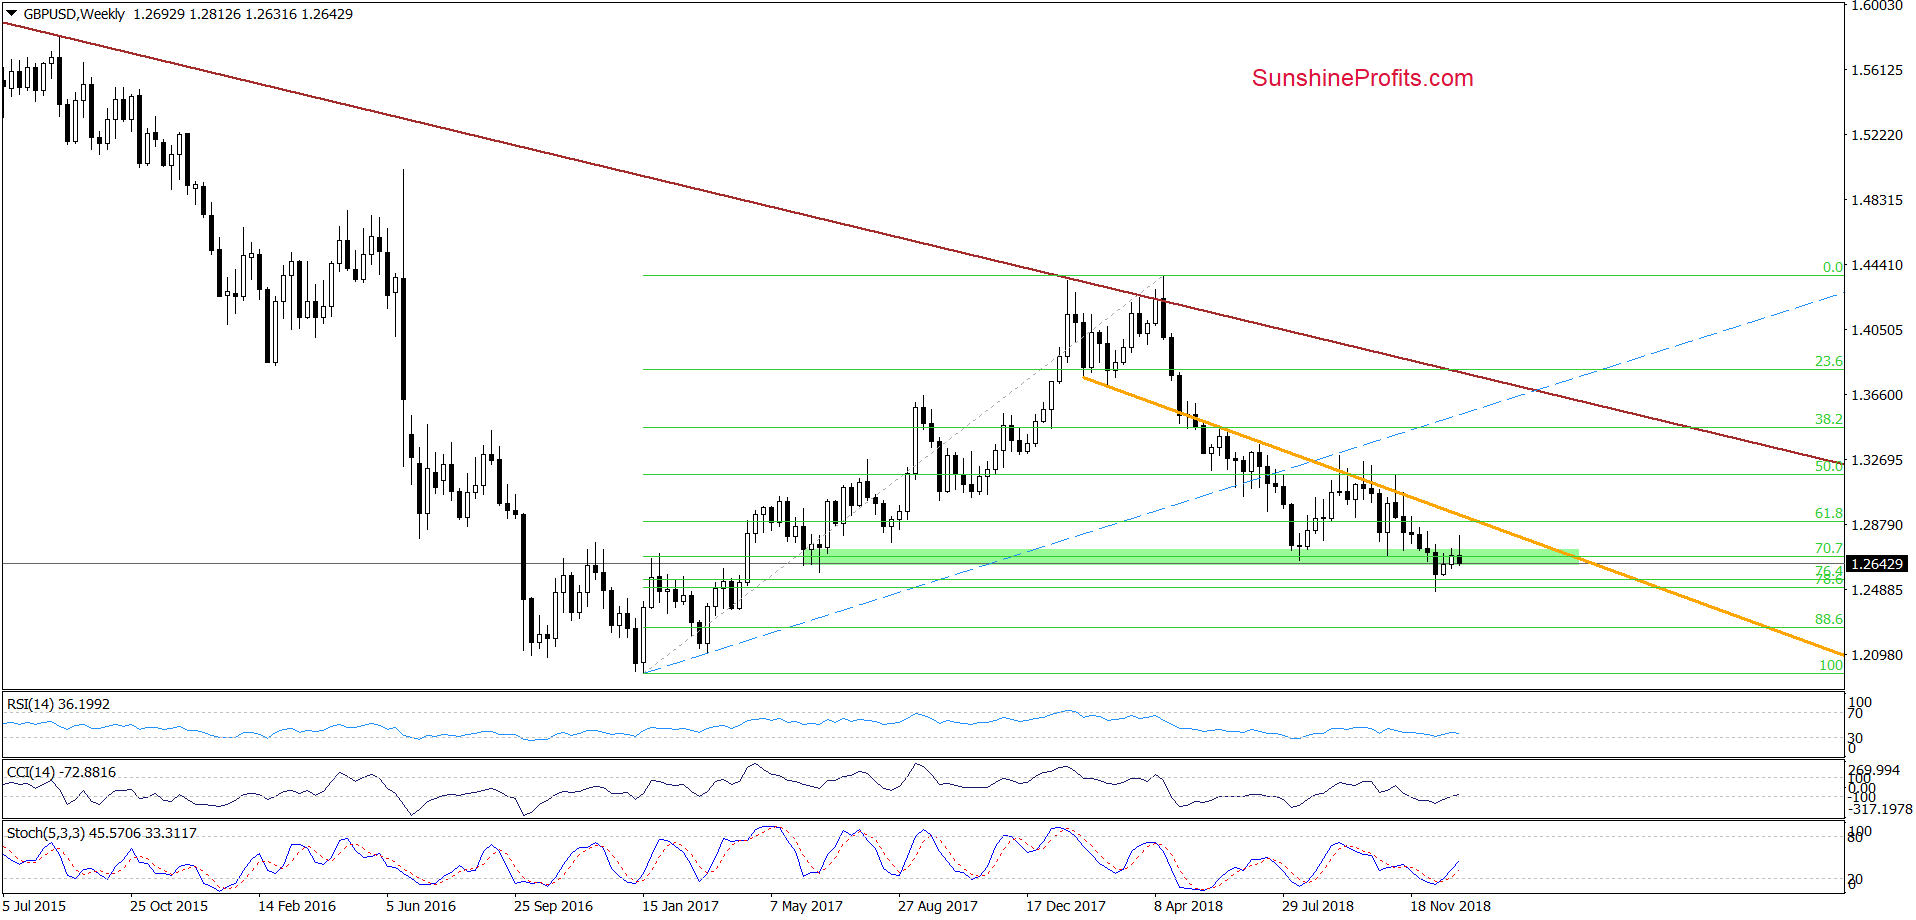
From the weekly perspective, we see that GBP/USD pulled back quite sharply (just like EUR/USD), which increases the likelihood of an invalidation of the earlier breakout above the green zone.
What impact did this drop have on the short-term chart? Let’s check below.
In our last commentary on this currency pair, we wrote the following:
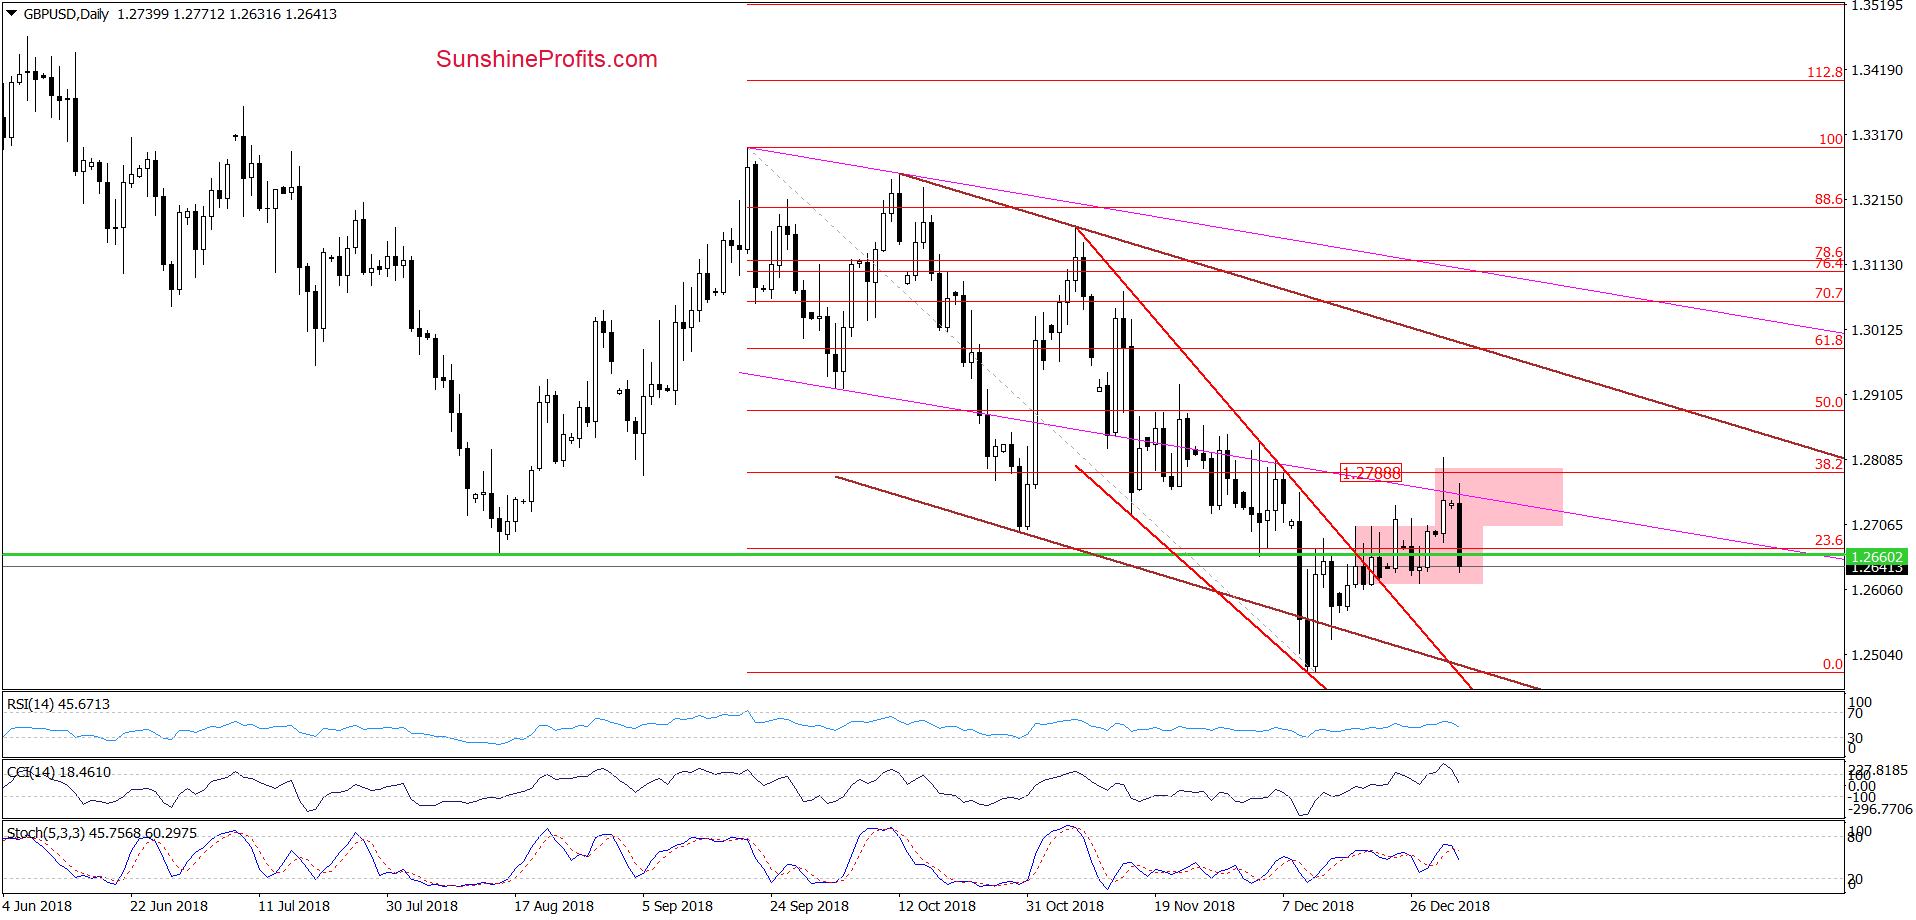
The first thing that caches the eye on the daily chart is today’s breakout above the upper border of the pink consolidation. Additionally, currency bulls managed to push GBP/USD above the last week’s peak, which suggests that we’ll likely see an increase to (at least) 1.2788, where the 38.2% Fibonacci retracement is.
Looking at the daily chart, we see that the situation developed in tune with our assumptions and GBP/USD reached our upside target during Monday’s session. Despite this improvement, currency bulls didn’t manage to hold gained levels, which resulted in a pullback and an invalidation of the earlier tiny breakout above the Fibonacci retracement.
This negative development triggered further deterioration earlier today, which caused a sharp downswing and a comeback under the green horizontal line (another bearish sign). On top of that, the CCI and the Stochastic Oscillator generated sell signals, giving the sellers one more reason to act.
Connecting the dots, we think that opening short positions is justified from the risk/reward perspective as GBP/USD can decline even to the lower border of the brown declining trend channel (at around 1.2490 at the moment of writing these words) in the following days.
Trading position (short-term; our opinion): Short positions with a stop-loss order at 1.2844 and the initial downside target at 1.2490 are justified from the risk/reward perspective. We will keep you informed should anything change, or should we see a confirmation/invalidation of the above.
USD/CAD
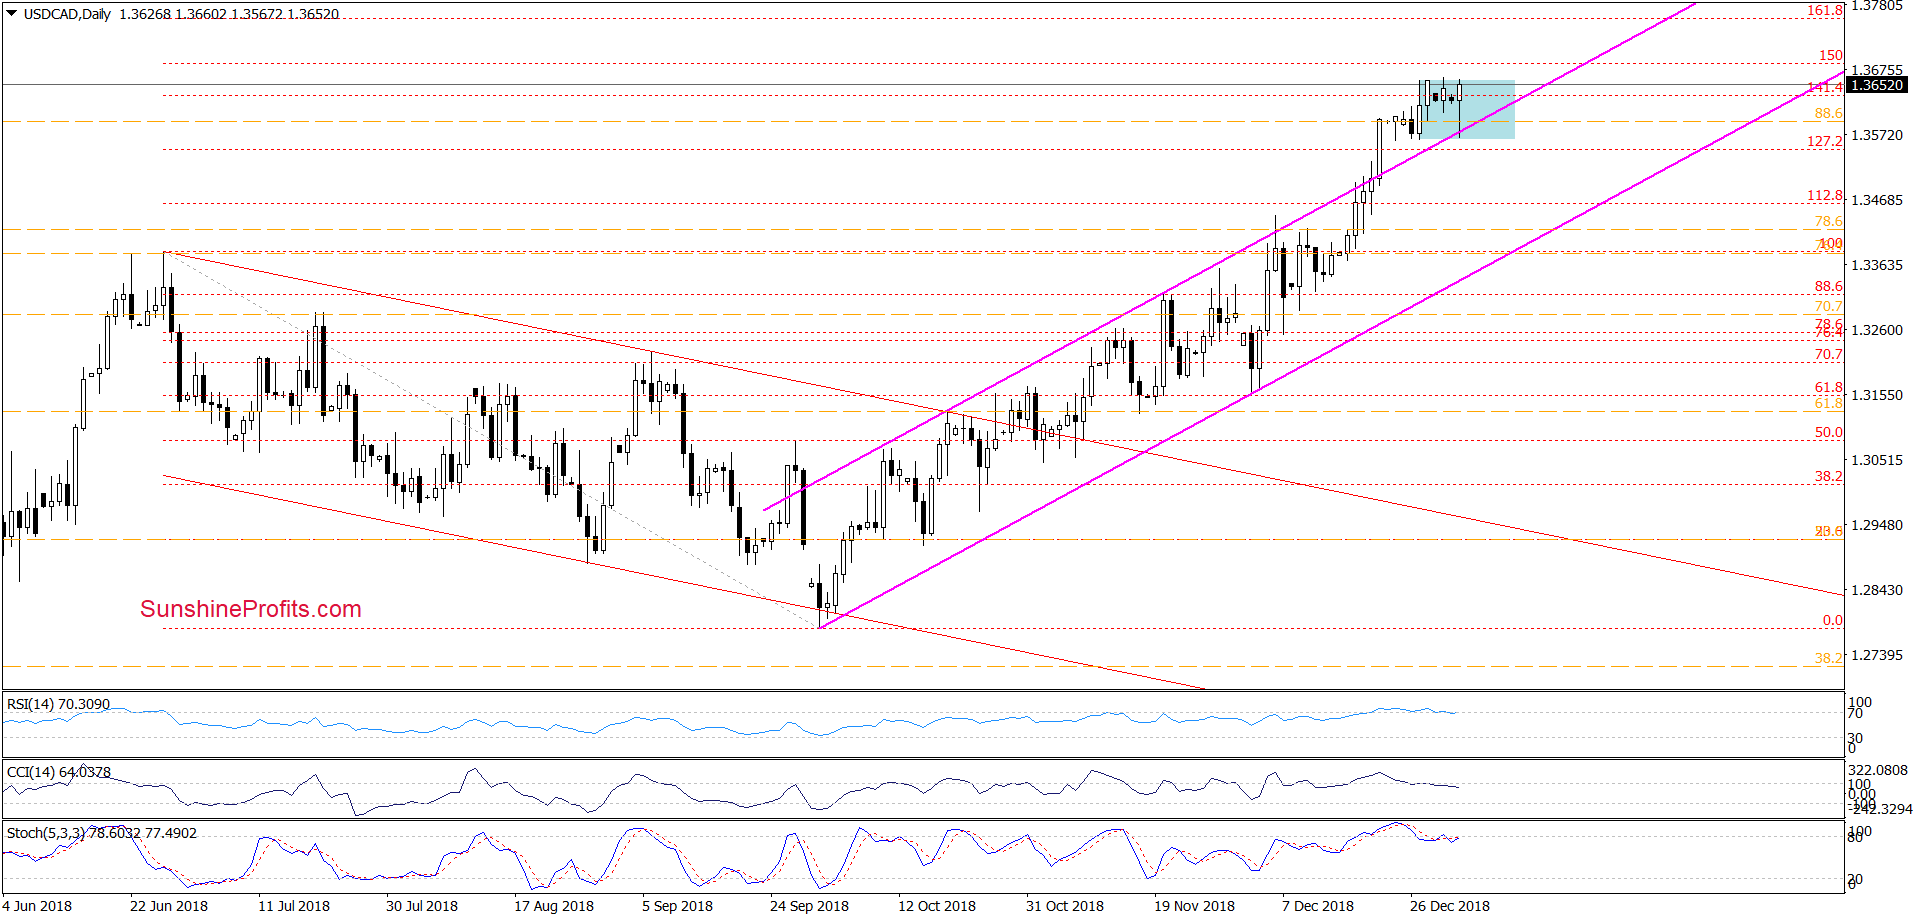
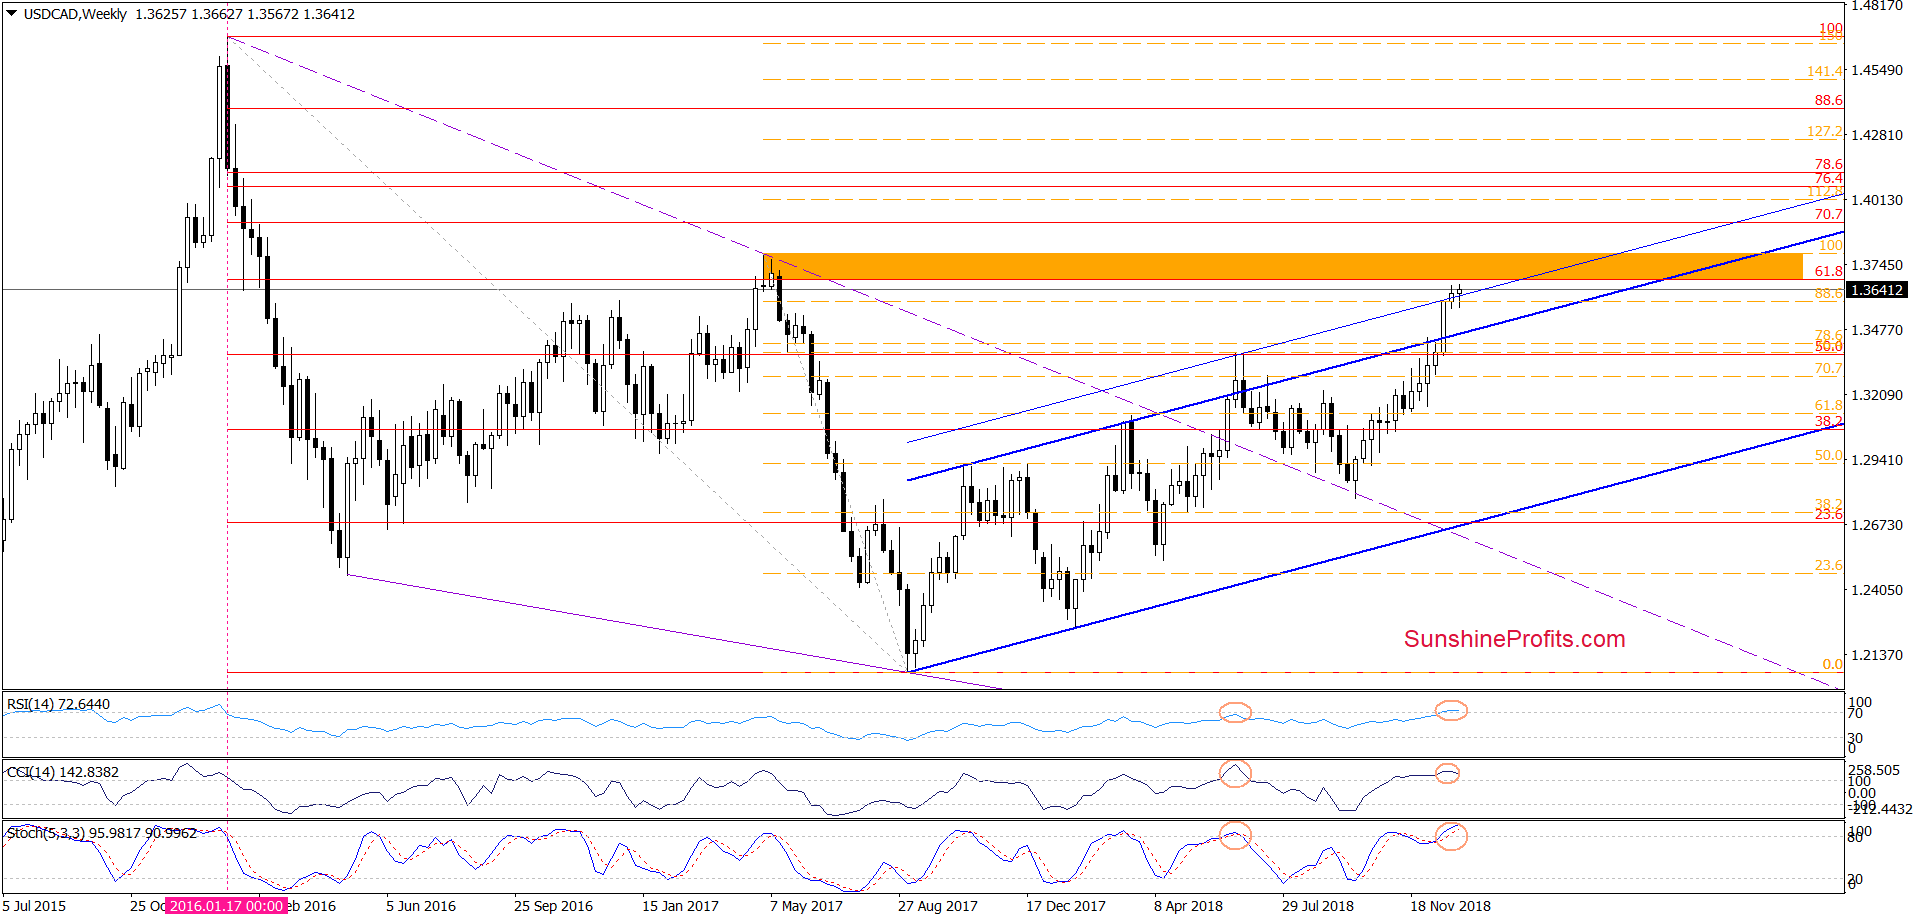
Looking at the above charts, we see that the overall situation hasn’t changed much as USD/CAD is still trading in a narrow range, which means that our last commentary on tis currency pair is up-to-date also today:
(…) a climb above the 88.6% Fibonacci retracement and the blue resistance line based on the mid-June peak, which is parallel to the upper border of the blue rising trend channel.
What does it mean for the exchange rate? In our opinion, a test of the next resistance area created by the late-April 2017 and May 2017 peaks and reinforced by the 61.8% Fibonacci retracement (based on the entire 2016-2017 downward move).
At this point, it is worth noting that the current position of the weekly indicators suggests that the space for increases may be limited. What do we mean by that? As you see on the chart, the RSI climbed above the level of 70 for the first time since the beginning of 2016. Back then such high reading of the indicator preceded a significant correction, which suggests that we may see a similar price action in the coming week. This scenario is also reinforced by the bearish divergence between the CCI and the exchange rate and an extremally high reading of the Stochastic Oscillator.
Therefore, if the situation develops in tune with our assumptions and USD/CAD fail to break above the orange resistance zone, we’ll consider opening short positions. We will keep you informed should anything change, or should we see a confirmation/invalidation of the above.
Trading position (short-term; our opinion): No positions are justified from the risk/reward perspective.
Thank you.
Nadia Simmons
Forex & Oil Trading Strategist
Przemyslaw Radomski, CFA
Founder, Editor-in-chief, Gold & Silver Fund Manager
Gold & Silver Trading Alerts
Forex Trading Alerts
Oil Investment Updates
Oil Trading Alerts

