

An invalidation of the breakdown under the triangle motivated currency bulls to fight in recent days. Their determination pushed EUR/USD back to the upper border of the above-mentioned formation. Will history repeat itself once again?
- EUR/USD: none
- GBP/USD: none
- USD/JPY: short (a stop-loss order at 114.68; the exit target at 112.04)
- USD/CAD:none
- USD/CHF: short (a stop loss order at 1.0192; the exit target at 0.9850)
- AUD/USD:none
EUR/USD
On Tuesday, we wrote the following:
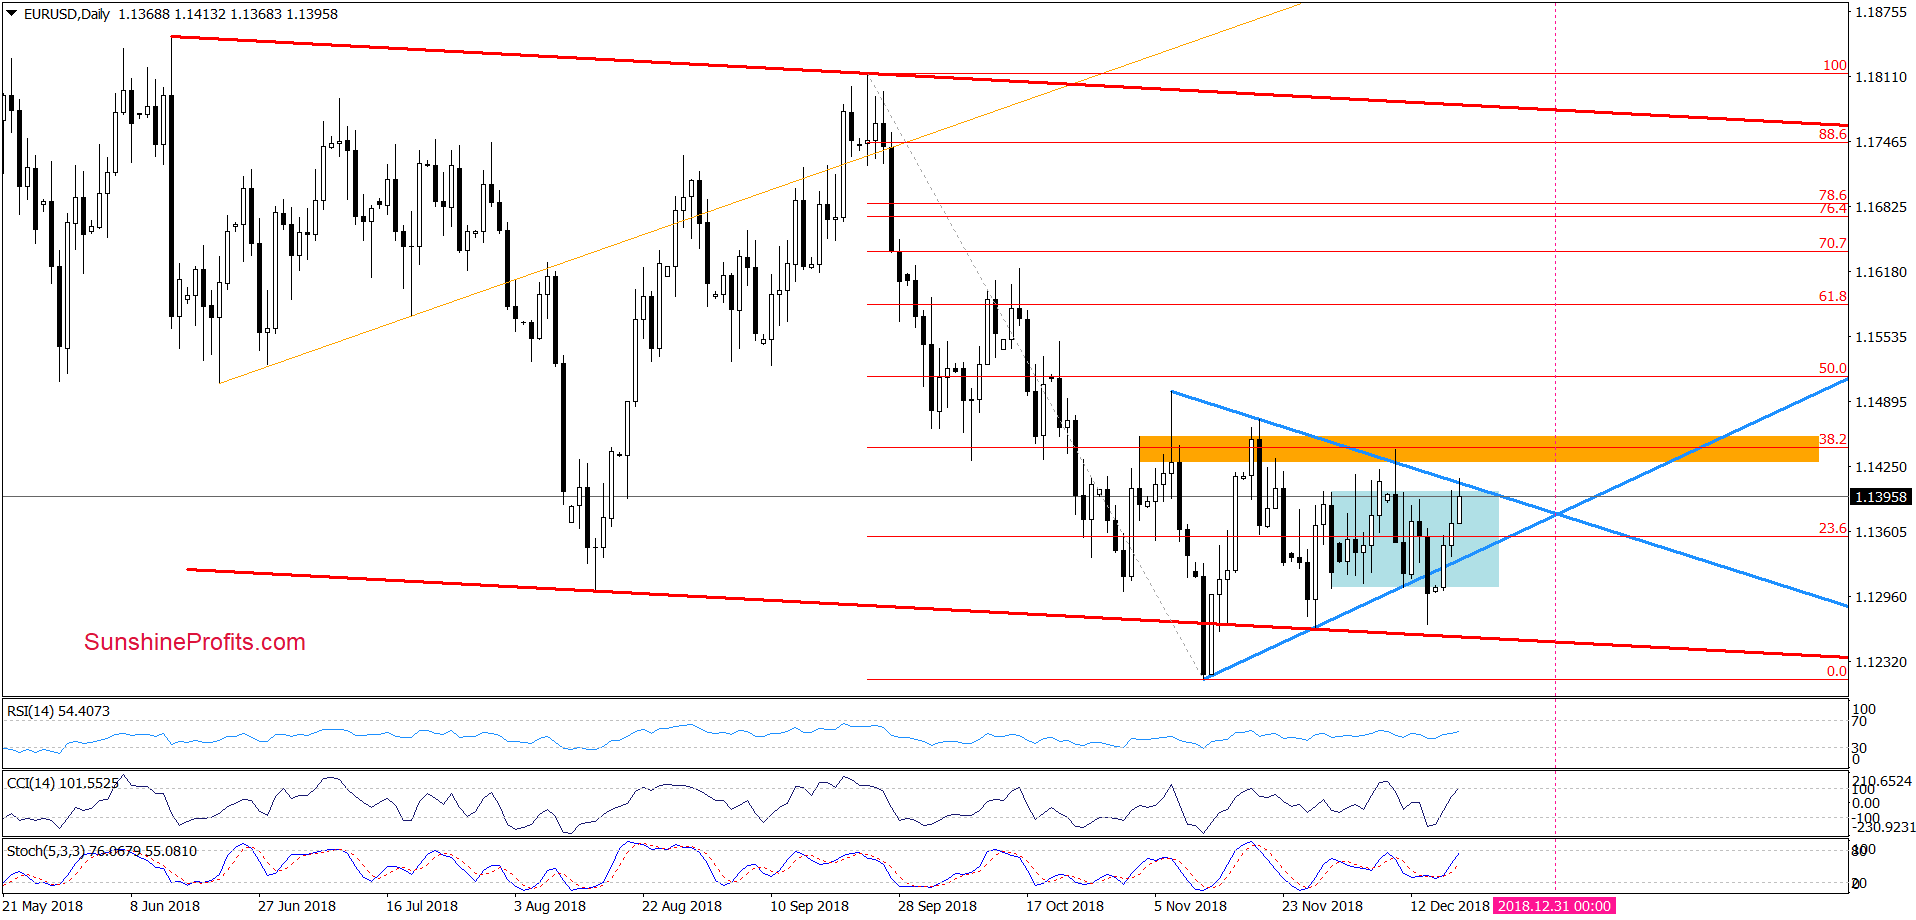
The first thing that catches the eye on the daily chart is an invalidation of the earlier breakdown under the lower border of the blue consolidation and the lower line of the blue triangle, which is a bullish development that suggests further improvement – especially when we factor in the buy signals generated by the CCI and the Stochastic Oscillator.
(…) How high can the pair climb if currency bulls manage to hold gained levels? (…)
(…) In our opinion, if we see a daily closure inside the triangle and the consolidation, the buyers will likely extend gains and test the upper borders of both formation in the very near future (currently at around 1.4002-1.1412).
From today’s point of view, we see that the situation developed in line with our assumptions and EUR/USD reached our upside targets earlier today.
What’s next? Taking into account the current position of the indicators (the buy signals generated by the CCI and the stochastic Oscillator remain in the card), it seems that currency bulls will try to push the exchange rate higher in the very near future.
Nevertheless, as we wrote in our previous alerts, we continue to think that a long as there is no successful breakout above the upper border of the triangle a sizable move to the upside is questionable and one more reversal from the orange resistance area should not surprise us.
Trading position (short-term; our opinion): No positions are justified from the risk/reward perspective. We will keep you informed should anything change, or should we see a confirmation/invalidation of the above.
GBP/USD
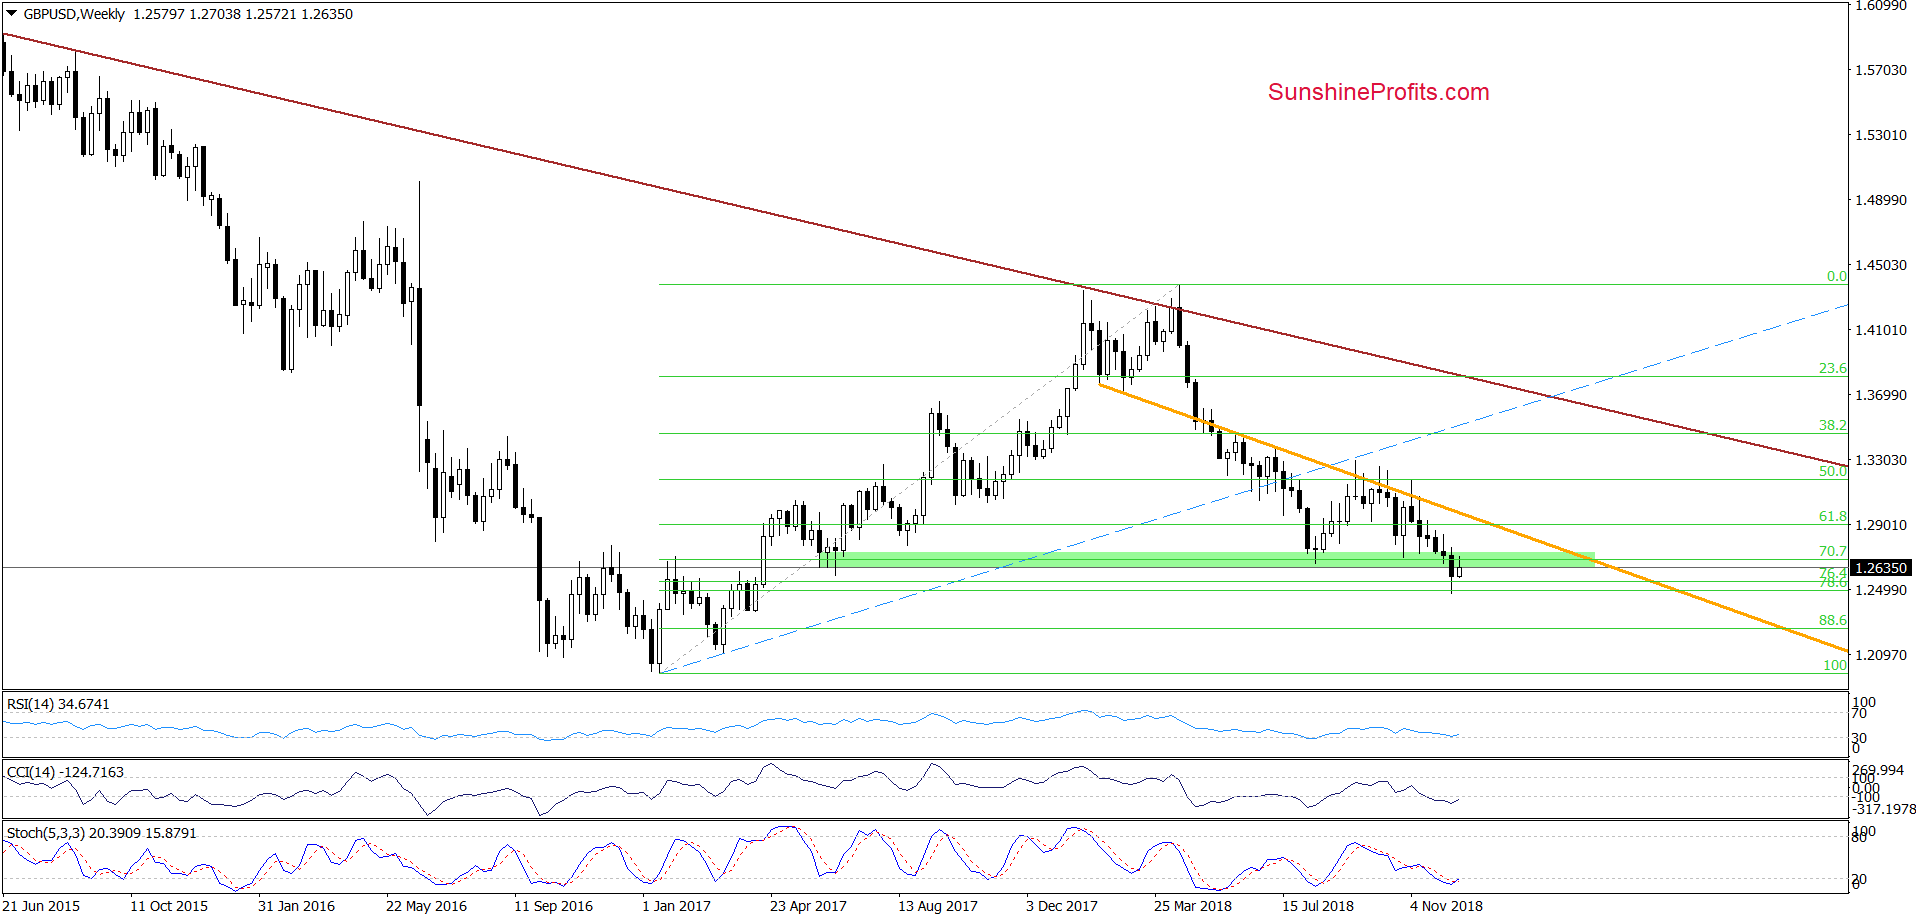
Looking at the weekly chart, we see that the overall situation hasn’t changed much as GBP/USD is still trading under the green zone, which serves now as the nearest resistance.
Taking this fact into account we believe that our last comment on the medium-term situation remains up-to-date also today:
(…) the combination of the 76.4% and 78.6% Fibonacci retracements encouraged the buyers to fight for higher values of the exchange rate. As a result, the pair rebounded, but there was no invalidation of the earlier breakdown, which suggests that the recent move to the upside could be nothing more than a verification of the earlier breakdown.
Nevertheless, taking into account (…) another attempt to move higher and the current position of the indicators (they are very close to generating buy signals), it seems that the buyers have not lost their desire to fight for higher levels yet.
If this is the case and they manage to climb above the green zone, we’ll likely see further improvement and a test of the major resistance line (marked with orange) in the following week(s).
Having said the above, let’s check what can we infer from the daily chart.
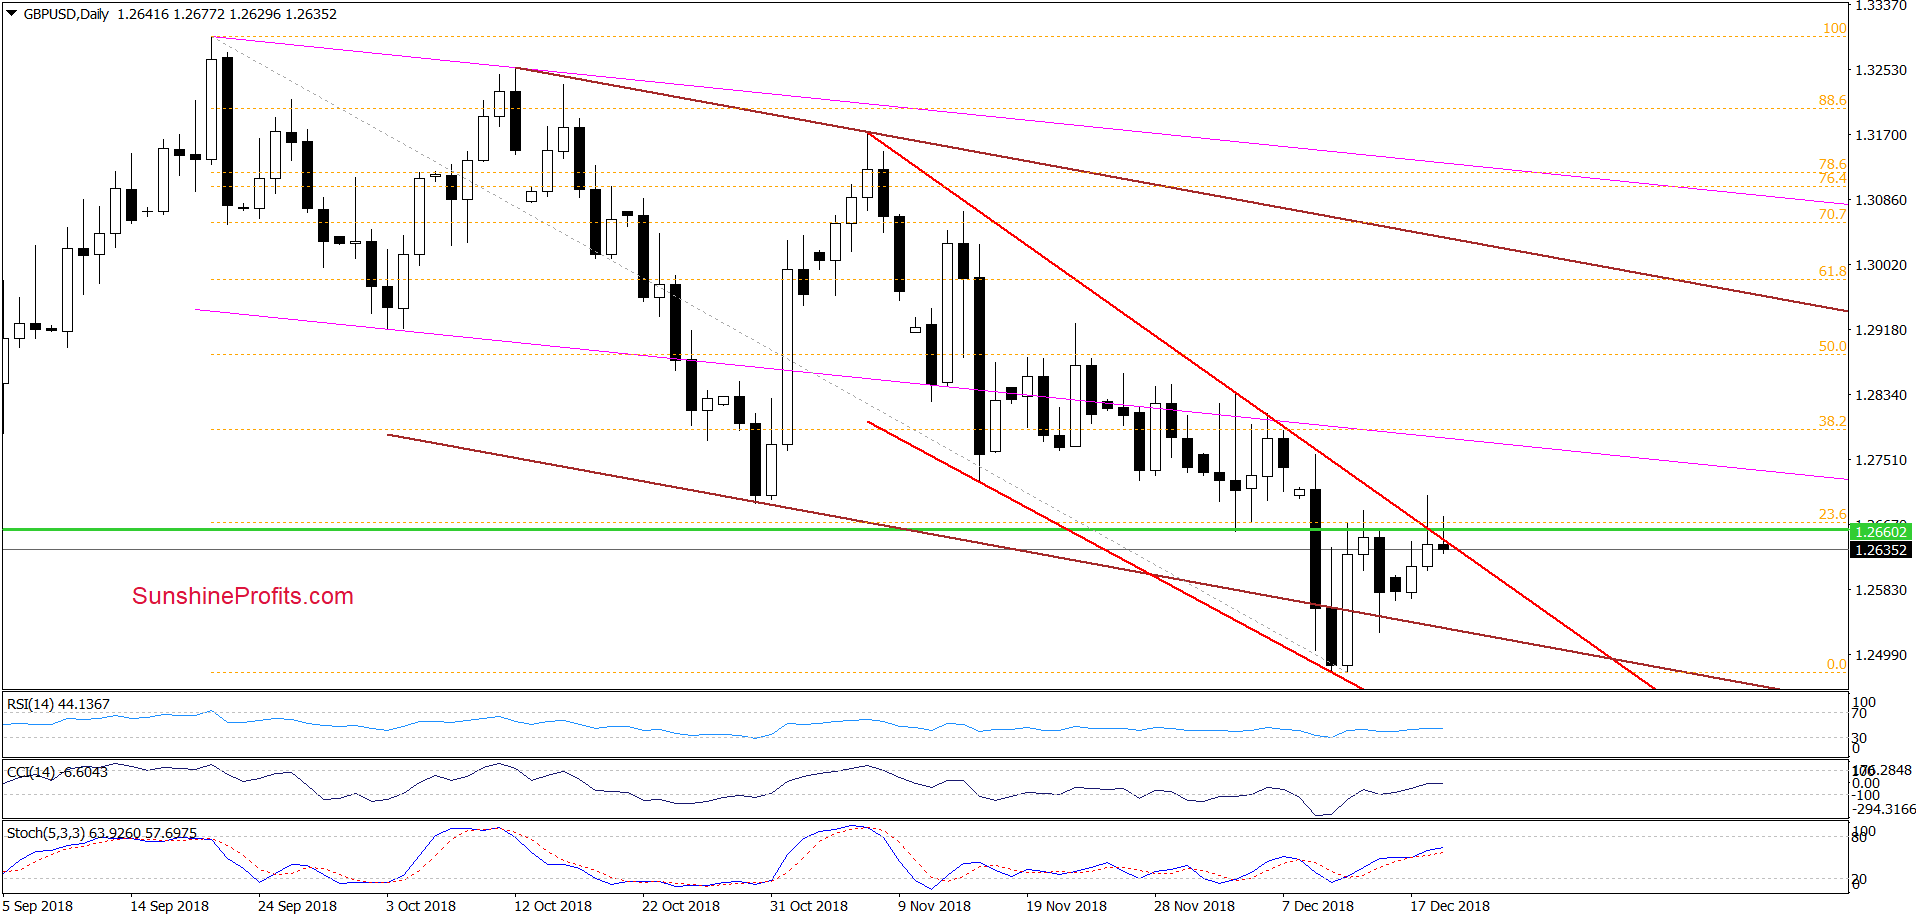
On the above chart, we see that although the buyers pushed GBP/USD above the green horizontal line (based on the mid-August low) yesterday and earlier today, the upper border of the red declining trend channel stopped them, triggering a pullback.
Thanks to this price action, the pair invalidated the earlier tiny breakouts above both lines, which doesn’t bode well for higher values of GBP/USD. Therefore, if we see another daily closure below these resistances, the bears will likely trigger another move to the downside.
How low can GBP/USD go?
In our opinion, if the buyers fail and show weakness in this area, the way to the lower border of the brown declining trend channel (or even this week’s lows) will be open.
Trading position (short-term; our opinion): No positions are justified from the risk/reward perspective. We will keep you informed should anything change, or should we see a confirmation/invalidation of the above.
AUD/USD
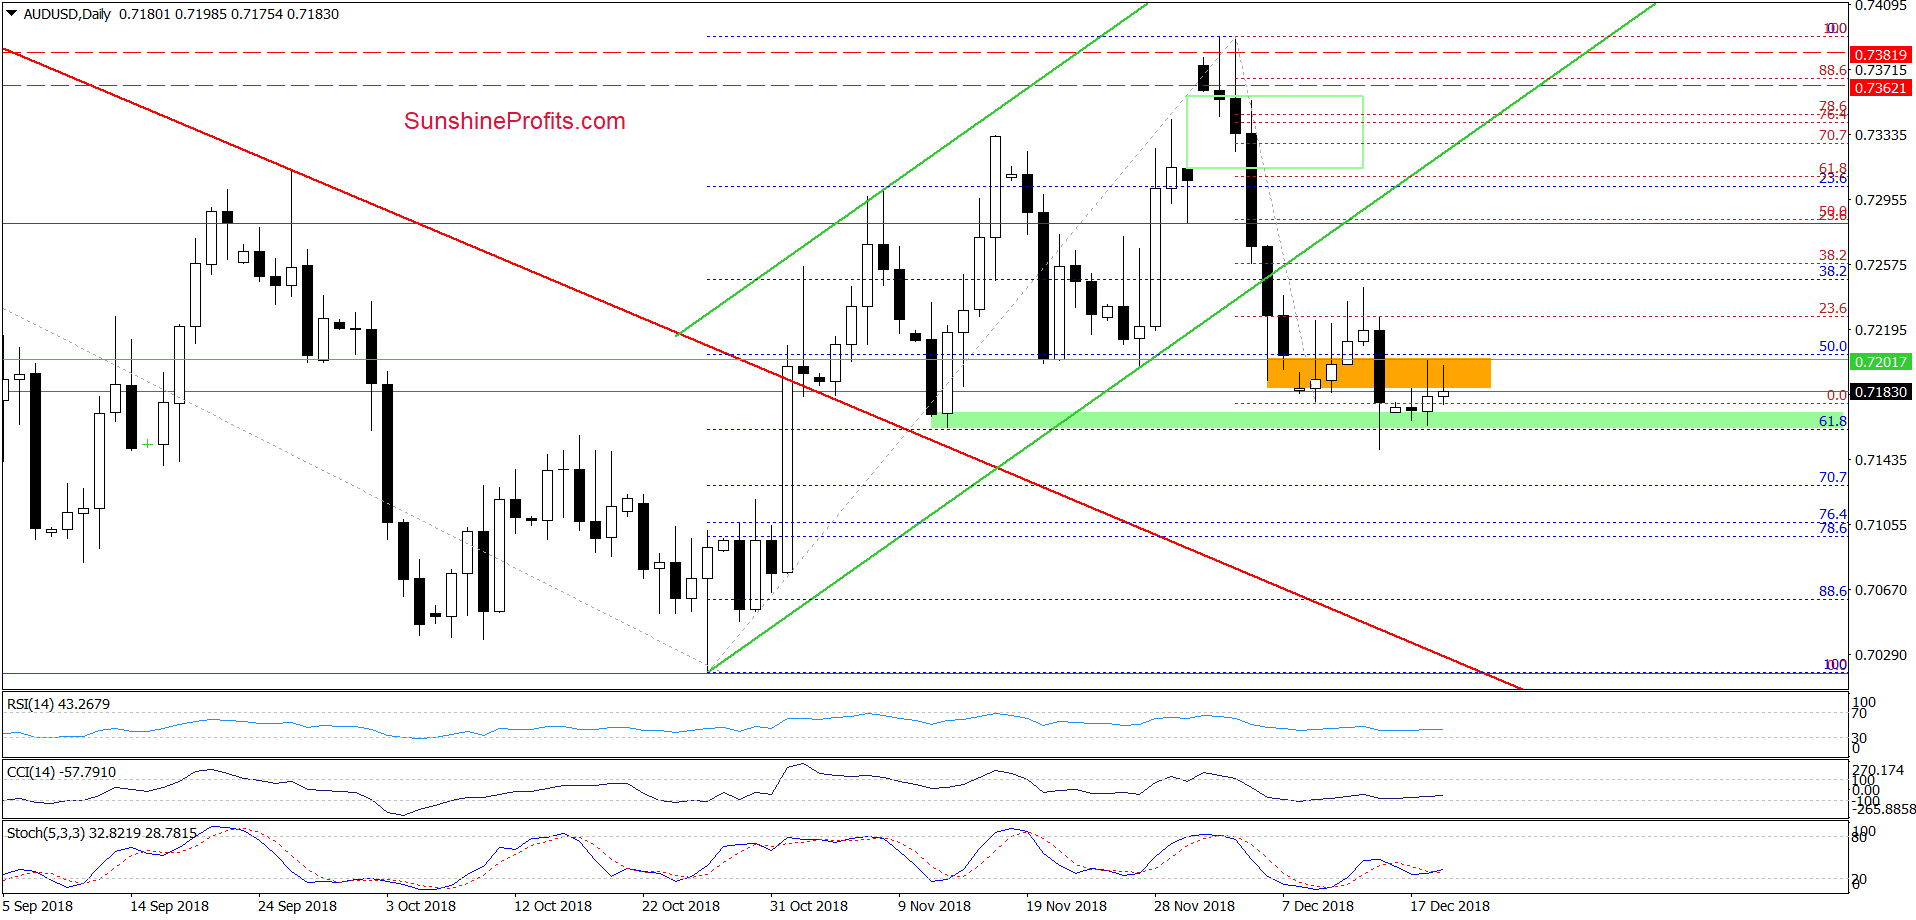
From today’s point of view, we see that although AUD/USD slipped slightly below the green support zone (based on the mid-November low and the 61.8% Fibonacci retracement) in the previous week, currency bulls managed to trigger a rebound, which caused an invalidation of the earlier breakdown before Friday’s closure.
This positive event encouraged the buyers to push the pair higher in recent days, but the size of the move is currently quite disappointing as AUD/USD didn’t even reach the last week highs. Therefore, one more downswing and a test of the green zone should no surprise us in the very near future.
Nevertheless, the current position of the daily indicators suggests that the space for declines is limited and another attempt to move higher can be just around the corner. If this is the case and the buyers withstand the selling pressure in green zone, AUD/USD will likely rebound and test the last week’s peaks.
On the other hand, if the bulls fail and allow their opponents to break below the green zone and the last week’s low, the way to by the 76.4% and 78.6% Fibonacci retracements will likely be open.
Trading position (short-term; our opinion): No positions are justified from the risk/reward perspective. We will keep you informed should anything change, or should we see a confirmation/invalidation of the above.
Thank you.
Nadia Simmons
Forex & Oil Trading Strategist
Przemyslaw Radomski, CFA
Founder, Editor-in-chief, Gold & Silver Fund Manager
Gold & Silver Trading Alerts
Forex Trading Alerts
Oil Investment Updates
Oil Trading Alerts

