

On Thursday, currency bulls invalidated the earlier tiny breakdown under the Fibonacci retracement, which triggered another test of the nearest resistance area. How did the attack of buyers end and what is its pronunciation?
- EUR/USD: short (a stop-loss order at 1.1593; the initial downside target at 1.1337)
- GBP/USD: none
- USD/JPY: none
- USD/CAD: none
- USD/CHF: none
- AUD/USD: short (a stop-loss order at 0.7288; the initial downside target at 0.7055)
EUR/USD
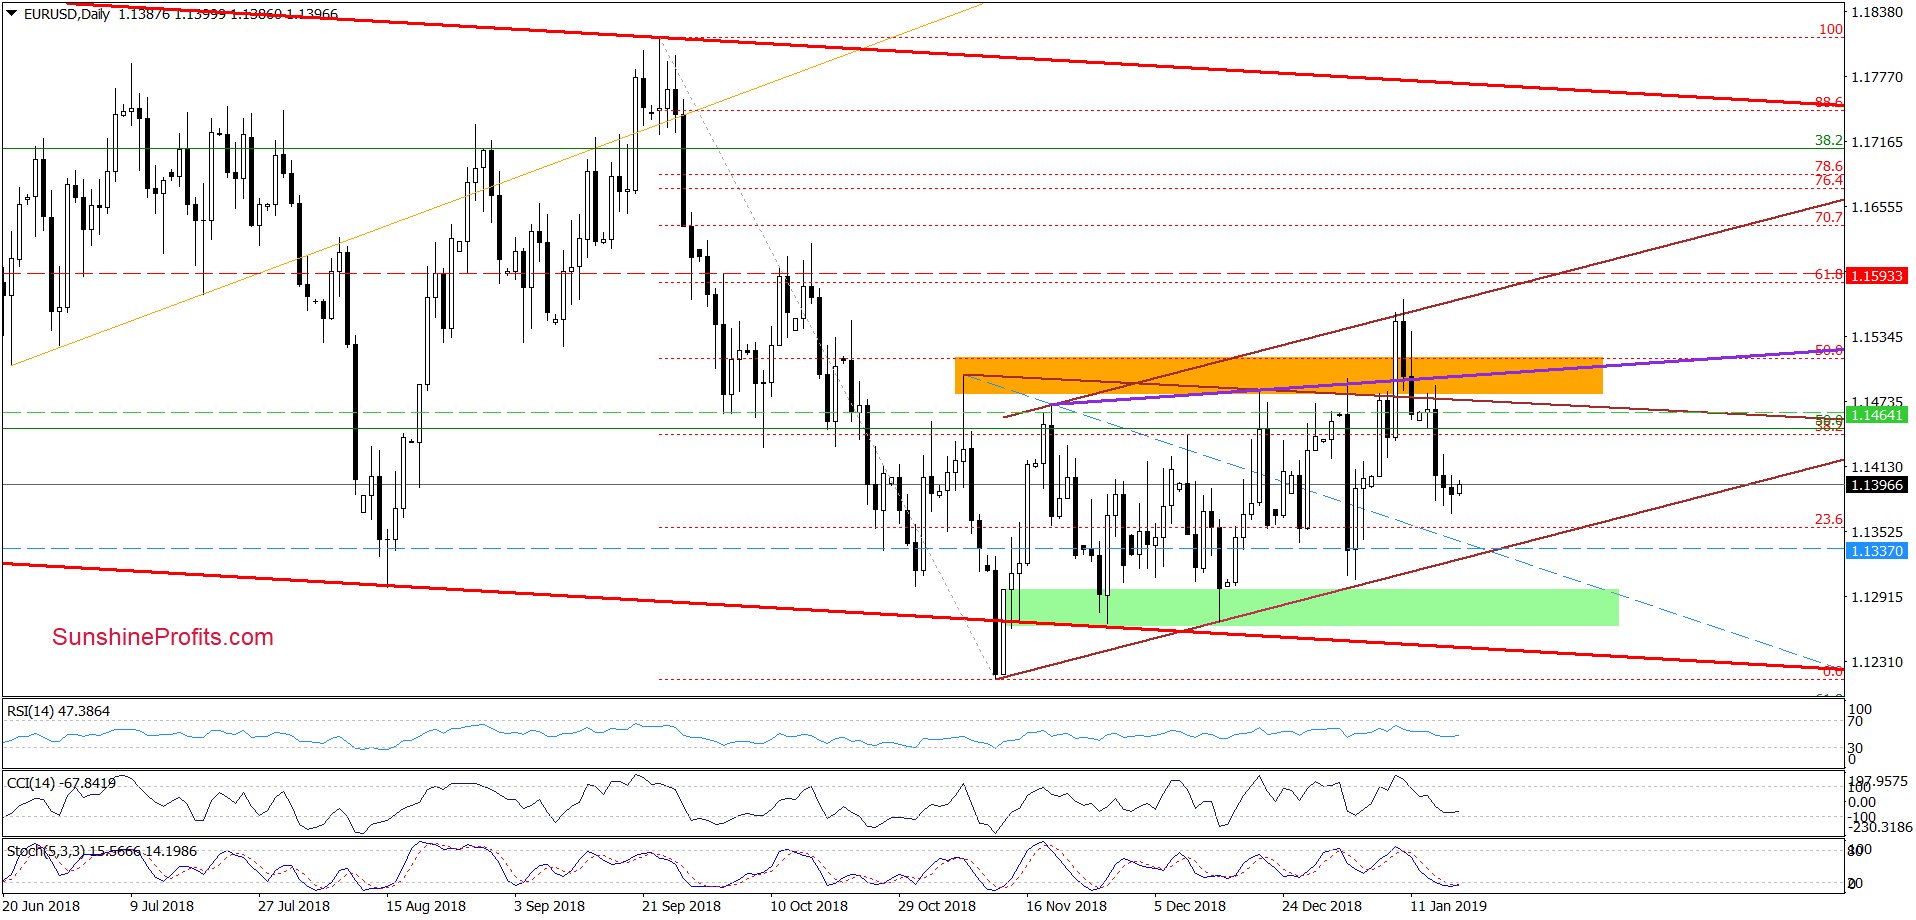
Although EUR/USD increased a bit earlier today, the overall situation in the short term hasn’t changed much as the exchange rate is still trading well below the previously-broken levels, which means that invalidations of the earlier breakouts and their negative impact on the exchange rate remain in effect.
Additionally, today’s upswing didn’t even take EUR/USD above yesterday’s peak, which together with the lack of the buy signals generated by the daily indicators increases the probability that we’ll see a realization of the last Friday’s scenario in the very near future:
(…) currency bears could take the pair to around 1.1335 or even the lower border of the brown triangle in the following days (currently at 1.1316).
Trading position (short-term; our opinion): Profitable short positions with a stop-loss order at 1.1593 and the initial downside target at 1.1337 are justified from the risk/reward perspective. We will keep you informed should anything change, or should we see a confirmation/invalidation of the above.
USD/CHF
In our last commentary on this currency pair, we wrote the following:
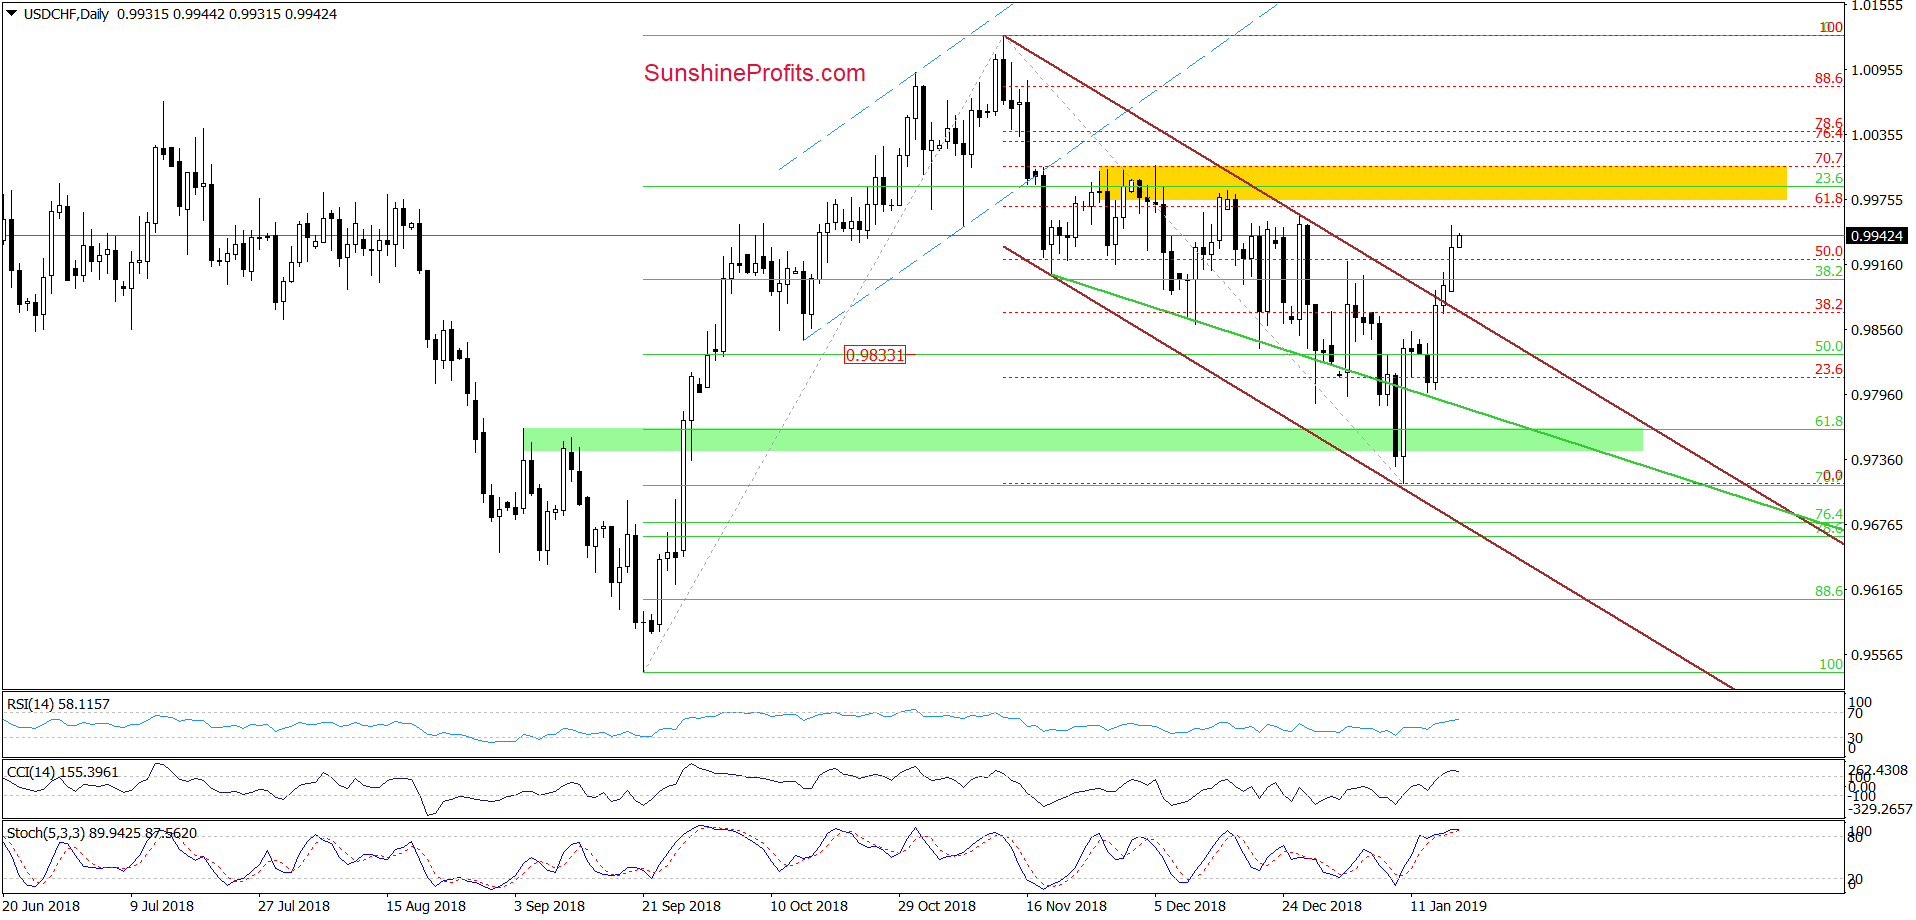
(…) Thanks to yesterday’s drop, the pair also slipped to the above-mentioned green line, which looks like a verification of the last week’s breakout. If this is the case and the buyers push USD/CHF higher in the coming day(s), we’ll see at least a test of the upper border of the brown declining trend channel.
Looking at the daily chart, we see that currency bulls not only took USD/CHF to the upper border of the brown declining trend channel, but also managed to break above it, which suggests a test of the 61.8% Fibonacci retracement and the yellow resistance zone in the coming day(s).
Trading position (short-term; our opinion): No positions are justified from the risk/reward perspective.
AUD/USD
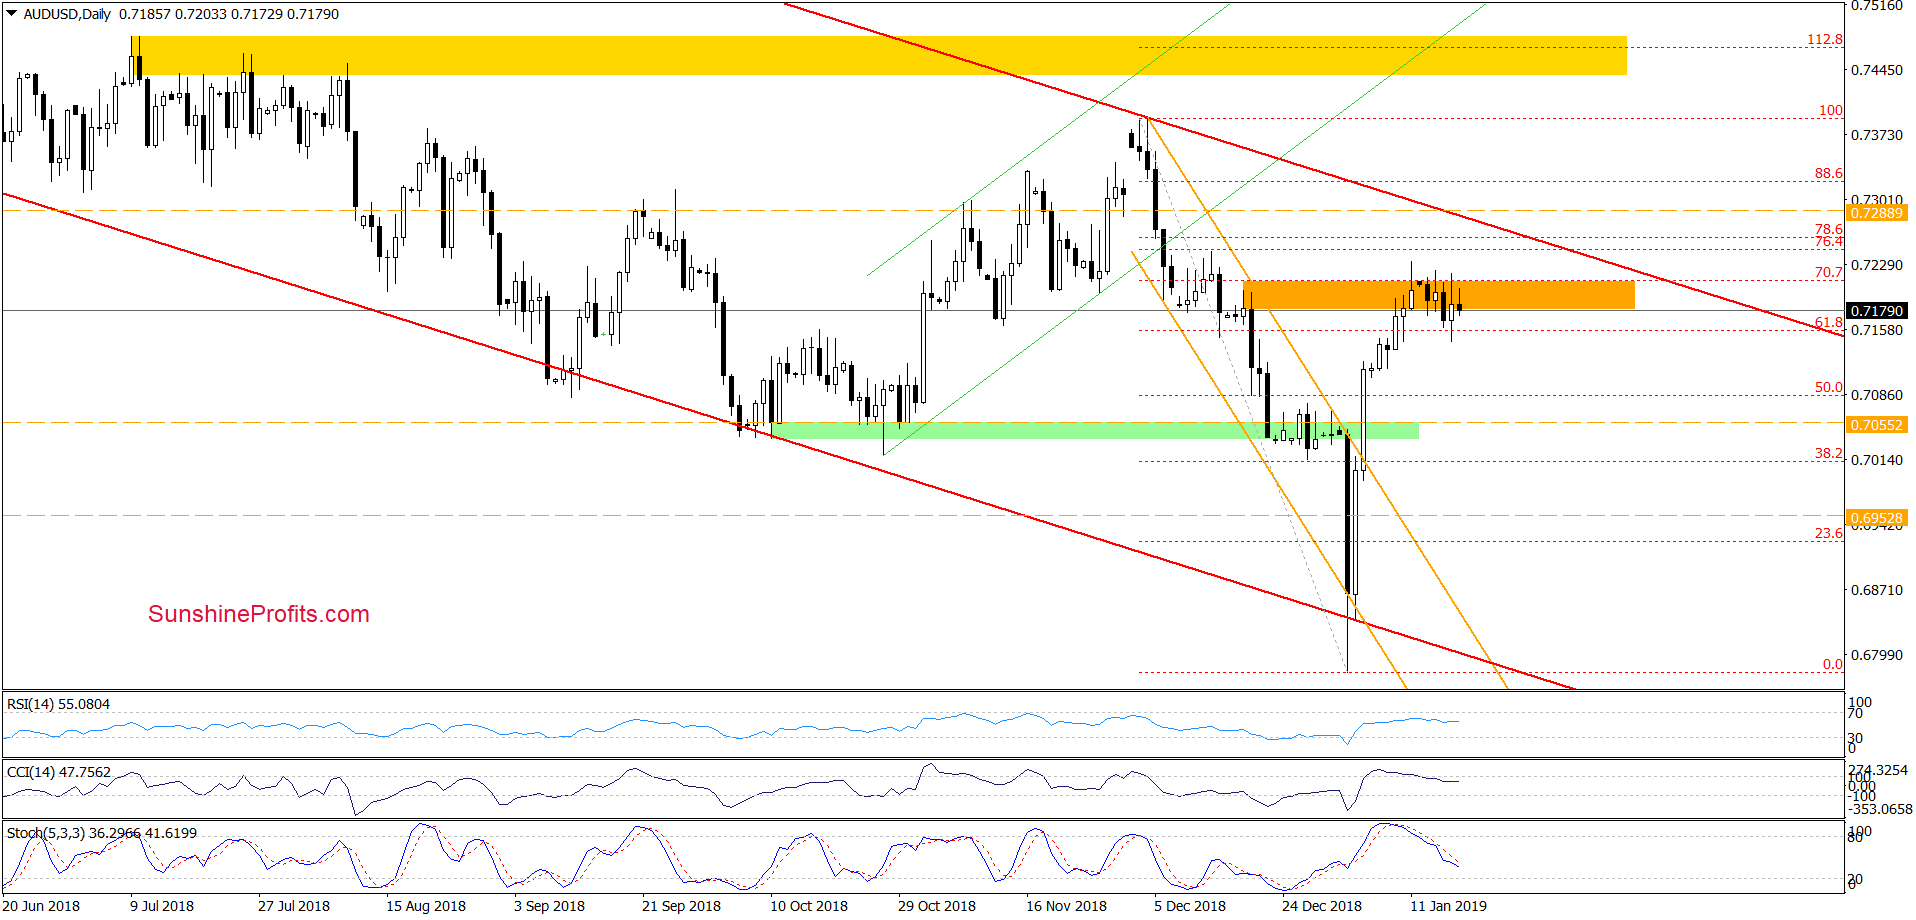
From today’s point of view, we see that although the buyers triggered an upswing during yesterday’s session, the 70.7% Fibonacci retracement in combination with the upper border of the orange resistance zone stopped them once again.
As a result, the pair invalidated the earlier tiny breakout above these levels, which suggests another attempt to move lower in the following day(s) – especially when we factor in the fact that the sell signals generated by the indicators continue to support the sellers and lower values of AUD/USD.
Taking all the above into account, we think that if the pair extends losses from current levels, we’ll likely see (at least) a test of the 38.2% Fibonacci retracement and the previously-broken green support area in the coming week.
Trading position (short-term; our opinion): Profitable short positions with a stop-loss order at 0.7288 and the initial downside target at 0.7055 are justified from the risk/reward perspective. We will keep you informed should anything change, or should we see a confirmation/invalidation of the above.
Thank you.
Nadia Simmons
Forex & Oil Trading Strategist
Przemyslaw Radomski, CFA
Editor-in-chief, Gold & Silver Fund Manager

