

Although currency bears took AUD/USD to the lowest level since early February 2016, the long-term support line stopped the sellers for the second time in a row. As a result, the pair rebounded, but stuck in consolidation very quickly. When can we expect a breakthrough?
EUR/USD
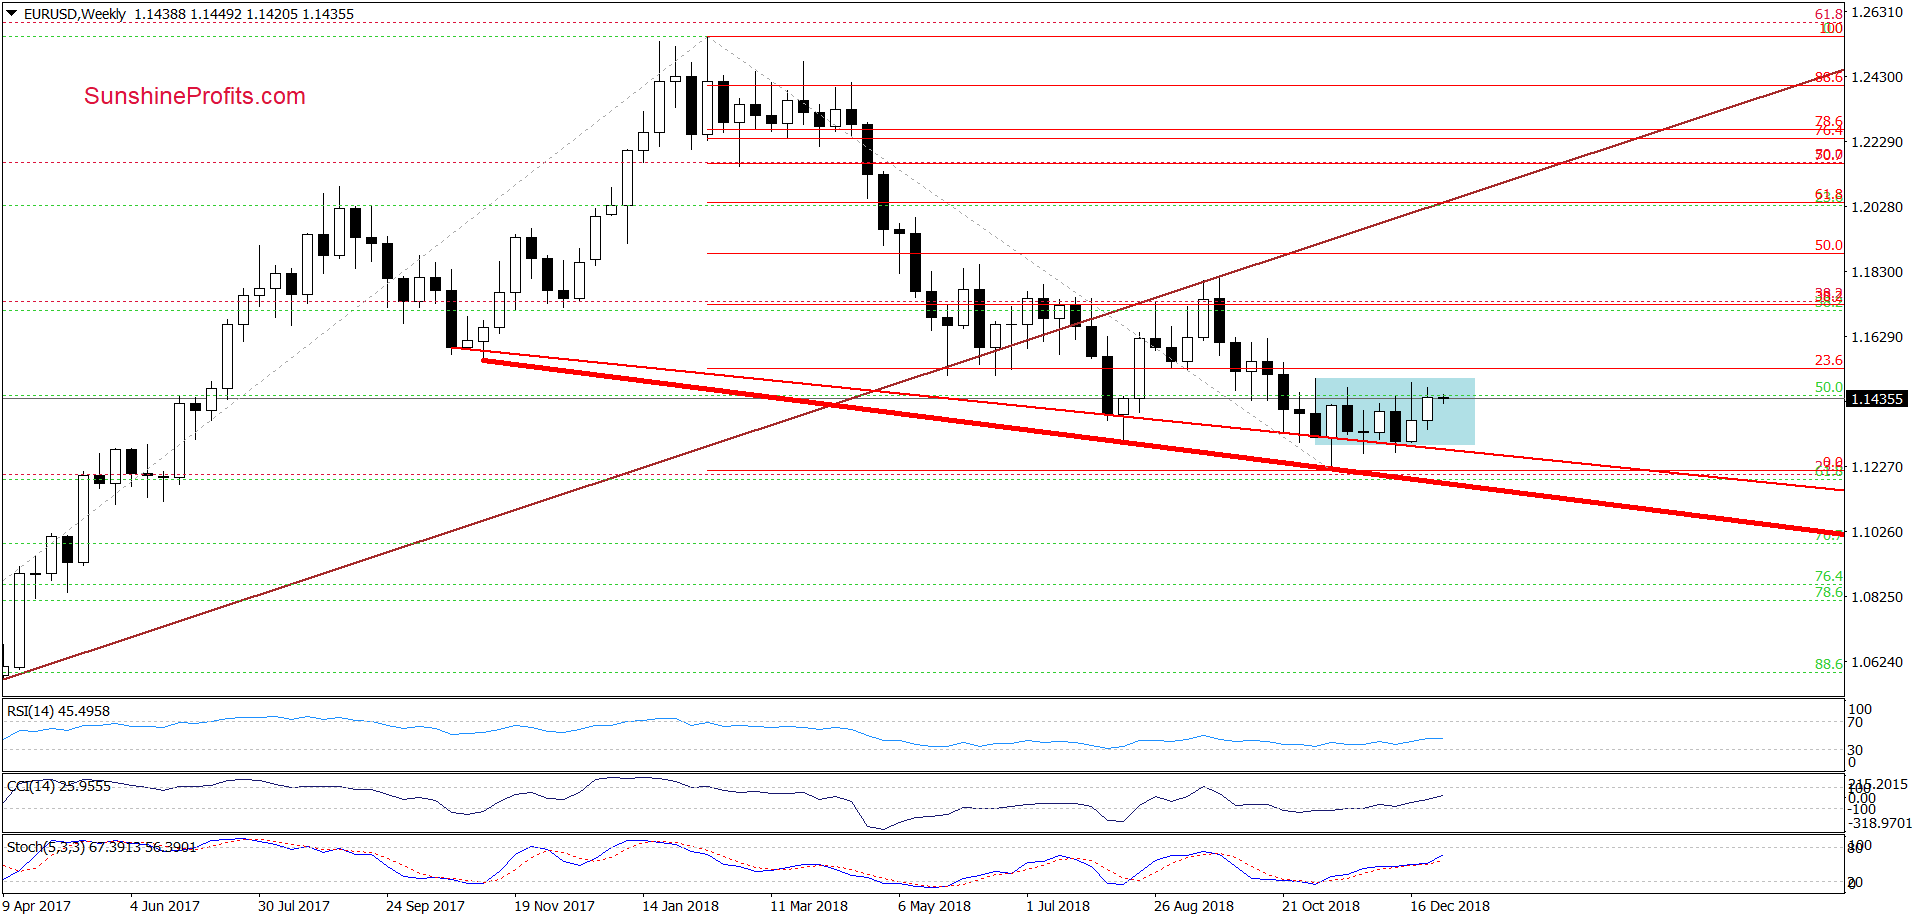
Looking at the weekly chart, we see that the overall situation in the medium term hasn’t changed much as EUR/USD is still trading in a narrow range (marked as a blue consolidation) between the red support line and the recent peaks.
Will the daily chart give us more clues about future moves? Let’s check.
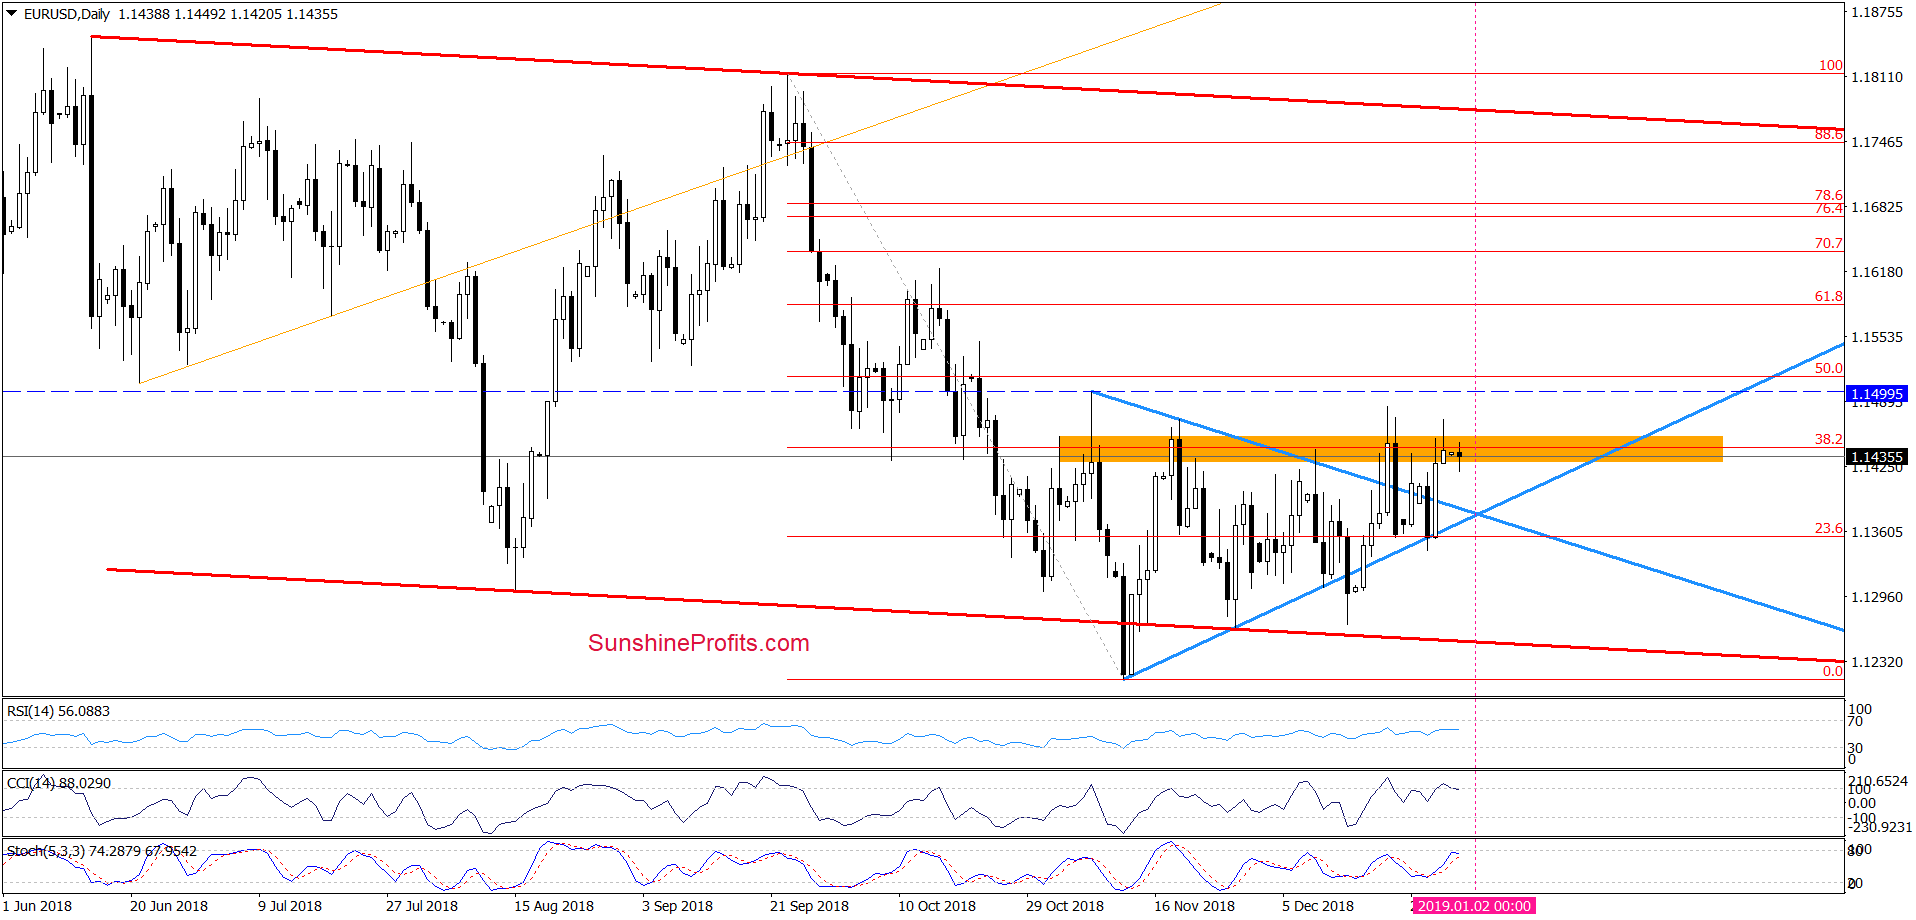
From this perspective, we see that although currency bulls took EUR/USD above the upper border of the blue triangle and tested the orange zone, there was no daily closure above this resistance area, which raises some doubts about the buyers’ strength.
Nevertheless, as long as the exchange rate remains above the triangle one more upswing is likely. How high can the pair go if currency bulls do not fail later in the day?
We believe that the best answer to this question will be the quotes from our last alert:
(…) we’ll likely see a test of the December high or even the early-November peak and the 50% Fibonacci retracement in the coming days.
Nevertheless, we think that this pro-growth scenario will be more likely and reliable if the exchange rate closes today’s session above the orange resistance area.
Finishing today’s commentary on this currency pair, please keep in mind what we wrote yesterday about potential reversal:
(…) The intersection of the arms of the triangle will take place at the beginning of the next year, which means that both Monday and Wednesday sessions may indicate the place where the reversal will take place - according to the Triangle Apex Reversal technique.
Depending on where this happens, we will take further investment decisions. In other words, if the bulls push the currency pair above the orange resistance zone and fail to keep the EUR/USD above this resistance once again, we will consider the opening short positions. (…)
Trading position (short-term; our opinion): No positions are justified from the risk/reward perspective. We will keep you informed should anything change, or should we see a confirmation/invalidation of the above.
GBP/USD
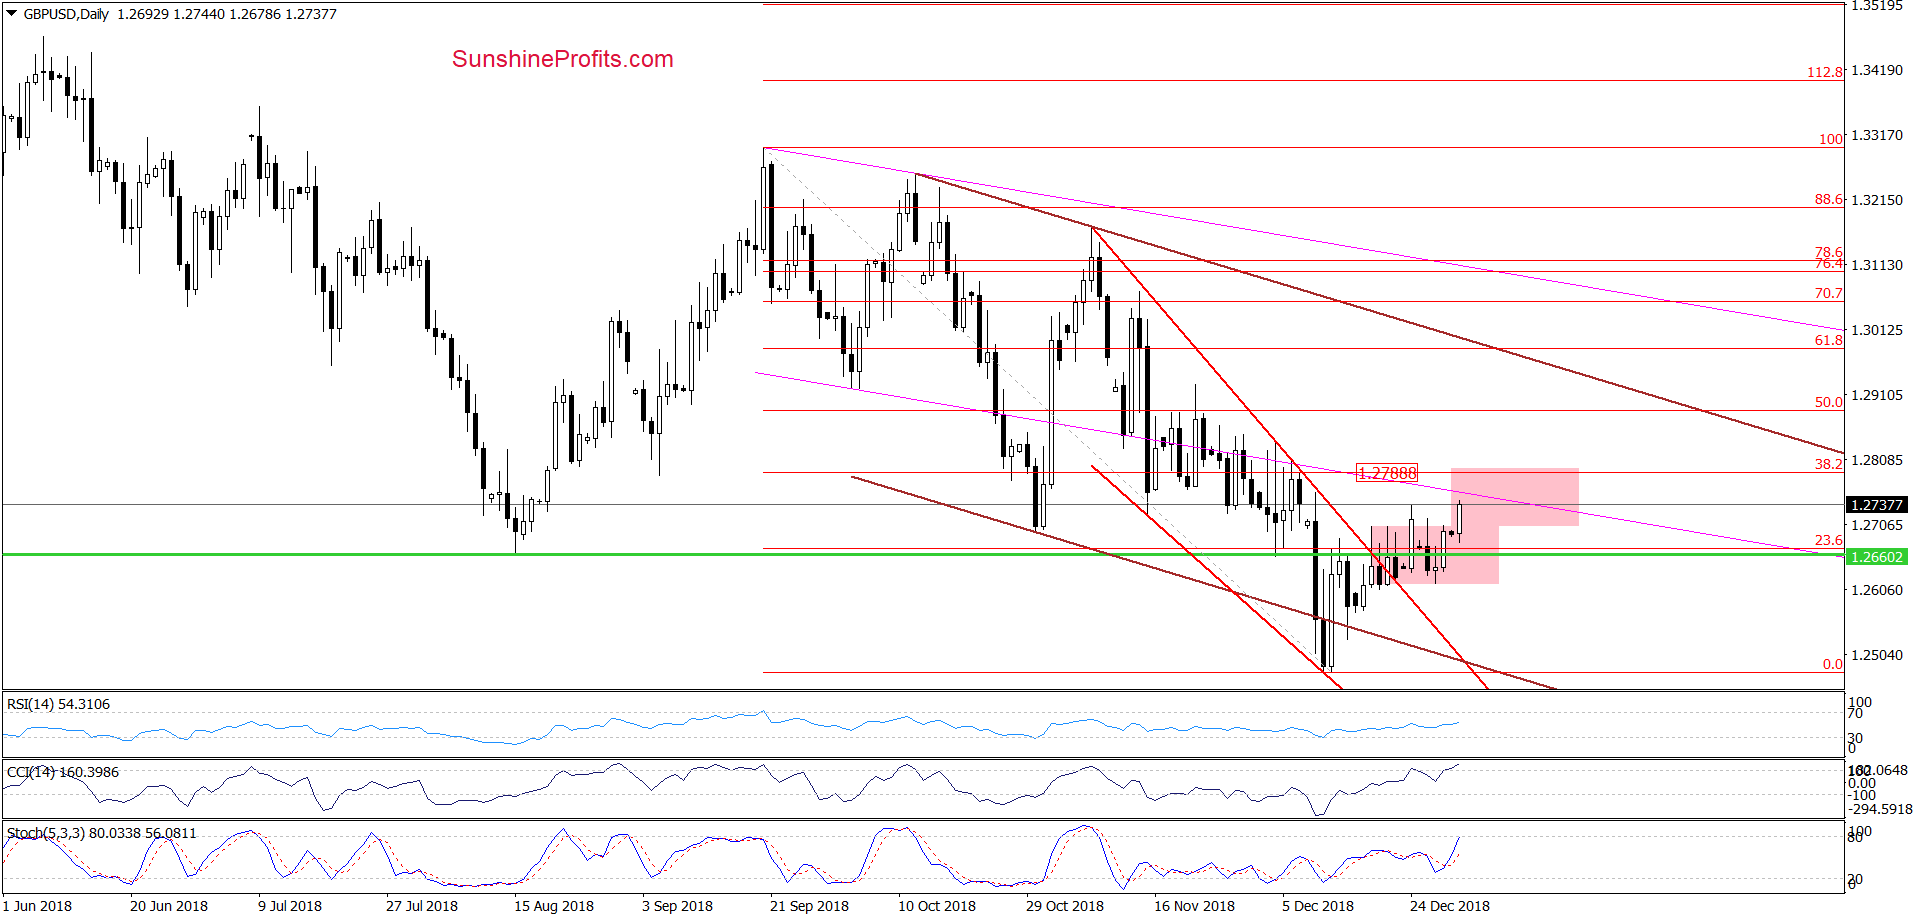
The first thing that caches the eye on the daily chart is today’s breakout above the upper border of the pink consolidation. Additionally, currency bulls managed to push GBP/USD above the last week’s peak, which suggests that we’ll likely see an increase to (at least) 1.2788, where the 38.2% Fibonacci retracement is.
If this resistance level is broken, the way to the next retracement or even the upper border of the brown declining trend channel will be open.
Trading position (short-term; our opinion): No positions are justified from the risk/reward perspective. We will keep you informed should anything change, or should we see a confirmation/invalidation of the above.
AUD/USD
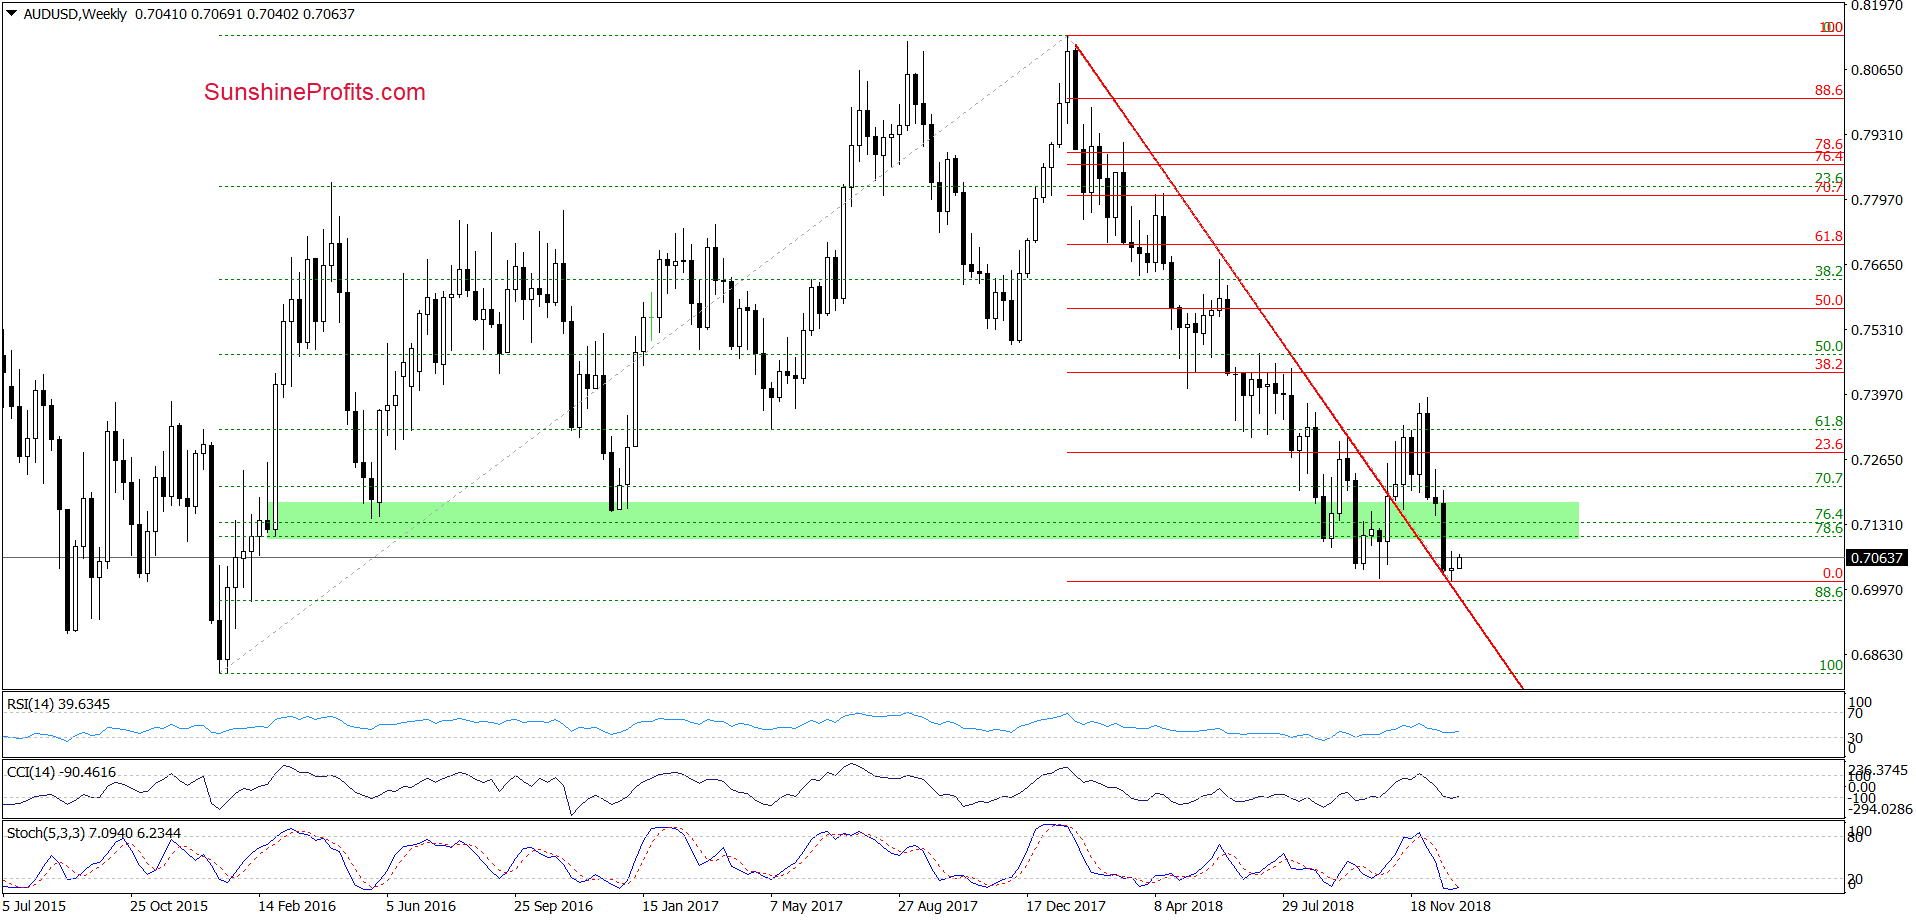
On the medium-term chart, we see that AUD/USD extended losses in the previous week and hit a fresh low. Nevertheless, the previously-broken red declining support line stopped the sellers for the second time in a row, suggesting that reversal and bigger rebound from this area may be just around the corner.
Will the very short-term chart confirm this scenario?
Before we answer this question, let’s recall the quotes from our last commentary on this currency pair:
(…) AUD/USD approached the last week’s lows, which could translate into another rebound. However, in our opinion, the layout of the entire recent downward move (begun in mid-December) suggests that one more downswing and a drop to the October 26 low or even the previously-broken red declining line may still be ahead of us.
Nevertheless, the current position of the daily indicators indicates that the space for declines is limited and a reversal may be just around the corner (maybe we will see it at the same time as in the case of EUR / USD).
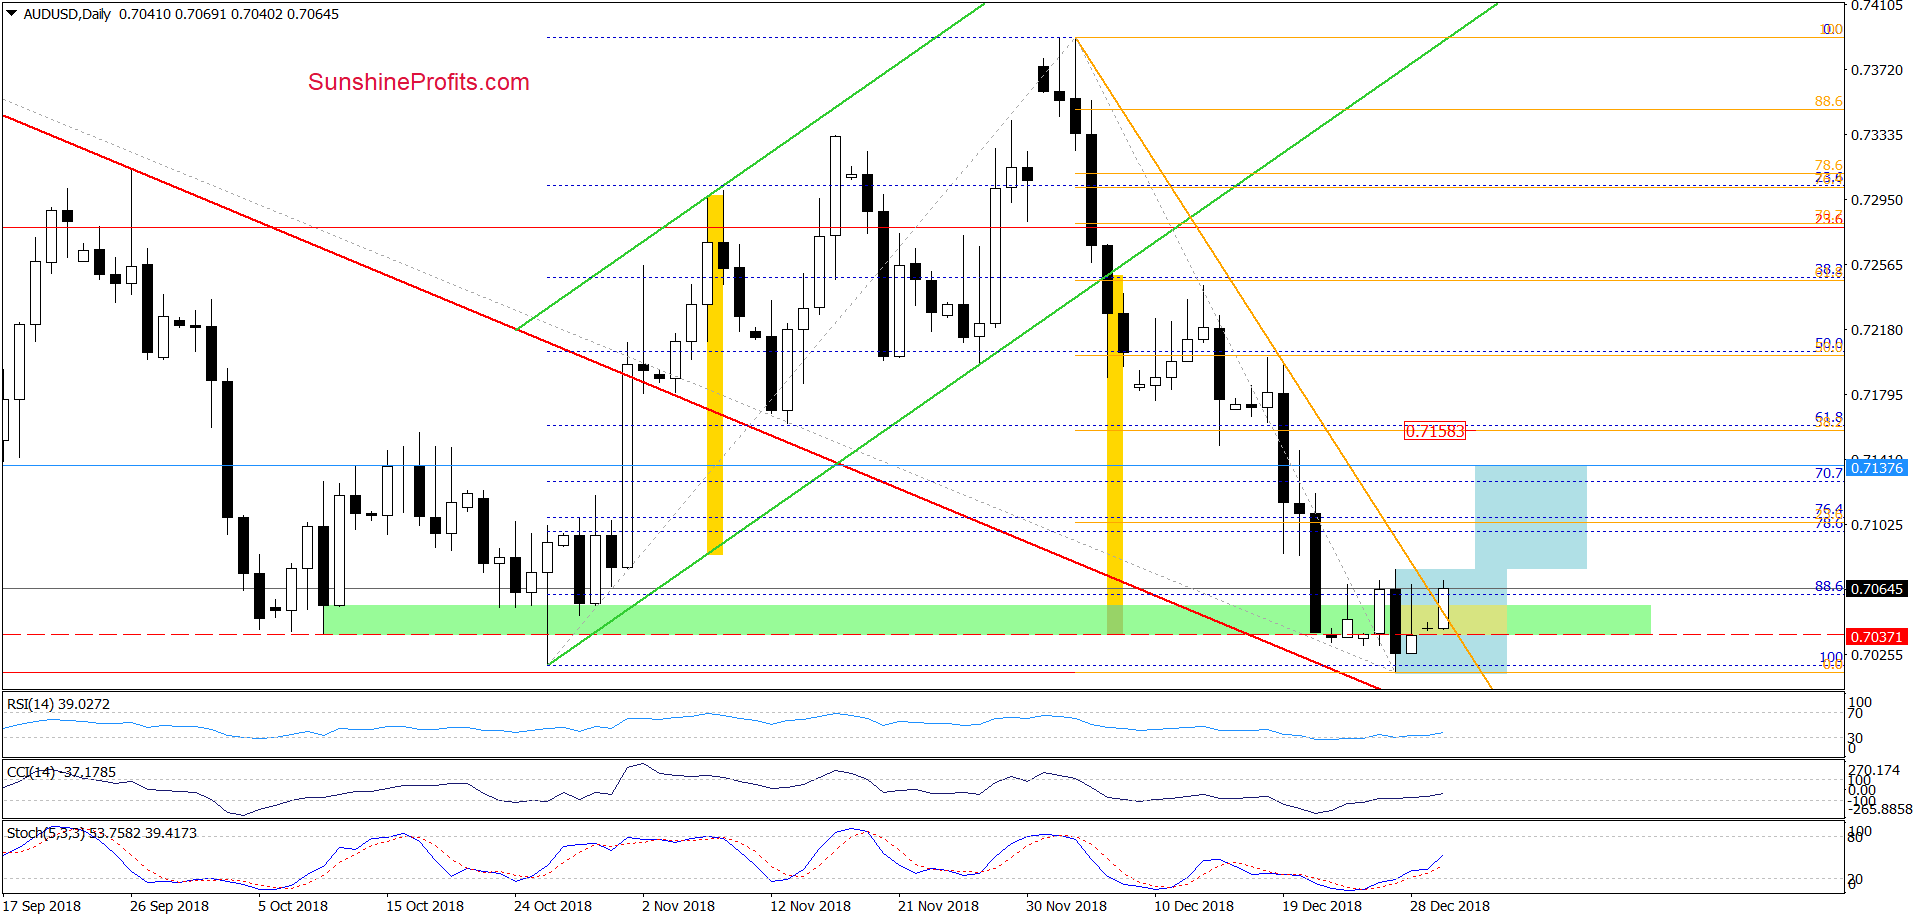
From today’s point of view, we see that the situation developed in tune with our assumptions and AUD/USD hit a fresh low. Although the exchange rate slipped slightly below the October low, the proximity to the next support encouraged currency bulls to act on the following day.
Thanks to their action, the pair invalidated the Thursday breakdown and daily indicators generated buy signals, suggesting further improvement. Earlier today, the combination of these factors triggered further improvement, increasing the probability that we’ll see a test of the upper border of the blue consolidation.
Nevertheless, in our opinion, as long as there is no breakout above the formation short-lived moves in both directions are likely. But if currency bulls show strength and the pair breaks above 0.7075 (the December 27 high), we could see an increase to around 0.7137, where the size of the upward move will correspond to the height of the formation. If we see such price action, we’ll consider opening long positions. We will keep you informed should anything change, or should we see a confirmation/invalidation of the above.
Trading position (short-term; our opinion): No positions are justified from the risk/reward perspective.
Thank you.
Nadia Simmons
Forex & Oil Trading Strategist
Przemyslaw Radomski, CFA
Founder, Editor-in-chief, Gold & Silver Fund Manager
Gold & Silver Trading Alerts
Forex Trading Alerts
Oil Investment Updates
Oil Trading Alerts

