

Wednesday sharp decline pushed the Australian dollar to the lowest level since the beginning of November against the greenback. Earlier today, currency bulls lost another ally. Where can the bears go in the coming days?
- EUR/USD: none
- GBP/USD: none
- USD/JPY: none
- USD/CAD:none
- USD/CHF:none (as our short positions were closed with a profit by the closing order before the end of yesterday's session)
- AUD/USD:none
EUR/USD
Quoting our last commentary on this currency pair:
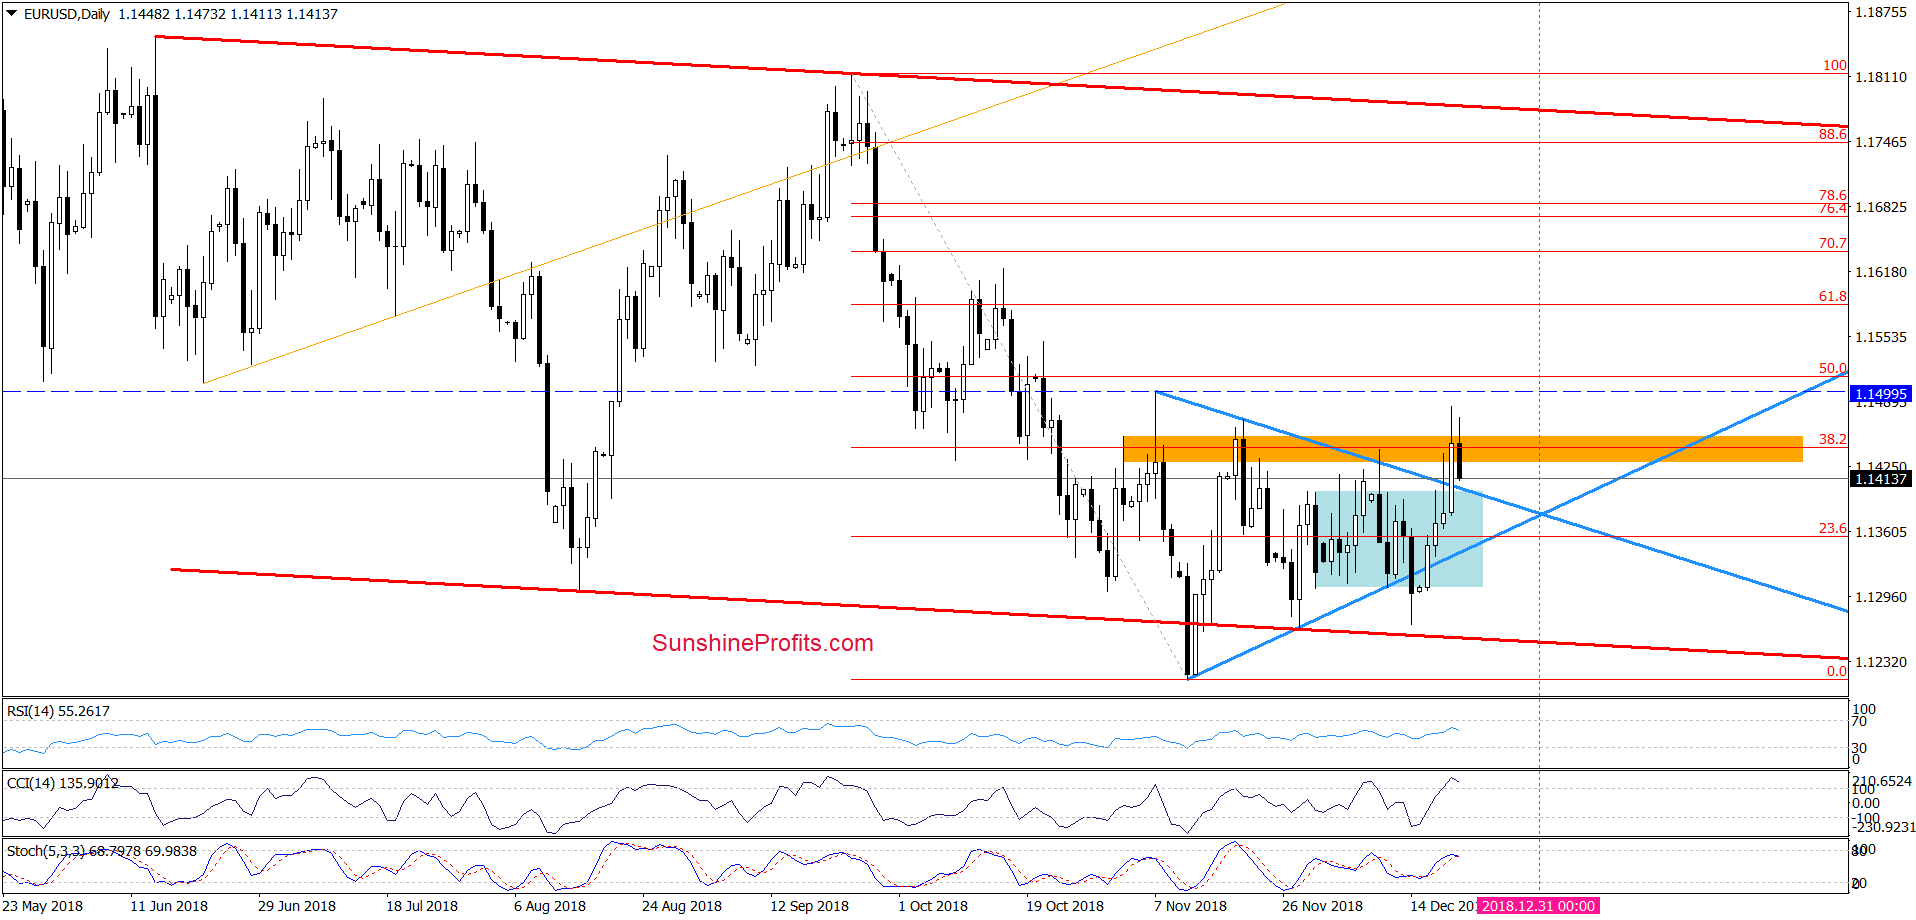
(…) the exchange rate broke not only above the upper border of the blue consolidation, but also above the upper line of the blue triangle and the orange resistance zone, which stopped the buyers several times in the previous weeks.
This is a bullish development, which suggests further improvement (…)
Nevertheless, in our opinion, the pro-growth scenario will be more likely and reliable if the pair closes today’s session above all these resistances.
Looking at the daily chart, we see that although currency bulls the exchange rate sharply higher during yesterday’s session, they didn’t manage to close the day above the important resistance described yesterday.
This show of weakness encouraged the sellers to act earlier. As a result, the pair slipped under the previously-broken orange zone, invalidating the Thursday’s breakout. Although this is a negative development, it will turn into bearish only if we see a daily closure under this area. In this case, such bearish development can trigger further deterioration at the beginning of the coming week and cause a test of the lower line of the triangle or even a test of this week’s lows.
Nevertheless, before we begin to consider this grim scenario, we must bear in mind the fact that EUR/USD approached the upper line of the blue triangle earlier today, which suggests that today’s price action can be nothing more than just a verification of yesterday’s breakout above the formation.
If this is the case and the bulls push the pair above the orange resistance zone later in the day (erasing today’s drop), we’ll likely see a test of the early-November high and the 50% Fibonacci retracement.
Connecting the dots, at the moment of writing this alert, we believe that the attitude of the bulls during today's session will decide whether the next week of EUR/USD will start from declines or rises. We will keep you informed should anything change, or should we see a confirmation/invalidation of the above.
Trading position (short-term; our opinion): No positions are justified from the risk/reward perspective, but if the pair closes today’s session above all the aforementioned resistances, we’ll consider opening long positions.
GBP/USD
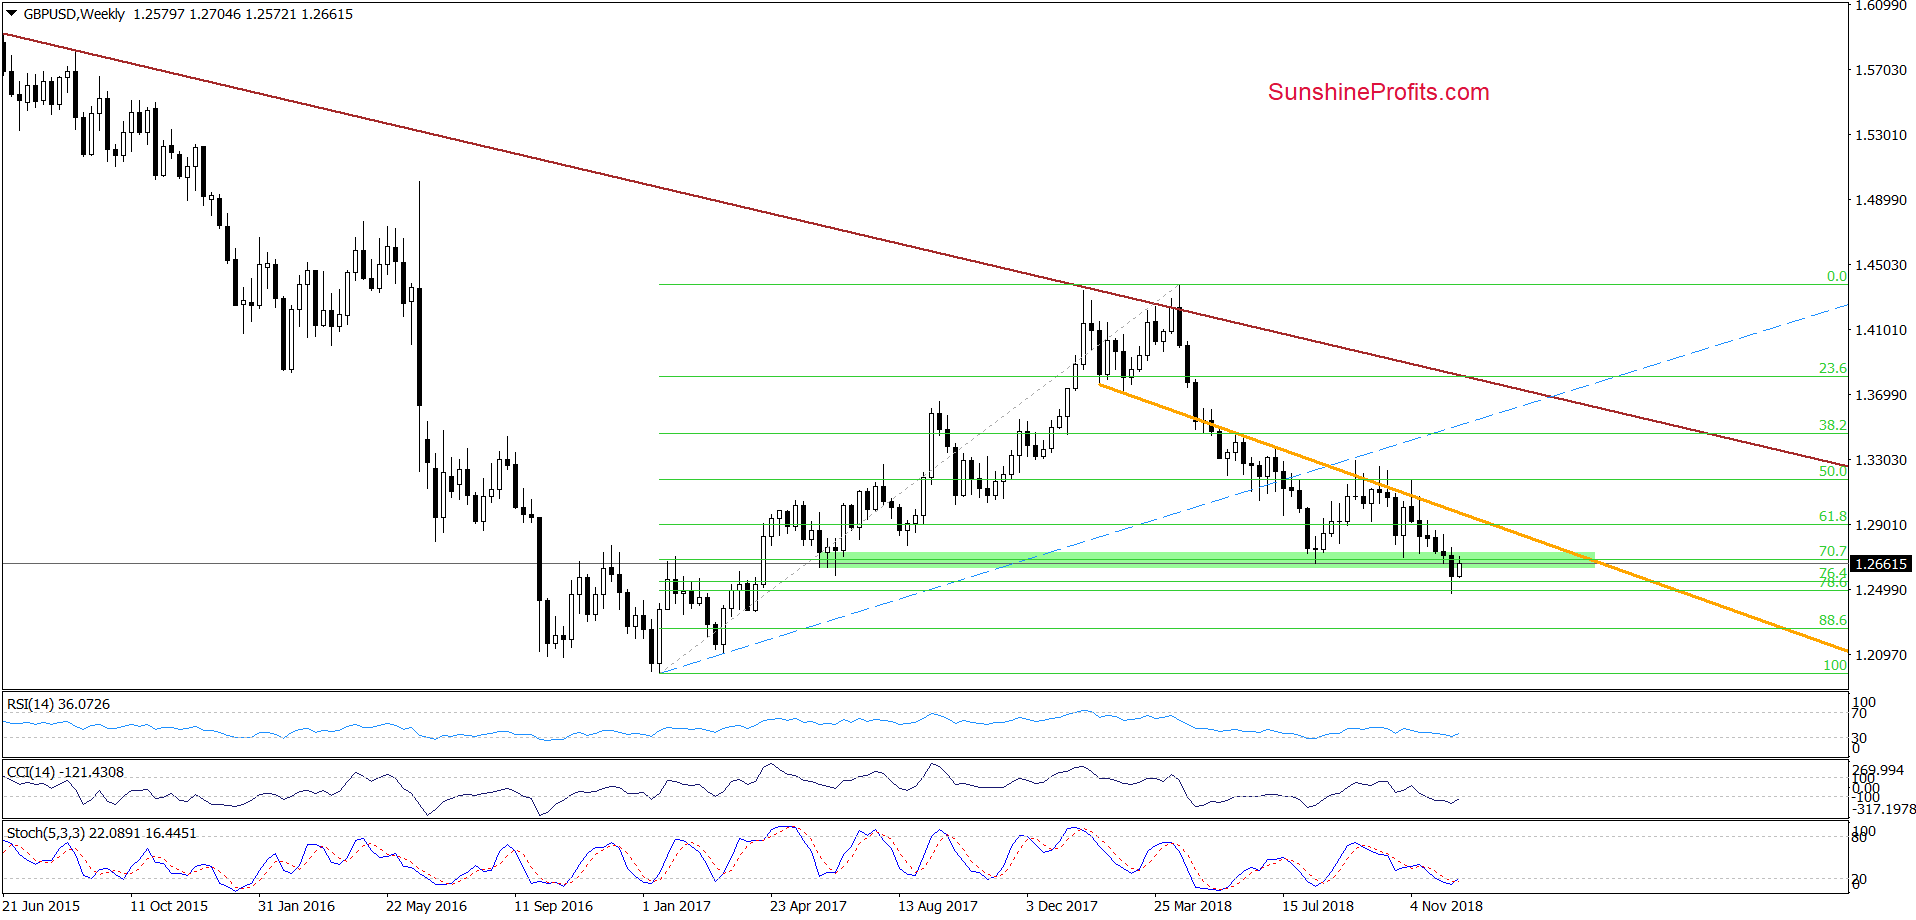
Although GBP/USD extended gains earlier this week, the overall situation in the medium term hasn’t changed much as GBP/USD is still trading under the green zone, which continues to serve as the nearest resistance.
Will we finally see a breakthrough in the near future? Let’s analyze the daily chart below and look for tips on the future of this currency pair.
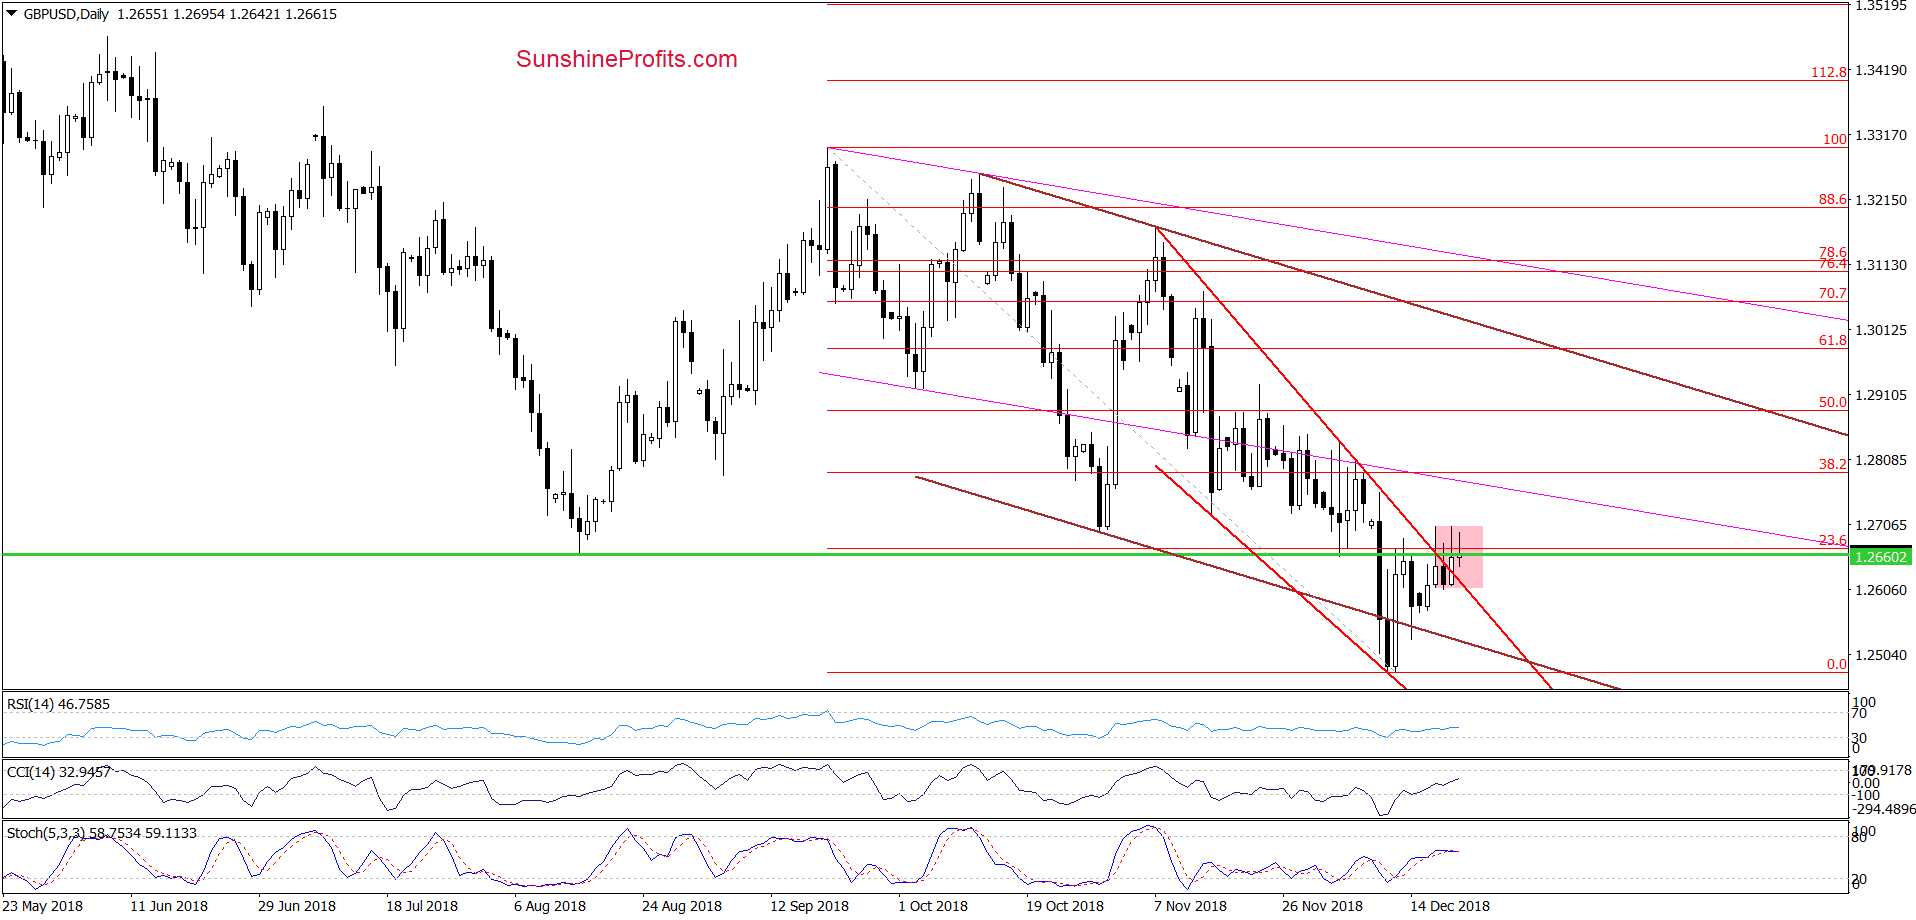
From this perspective, we see that although GBP/USD broke above the upper border of the red declining trend channel yesterday, the general very short-term situation remains almost unchanged because the bulls are stuck inside the pink consolidation created around the green horizontal line (based on the mid-August low).
What does it mean for the exchange rate?
Taking into account yesterday's positive event (the above-mentioned breakout), we should observe today a dynamic move towards the north, which would confirm the strength of the bulls. Instead, we saw a pullback, which shows that the buyers are not even able to break above the upper border of the consolidation. Such a weakness, unfortunately, doesn’t bode well for higher values of GBP/USD in the near future - especially when we add to this grim picture the proximity to the resistance zone described under the weekly chart.
However, before we cross out the bulls, we think it is worth wait for the closure of today's session. Why? If the buyers defend the lower border of the consolidation and the upper line of the red channel (broken yesterday), there is a chance for another upswing and a breakout above the consolidation in the very near future.
On the other hand, if bulls fail in the above-mentioned area and allow for another daily closure below the green horizontal line (and even worse for a drop below the previously-broken upper border of the red channel), the road to the lower line of the brown declining trend channel or even the last week’s lows will be open.
Trading position (short-term; our opinion): No positions are justified from the risk/reward perspective. We will keep you informed should anything change, or should we see a confirmation/invalidation of the above.
AUD/USD
To see more details, let’s zoom in our picture.
In our Forex Trading Alert posted on December 14, we wrote the following:
(…) What’s next for AUD/USD?
Taking into account the importance of the green zone (…), we think that the closure of today’s session will determine the fate of the currency pair.
If the buyers manage to hold it, we’ll see a rebound at the beginning of next week
Nevertheless, on Wednesday, we added:
(…) currency bulls managed to trigger a rebound, which caused an invalidation of the earlier breakdown before Friday’s closure.
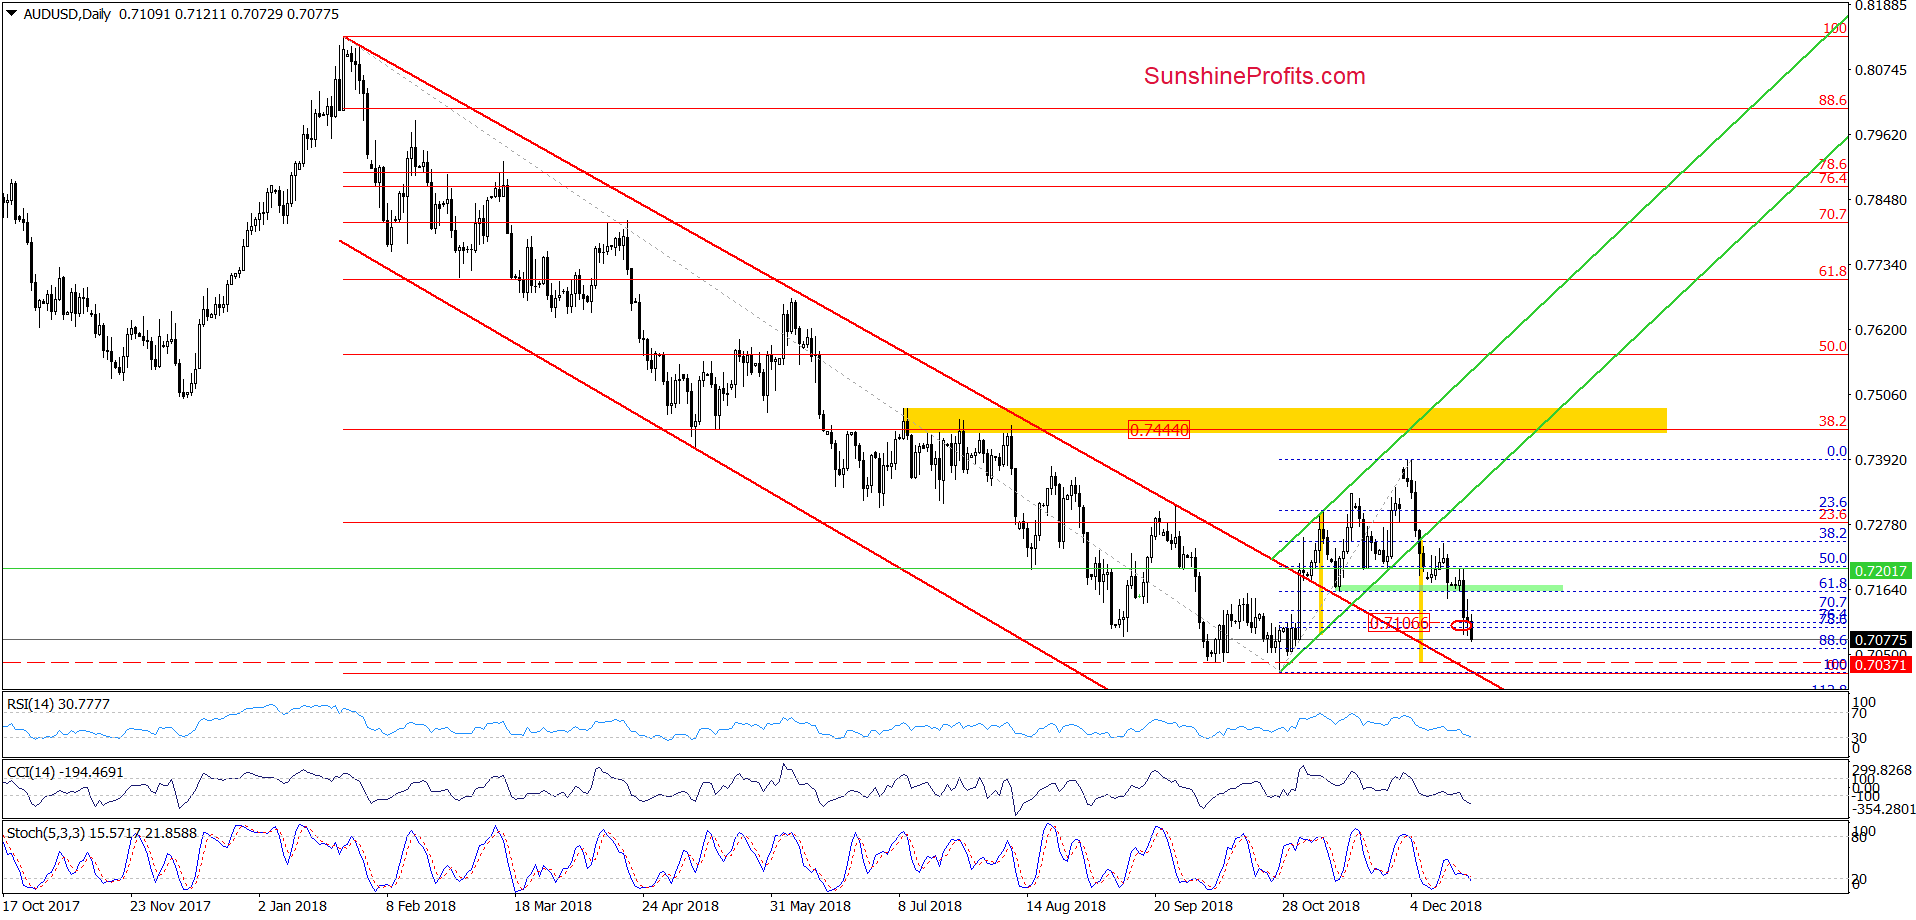
This positive event encouraged the buyers to push the pair higher in recent days, but the size of the move is currently quite disappointing as AUD/USD didn’t even reach the last week highs. Therefore, one more downswing and a test of the green zone should no surprise us in the very near future.
Nevertheless, (…) if the bulls fail and allow their opponents to break below the green zone and the last week’s low, the way to by the 76.4% and 78.6% Fibonacci retracements will likely be open.
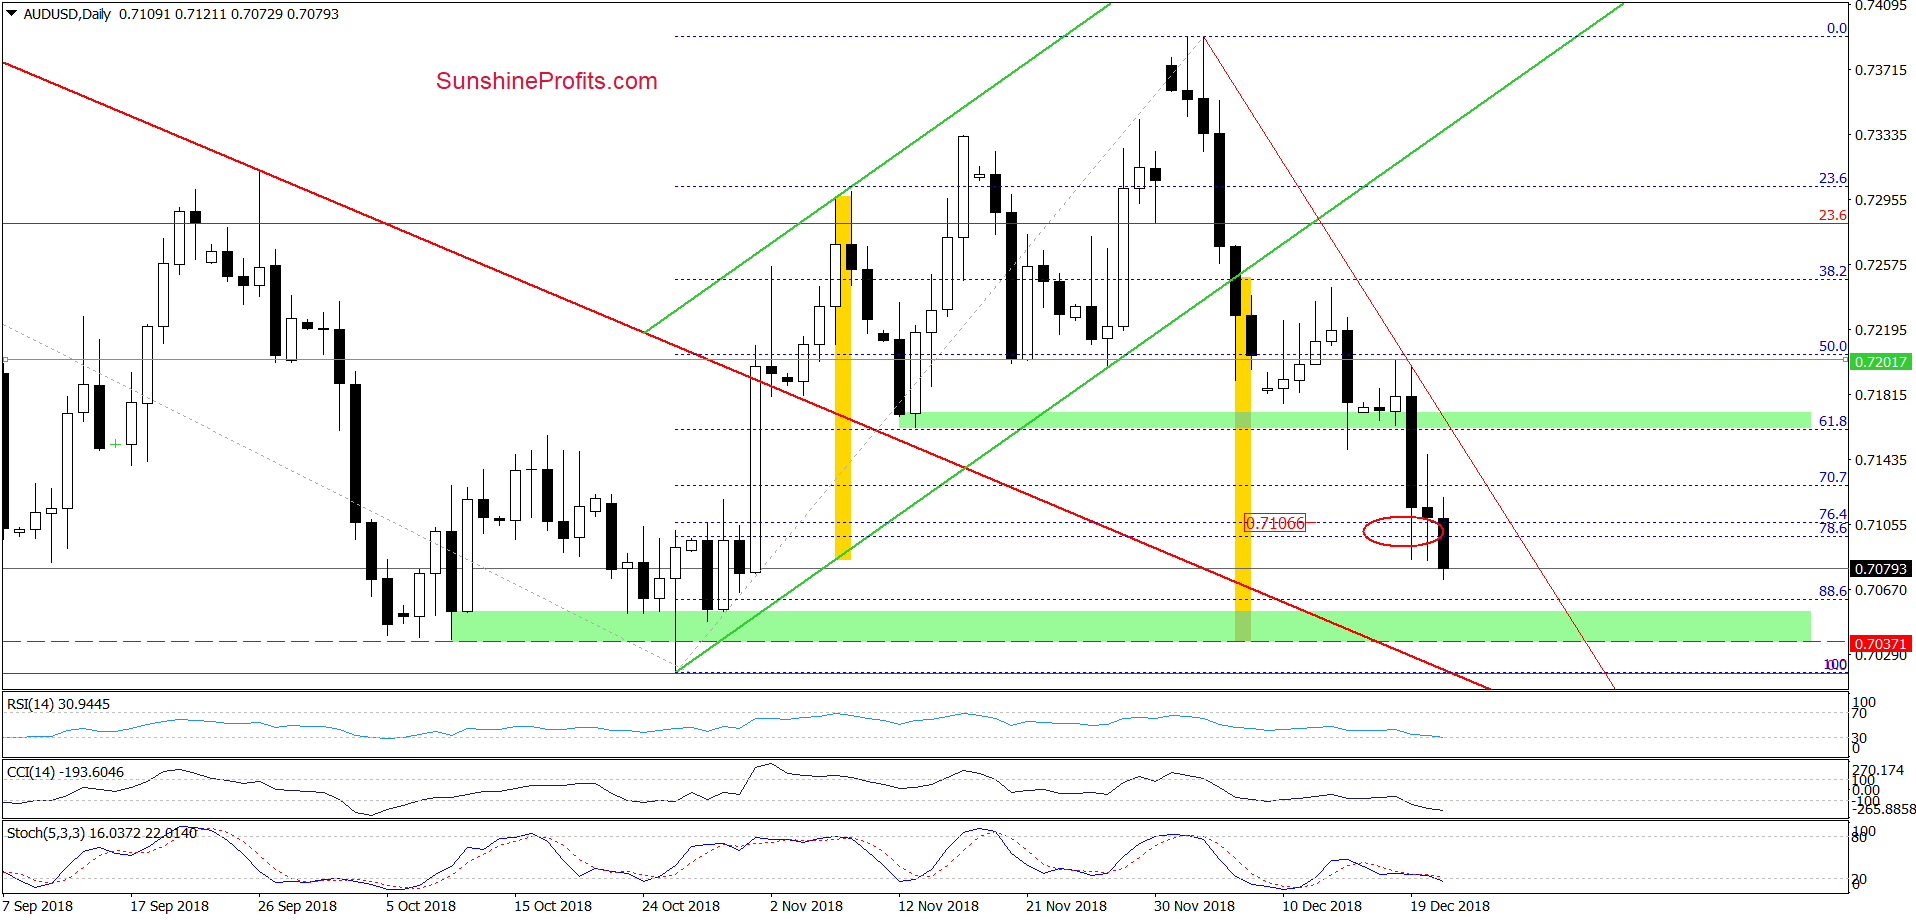
From today’s point of view, we see that the situation developed in tune with the above scenario and AUD/USD moved sharply lower in recent days. Thanks to this downward move, the exchange rate not only reached our downside target, but also broke below it earlier today.
How low can this currency pair fall?
Taking into account the breakdown under the lower border of the green rising trend channel, we think that currency bears can push the exchange rate even to around 0.7037, where the size of the downward move will correspond to the height of the formation (we marked these ranges with yellow rectangles).
What’s interesting, this is also the lower border of the nearest green support zone based on the early- and late-October lows, which suggests that currency pair may rebound from this region at the beginning of next week - especially when we factor in the current level of daily indicators (they are oversold and we can notice a bullish divergence between the Stochastic Oscillator and AUD/USD) and the proximity to the previous important low (the last 2018 low hit in October) and the upper border of the red declining trend channel broken in early November.
Trading position (short-term; our opinion): No positions are justified from the risk/reward perspective. We will keep you informed should anything change, or should we see a confirmation/invalidation of the above.
Thank you.
Nadia Simmons
Forex & Oil Trading Strategist
Przemyslaw Radomski, CFA
Founder, Editor-in-chief, Gold & Silver Fund Manager
Gold & Silver Trading Alerts
Forex Trading Alerts
Oil Investment Updates
Oil Trading Alerts

