

Yesterday’s ECB statement was indeed a market mover. This happens when the markets get truly surprised and have to recalibrate. Good that we were ready and prepared you in advance accordingly. As a result, our open profits continue to grow and on top, we have identified new profitable opportunities to act on. Time to share them with you right now.
- EUR/USD: half of earlier existing short positions (a stop-loss order at 1.1330 to protect existing profits; the next downside target at 1.1180 to give them room to grow even more – full details below)
- GBP/USD: none
- USD/JPY: short (a stop-loss order at 112.32; the initial downside target at 109.82)
- USD/CAD:long (a stop-loss order at 1.3247; the initial upside target at 1.3530)
- USD/CHF: none
- AUD/USD: none
EUR/USD
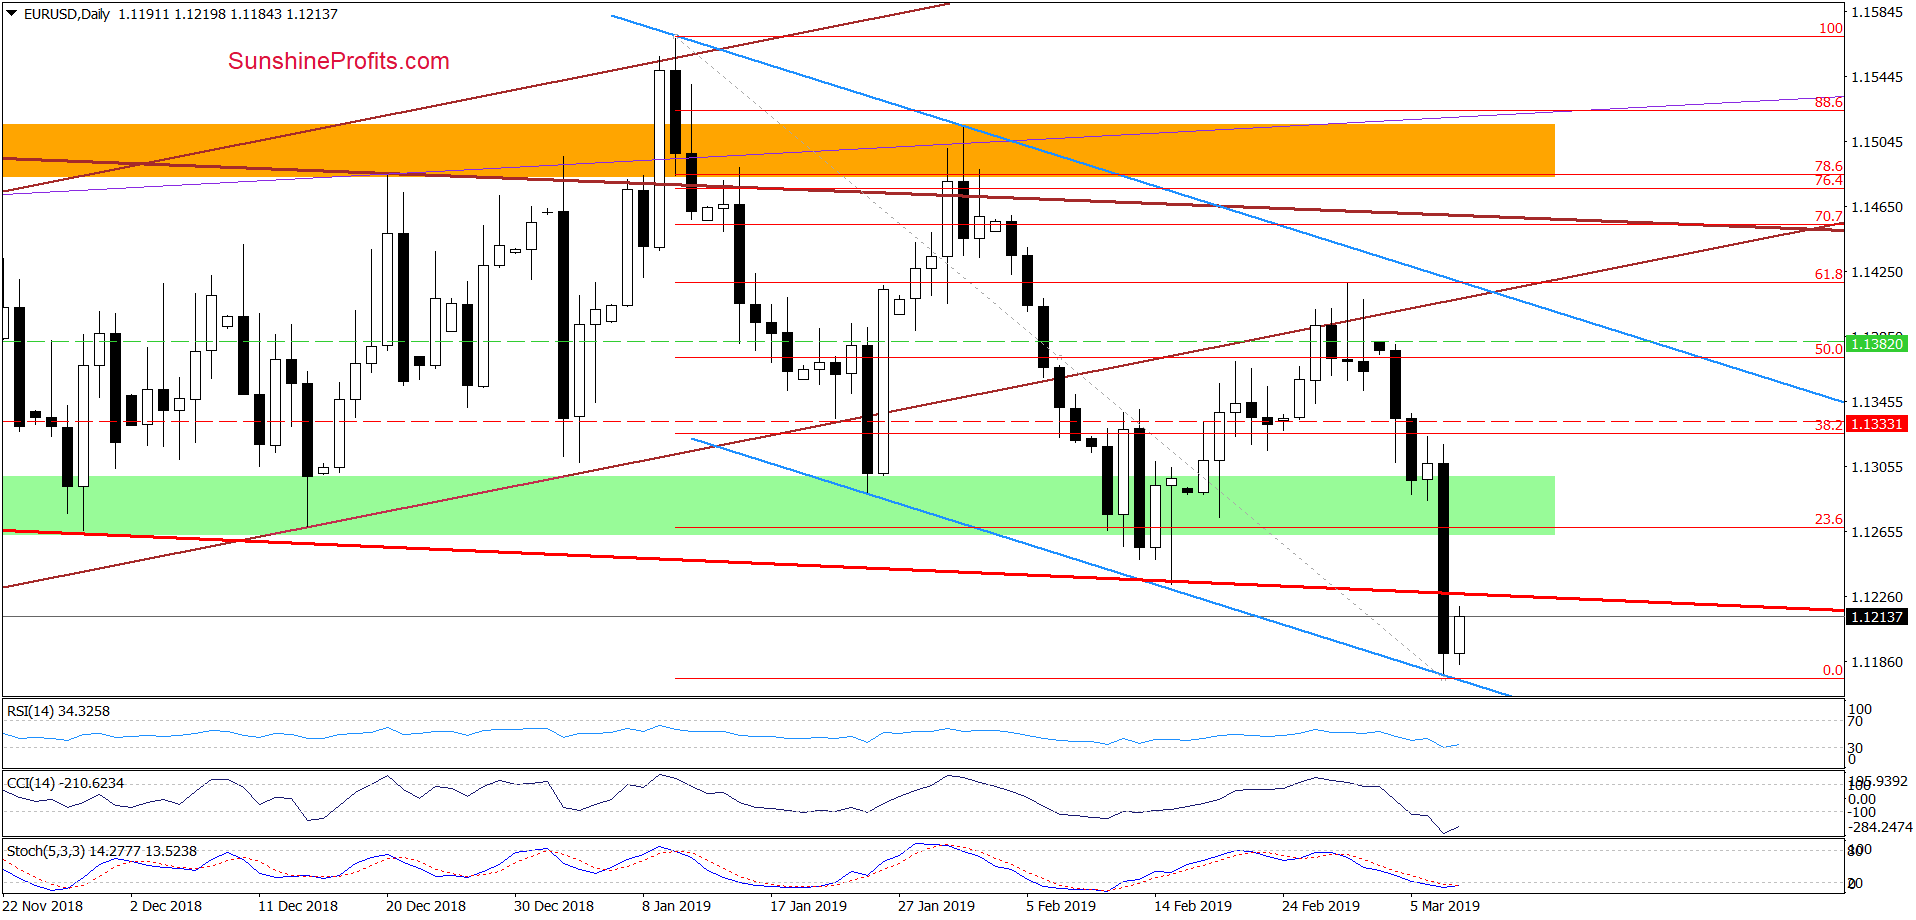
EUR/USD took a dive yesterday that took it below both the green support zone and the declining red support line. The exchange rate also crashed below the mid-November 2018 lows.
The pair almost touched the lower border of the blue declining trend channel, which triggered a small rebound earlier today. However, this is still below the red support line, which suggests that today’s upswing could only be a verification of yesterday’s breakdown below it.
If today’s move is indeed only a verification, we’ll likely see a retest of yesterday’s lows followed by a trip to the lower border of the blue channel.
Let’s check the weekly outlook now.
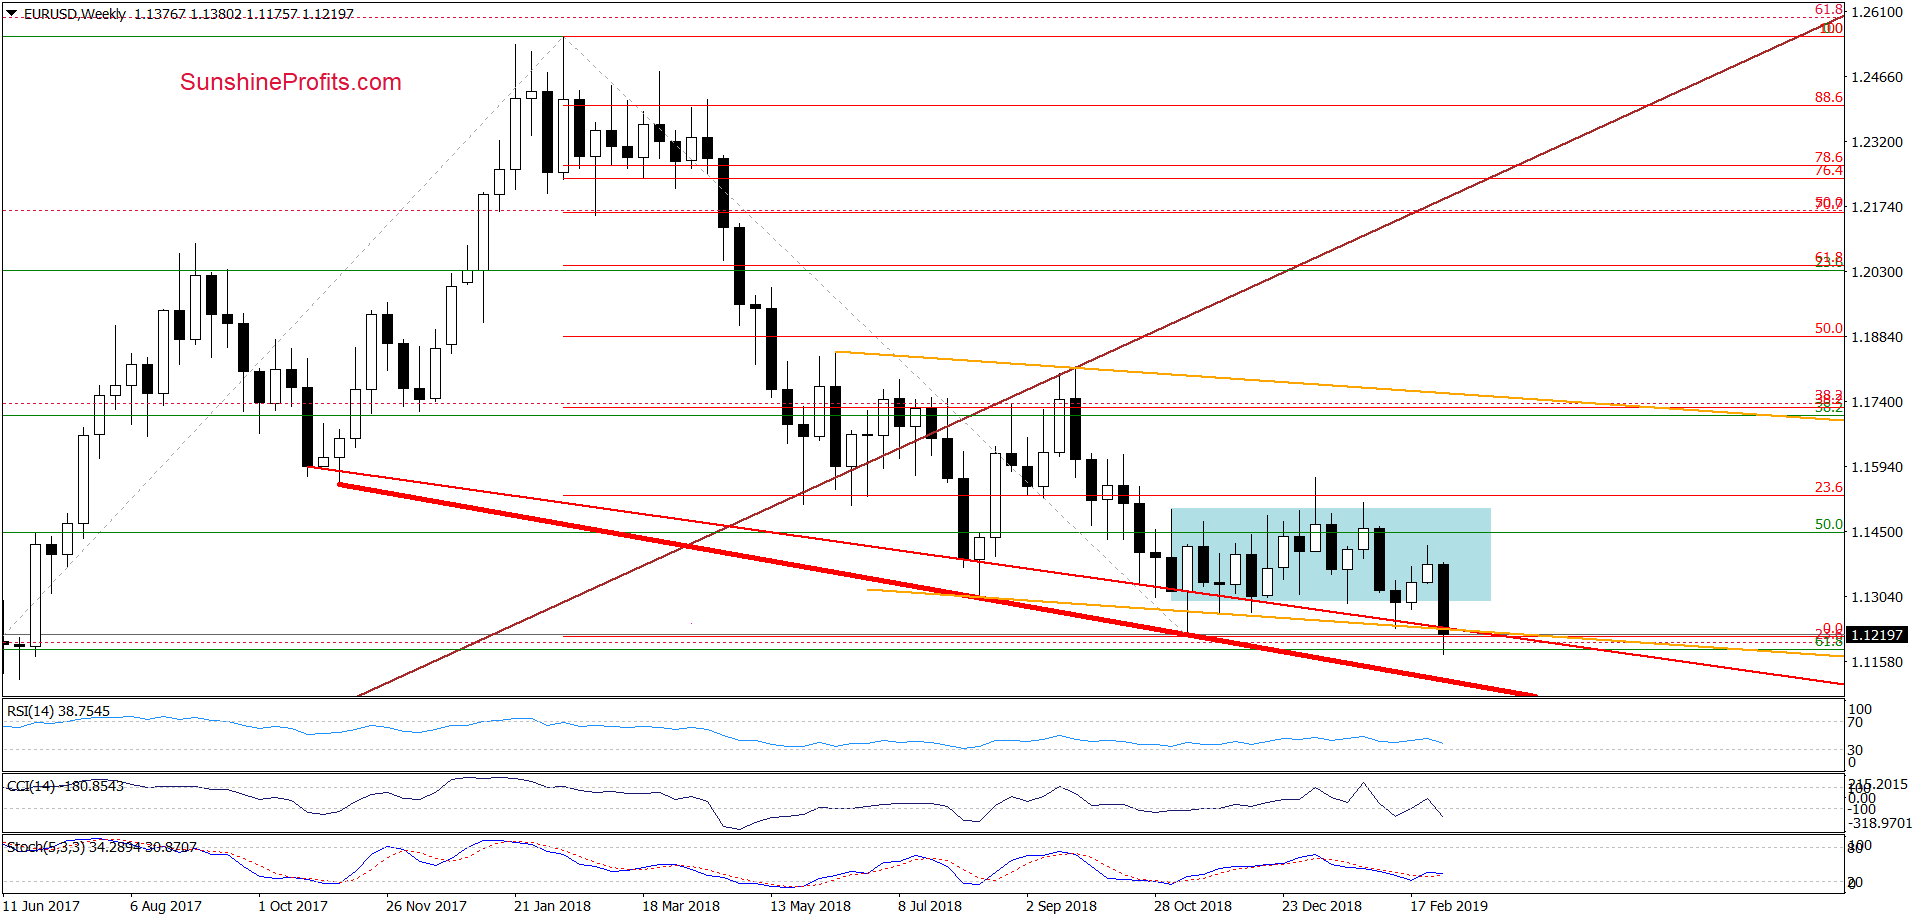
Higher-timeframe perspective shows that EUR/USD is currently trading below the lower border of the medium-term red declining trend channel that you can see marked with orange lines on this weekly chart. We see nothing in this chart that would preclude another move to the downside per se.
Finishing today’s commentary on this currency pair, we would like to add that we decided to move the stop-loss order lower once again to protect an even larger portion of the existing profits. Additionally, we also lowered our next downside target. All needed details you will find below.
Trading position (short-term; our opinion): profitable half of earlier existing short positions with a stop-loss order at 1.1330 and the next downside target at 1.1180 are justified from the risk/reward perspective.
USD/JPY
On Wednesday, we wrote:
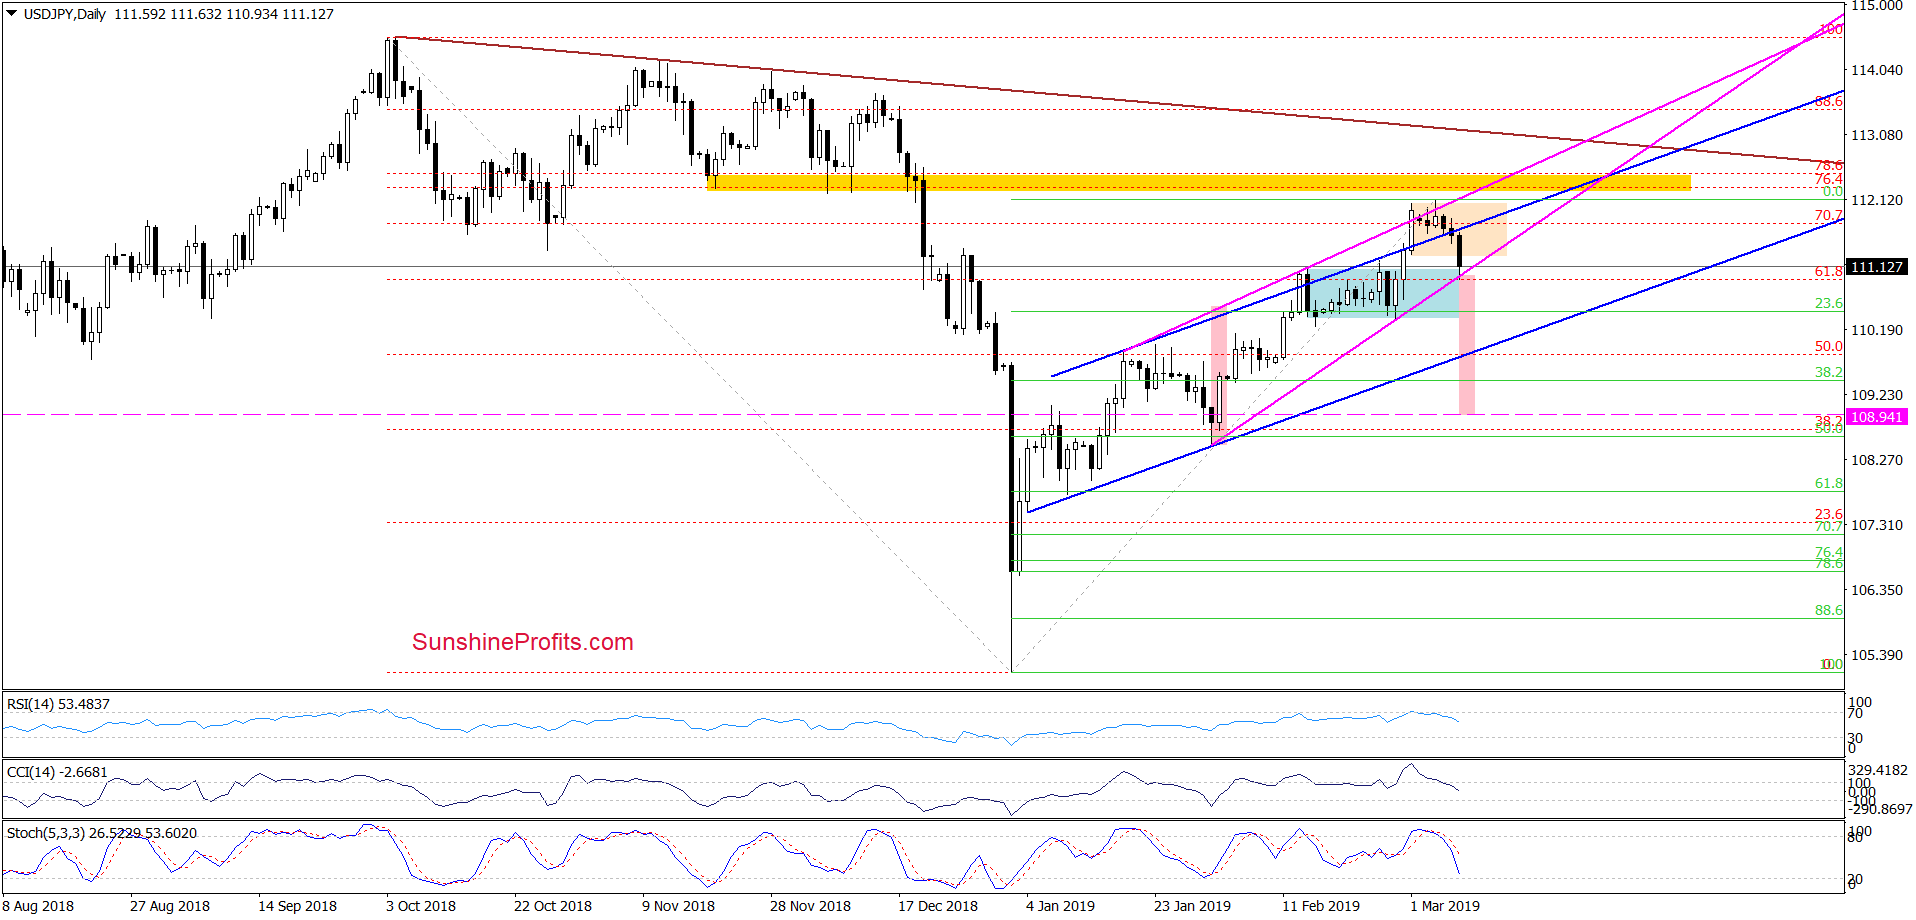
(…) Let’s take a close look at the position of the daily indicators. Their sell signals just generated suggest that we won’t likely have to wait long for a corresponding price reversal.
If we see an invalidation of the breakout above the upper border of the blue rising trend channel, we’ll consider opening short positions.
Our gameplan turned out to be the right one. The pair invalidated the breakout above the upper border of the blue rising trend channel while breaking below the orange consolidation. It has now pierced the previous blue consolidation and the lower border of the pink rising wedge to trade at around 110.90 at the moment of writing these words.
Additionally, daily indicators’ sell signals continue to support the sellers. Should we see a drop below the above mentioned support levels, a decline to at least the lower border of the blue rising trend channel (currently around 109.80) remains on the table. Considering the size and shape of the pink wedge, currency bears can push USD/JPY to around 109.94.
Taking all the above into account, we think that opening short positions is justified from the risk/reward perspective. All details below.
Trading position (short-term; our opinion): Short positions with a stop-loss order at 112.32 and the initial downside target at 109.82 are justified from the risk/reward perspective.
USD/CAD
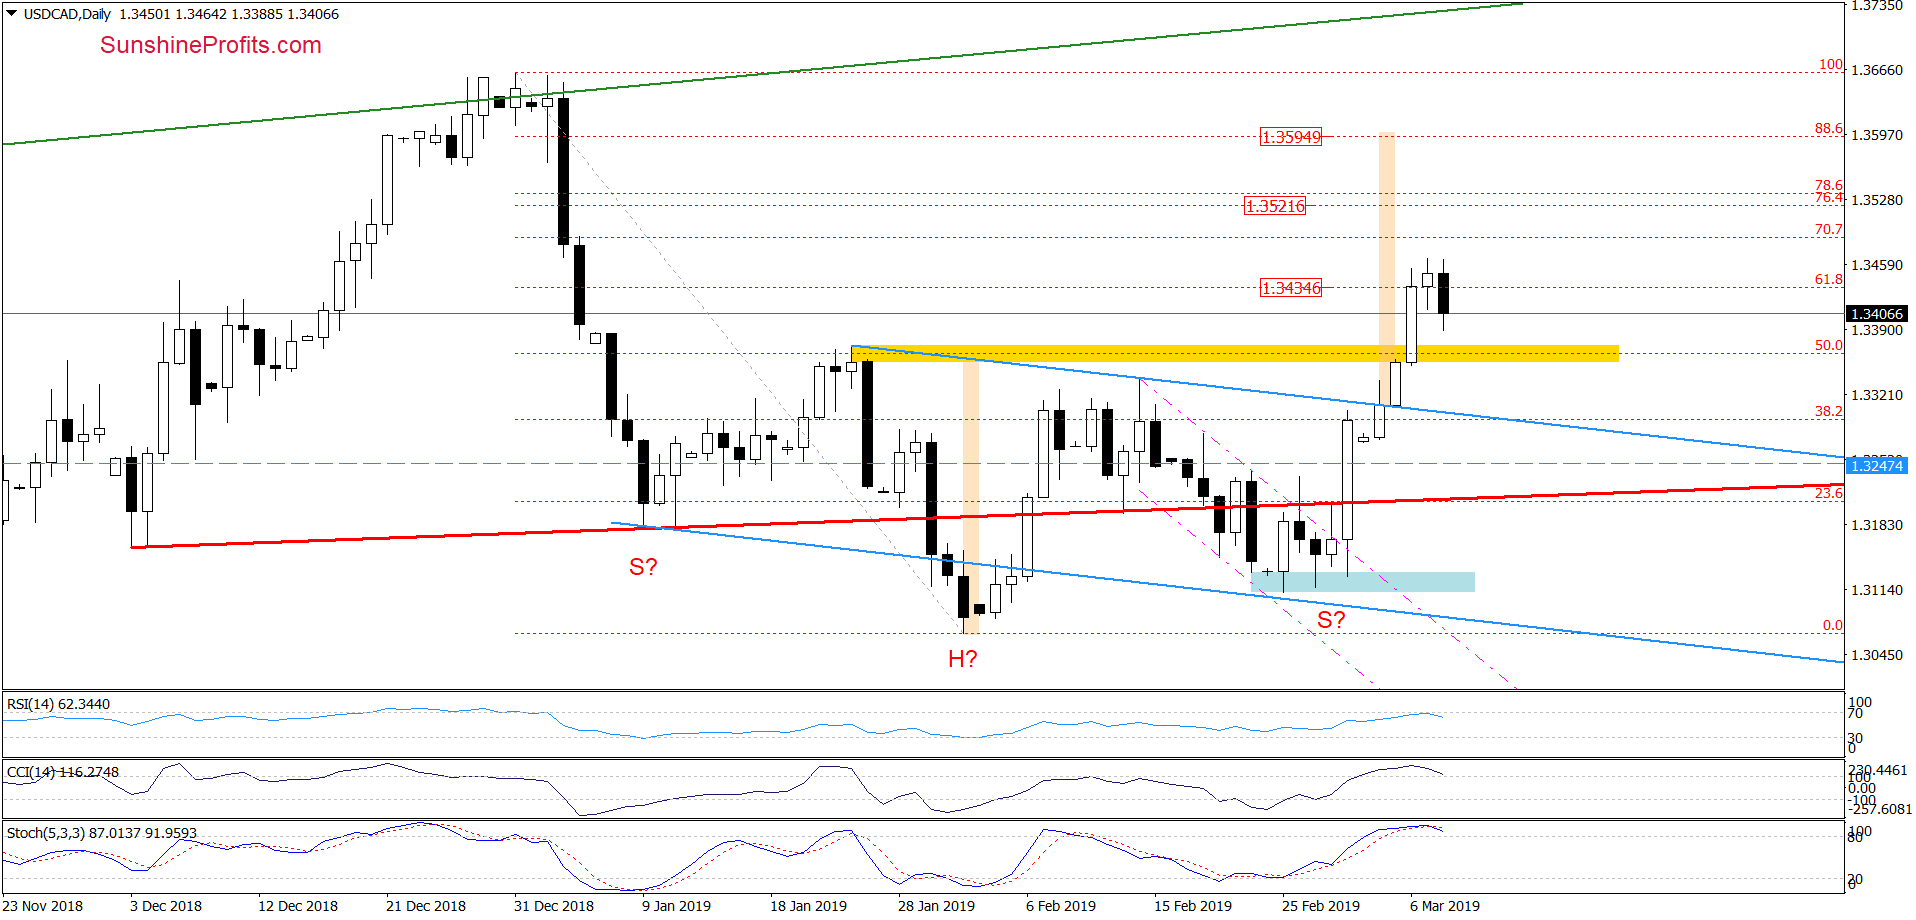
Also on Wednesday, we discussed the reverse head and shoulders formation that had turned into a formation in effect:
(…) USD/CAD indeed broke above the blue resistance line. And it means that it broke above the neck line of the reverse head and shoulders which is now an active formation carrying implications. It also broke above the yellow resistance zone, which also suggests further price improvements.
USD/CAD extended gains well above the yellow resistance zone and closed yesterday’s session comfortably above the 61.8% Fibonacci retracement. Earlier today, we saw a pullback, which could be nothing more than a verification of the earlier breakout above the yellow resistance zone.
As long as there is no invalidation of the breakout above it, another upswing can’t be ruled out in the least. We will keep you informed should anything change, or should we see a confirmation/invalidation of the above.
Trading position (short-term; our opinion): Long positions with a stop-loss order at 1.3247 and the initial upside target at 1.3530 are justified from the risk/reward perspective.
Thank you.
Nadia Simmons
Forex & Oil Trading Strategist

