
Based on the May 3rd, 2013 Premium Update. Visit our archives for more gold articles.
We haven’t touched on currencies for quite some time (our latest essay was dedicated entirely to gold: Gold Price in May 2013) now but last time we did, we mentioned the long-term breakout in the USD Index, which at that time was starting to take shape, but as the time wore on it became more and more significant. This is why in today’s essay we’ll focus mostly on the U.S. currency, review its current technical situation and its implications for gold and silver. Let us then jump straight into the chart analysis – we’ll start with the very long-term chart where the breakout is most clearly visible (charts courtesy by http://stockcharts.com.)
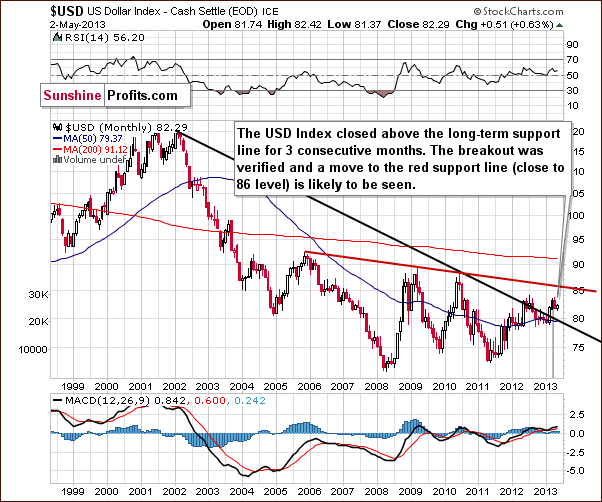
The index has actually confirmed a breakout above the very long-term resistance line. It has closed above it now for three consecutive months (yes, months). While a correction to the 80 level is still possible in the short term, an eventual move to the upside is now more likely than not. The closest target level seems to be slightly above 85 and although the 90 level could be in the cards as well, for now, we will focus on the first target level at this time.
The situation in the United States has not improved dramatically and the value of the dollar will have to go down eventually because of the massive amounts thereof that were created in the recent months and years. However, please remember that the USD Index is a weighted average of currency exchange rates, so if other currencies depreciate faster relative to tangible assets such as gold, the USD Index could actually rally. Another possibility is if the US situation is bad but it is worse everywhere else, the index could also rally. Anyway, the above chart suggests the USD index will move higher in the weeks ahead, though not necessarily immediately.
Let us move on to the medium term now.
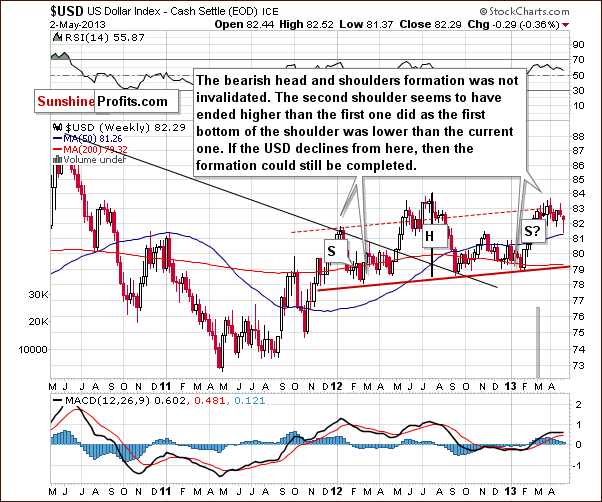
In this chart, the picture is not as clear. The bearish head-and-shoulders formation could still be completed here, but the index would need to move below 79 and then hold this breakdown. If it moves above 84, the bearish pattern would be invalidated. Since the long-term picture is more important and carries greater weight than the medium and short-term outlooks, it is more probable that a rally will be seen, although this may not happen right away.
Finally, let’s zoom in even further and see how the short-term situation looks like.
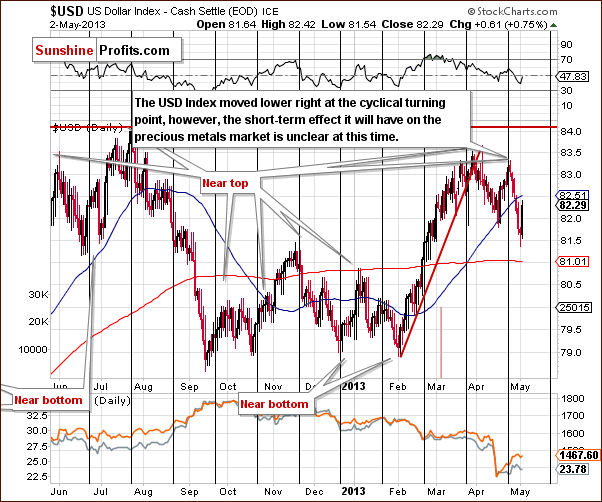
In the short-term USD Index chart, we see that the index declined immediately after the cyclical turning point. A sharp move lower has been seen over the past few days, though this did reverse on an intra-day basis on Thursday (perhaps forex traders acted on the bullish 3-month confirmation of the long-term breakout). This could in fact be a reversal, as moves to the upside appear possible now. It is, however, a bit unclear at this time. What should have happened due to the bearish impact of the cyclical turning point has probably already been seen. All-in-all, the situation is unclear for the short term.
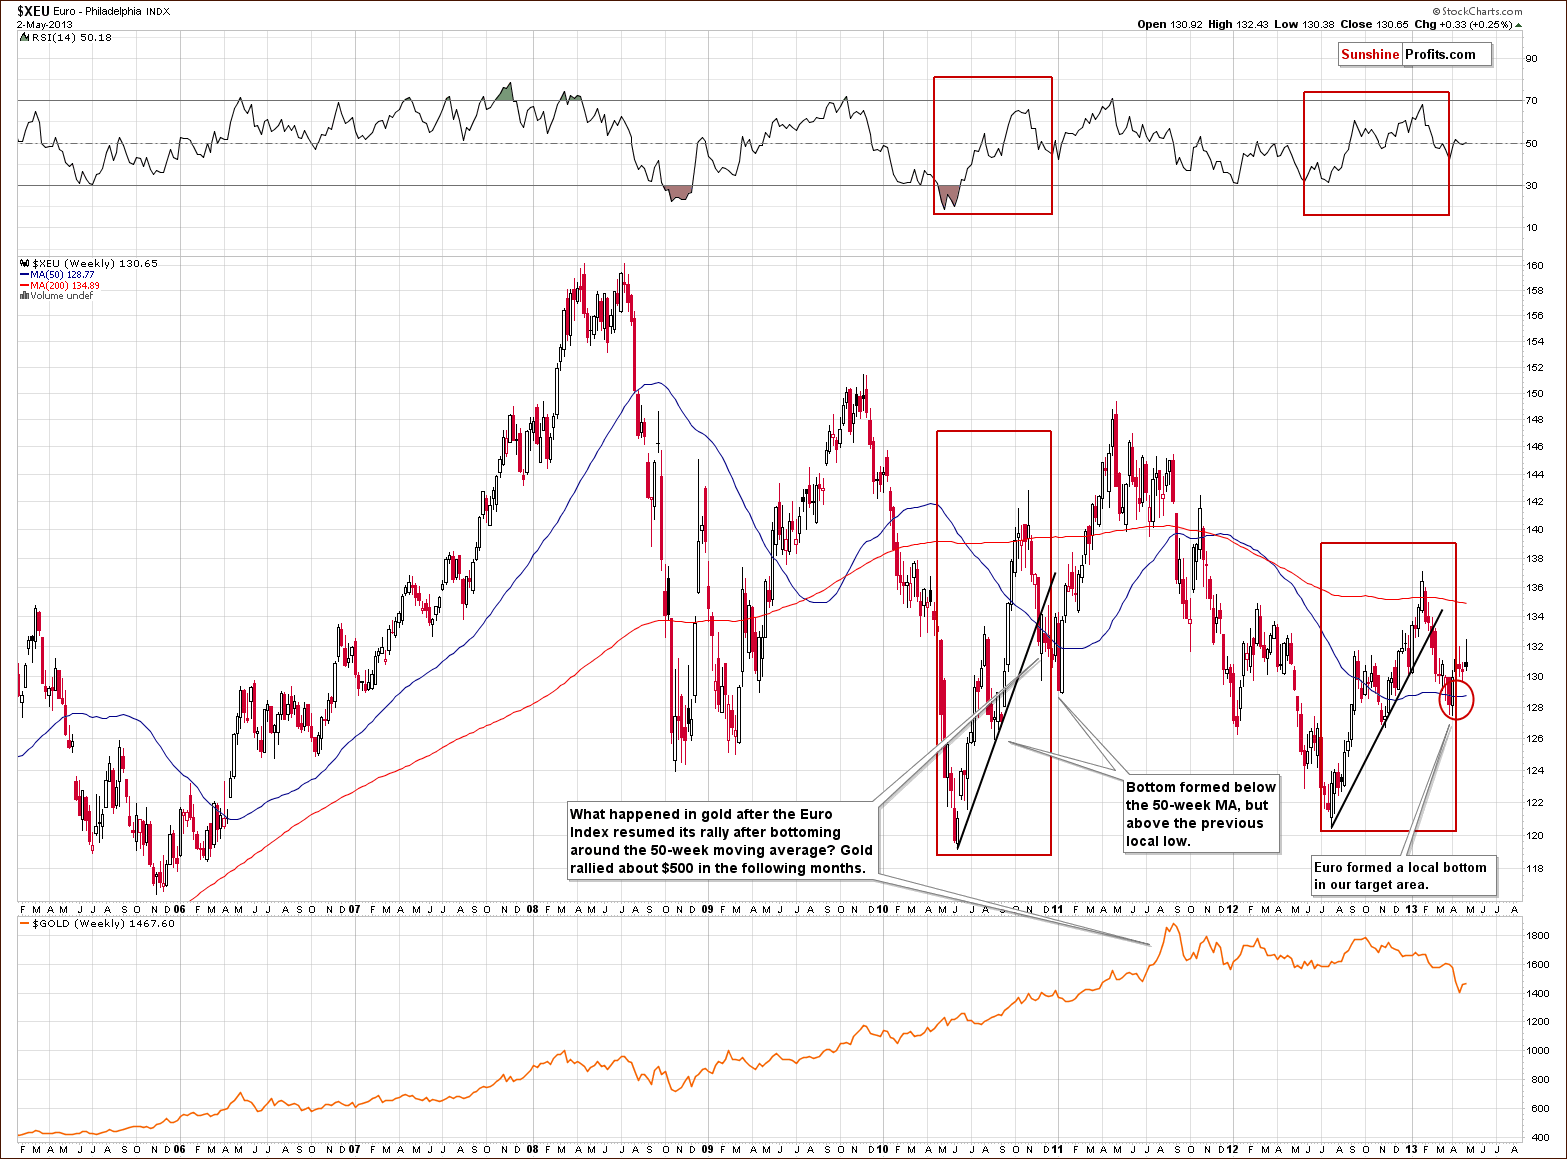
In the long-term Euro Index chart, we see that the index bottomed within our target area and then moved higher. What’s ahead for the Euro Index is a bit unclear right now. An analogy to previous patterns suggests a move to the upside here.
With respect to gold, previous similar Euro Index trading patterns (such as in late 2010) coincided with gold moving lower initially and then rallying strongly (note the decline in late 2010 and early 2011). It seems that gold could once again move lower before rallying significantly.
Now, let’s take a look at the intermarket correlations to see how the situation in currencies may translate into the precious metals market.
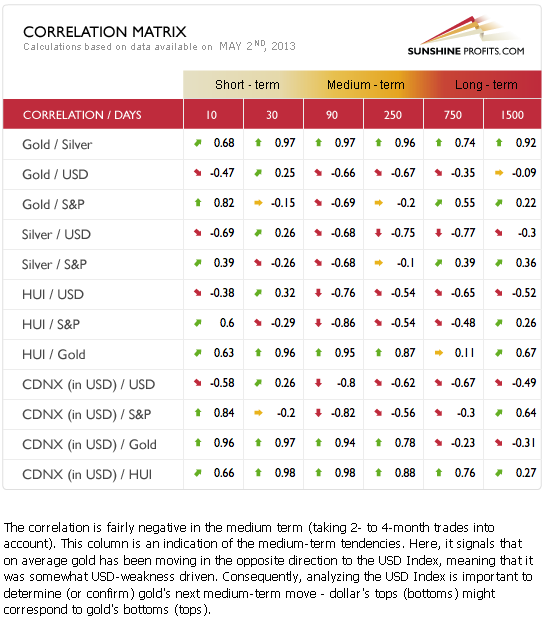
The Correlation Matrix is a tool which we have developed to analyze the impact of the currency markets and the general stock market upon the precious metals sector, (namely: gold correlations and silver correlations). The short-term impact on the precious metals by other markets has been very unclear. On a medium-term basis, the impact from the currency markets is negative. The final bottom for gold, silver and the mining stocks may very well be ahead. In the long run, the effect of these other markets is close to zero, and we expect the secular bull market for precious metals to continue even though the rally may not be seen right away.
Summing up, the long-term outlook for the USD Index is now bullish, and this could damage the precious metals markets, at least temporarily. The very long-term correlations between the dollar and the precious metals have been pretty non-existent. A medium-term impact will likely be seen however if the USD Index rallies (expect “there was no bull market in gold, only the bear market in the dollar which just ended” and similar comments – look at the non-USD gold chart for proof that there was much more to gold’s rally than dollar’s decline). The metals will probably respond negatively at first, and then go along with their main secular trend, which is to the upside.
Thank you for reading. Have a great weekend and profitable week!
Sincerely,
Przemyslaw Radomski, CFA
PS. Our subscribers have been profiting during these turbulent times and are profiting on today's decline as well. We encourage you to join them and get to know our detailed downside targets and trading plan.
Back