
Based on the December 4th, 2013 Premium Update. Visit our archives for more gold articles.
The precious metals sector was weak in the previous weeks and it remains weak today as well. Gold, silver, and – to some extent – mining stocks rallied on Wednesday and many investors and traders were led to believe that the worst was over. It wasn’t, and mining stocks told us so. Gold stocks (the HUI Index) moved below Monday’s lows, not to mention that they also remained below their previous 2013 lows and the psychologically important 200 level.
Is the outlook as bearish for gold as mining stocks suggest? Let’s take a look (charts courtesy of http://stockcharts.com).
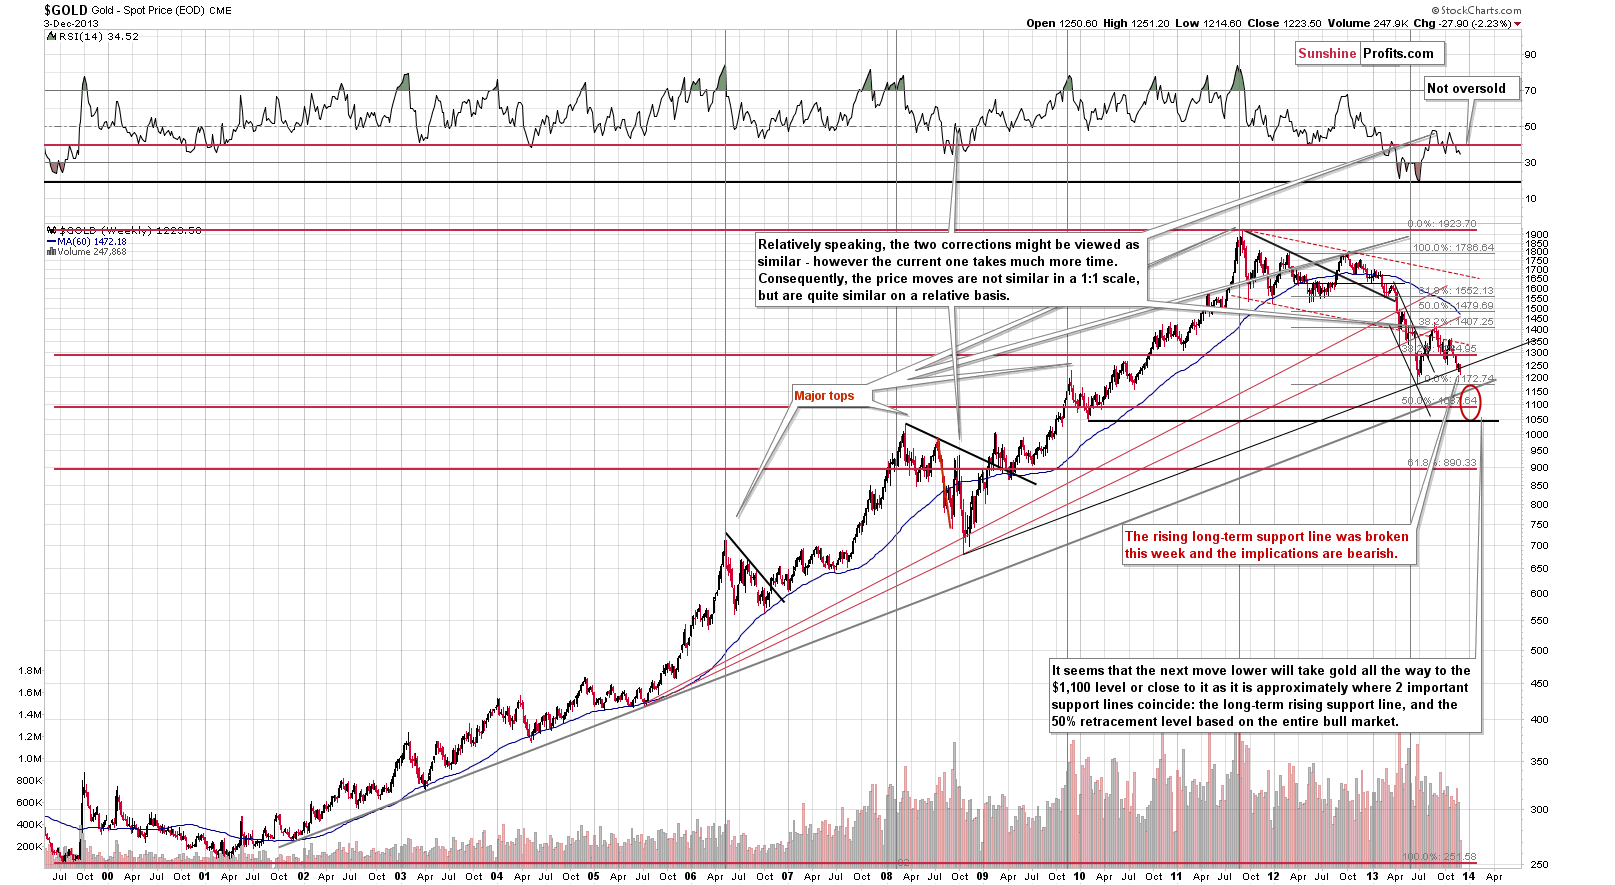
Earlier this week, we saw a major change on the above chart as gold broke below the rising long-term support line. It moved back up on Tuesday, but declined once again on Wednesday.
The implications are bearish, especially that the RSI indicator is currently not oversold – it’s above 30 and well above its previous 2013 lows. Back in 2008, the RSI indicator moved close to its previous lows when the final bottom was in. In this case, we would need to see much lower gold prices to have RSI close to the 20 level.
The next stop for gold is at its 2013 low, slightly above $1,170. It seems to us, however, that this will not be the final bottom for this decline, we expect the final one to form close to $1,100, possibly even at $1,050.
Let’s take a look at the chart featuring gold’s price from the non-USD perspective.
From the non-USD perspective, we saw a breakdown below the rising support line and below the previous 2013 low. As mentioned previously, the breakdown was invalidated on Wednesday, but gold moved below this level once again on Thursday and the implications are bearish.
Not only is the medium-term trend down, but the pace of the decline might accelerate in the coming days/weeks based on this breakdown.
Speaking of breakdowns, let’s see how the above breaks down into individual currencies (the non-USD gold price is the average of several gold prices expressed in currencies other than the USD).
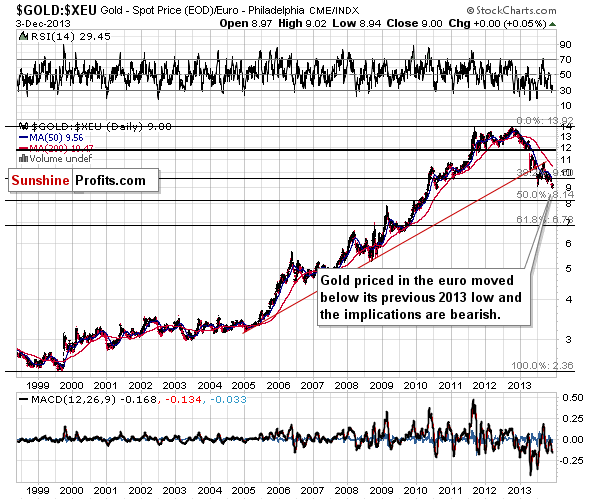
This week we finally saw a breakdown in the case of gold seen from the European perspective. Gold closed below the previous 2013 low and the implications are bearish. We saw 2 consecutive closes below this level, and if we see the third one, we will have a verification of the breakdown with much more bearish implications.
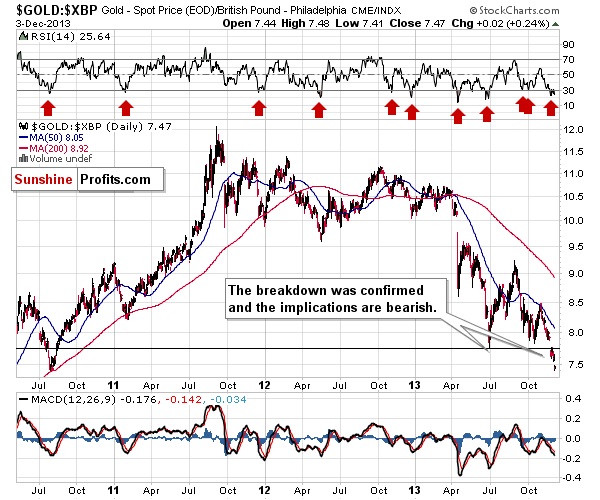
Generally, what we wrote last week about gold priced in the British pound remains up to date:
It moved below its 2013 lows, which is a bearish factor, and the breakdown was verified by 3 consecutive closes below this level, which is even more bearish. The RSI indicator is currently below the 30 level, which means that a correction is quite likely to be seen soon, but based on the confirmation of the breakdown, it seems that it could start at much lower prices (meaning after a quick decline).
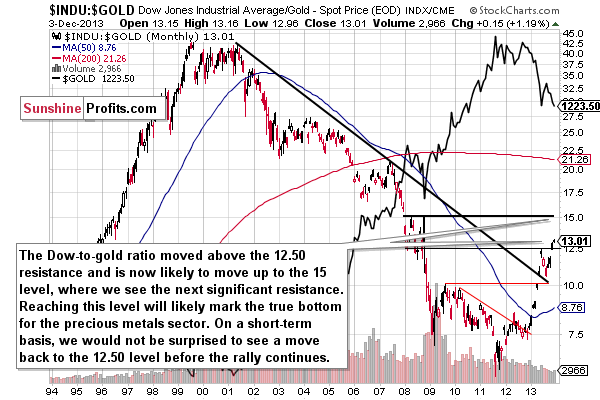
Last but definitely not least, we would like to discuss the Dow-to-gold ratio. That’s one of the most important and useful ratios there are as far as long- and medium-term trends are concerned. In particular, the big price moves can be detected before they happen (note the breakout in the first months of the year that heralded declines in gold).
We saw a breakout above the 12.5 level 2 weeks ago and shortly thereafter we wrote that:
(…) with the ratio even higher today, we have a good possibility that the breakout will be confirmed and that we will see a big drop in the price of gold in the coming weeks or months.
The ratio moved even higher last week and it’s currently at 12.92. However, given the sharpness of the most recent move up, we wouldn’t be surprised to see a correction to the previously broken 12.50 level before the upswing continues. It does not have to happen, though. Please note that at the beginning of the year, the breakout above the declining resistance line was not followed by a verification – the ratio soared without it.
Summing up, the medium-term outlook for gold has deteriorated recently and it remains bearish. Mining stocks seem to be leading gold lower and gold appears to be following in their footsteps, even if that doesn’t happen right away.
If you'd like to read the full version of today's analysis along with our current trading suggestions, please subscribe to the Premium Service.
Thank you.
Przemyslaw Radomski, CFA
Back