
Since the beginning of the month the situation in the crude oil market has been unclear and, from today’s point of view, can be compared to the rollercoaster. The price has been moving a little in one direction fueling hopes for a breakout or breakdown and a trading opportunity only to move back the following day. Although crude oil extended losses in the previous week, losing 0.28% and hitting a fresh multi-month low of $96.55, the commodity still remains slightly above 2 strong support levels: the rising, long-term support line and the 200-week moving average. Will light crude go north from here? Is it possible that the final bottom of the current correction behind us? Before we try to answer these questions, we’ll examine the oil-stocks-to-oil ratio and take a closer look at the non-USD chart of crude oil (charts courtesy by http://stockcharts.com).
Let’s start today’s essay by focusing on the oil-stocks-to-oil ratio. What impact could it have on future oil moves? Let’s check.
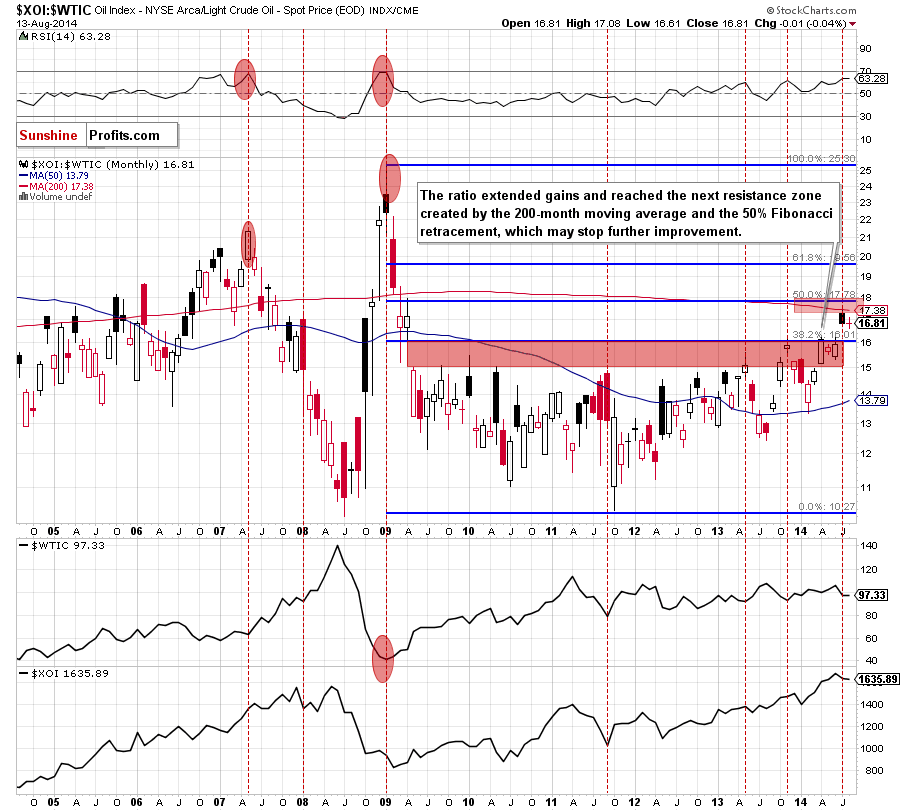
From this perspective, we see that the ratio succesfully broke above the 38.2% Fibonacci retracement, closing the gap that we saw in 2009. This strong bullish signal triggered further improvement and the ratio extended gains in the previous month. With this upswing, the ratio reached the resistance zone created by the 200-month moving average and the 50% Fibonacci retracement. As you see on the above chart, this strong resistance paused further improvement, which means that if the local top is already in, we may see a correction from here to the previous highs. What does it mean for crude oil? Many times in the past, the local tops in the ratio have corresponded to the local botoms in the commodity. We saw such situation in Jan. 2009, Sept. 2011, May 2013 and Nov. 2013. Therefore, since the history tends to repeat itself, it seems likely to us that we will see a similar situation in the coming month.
Will the medium-term picture give us more clues? Let’s check.
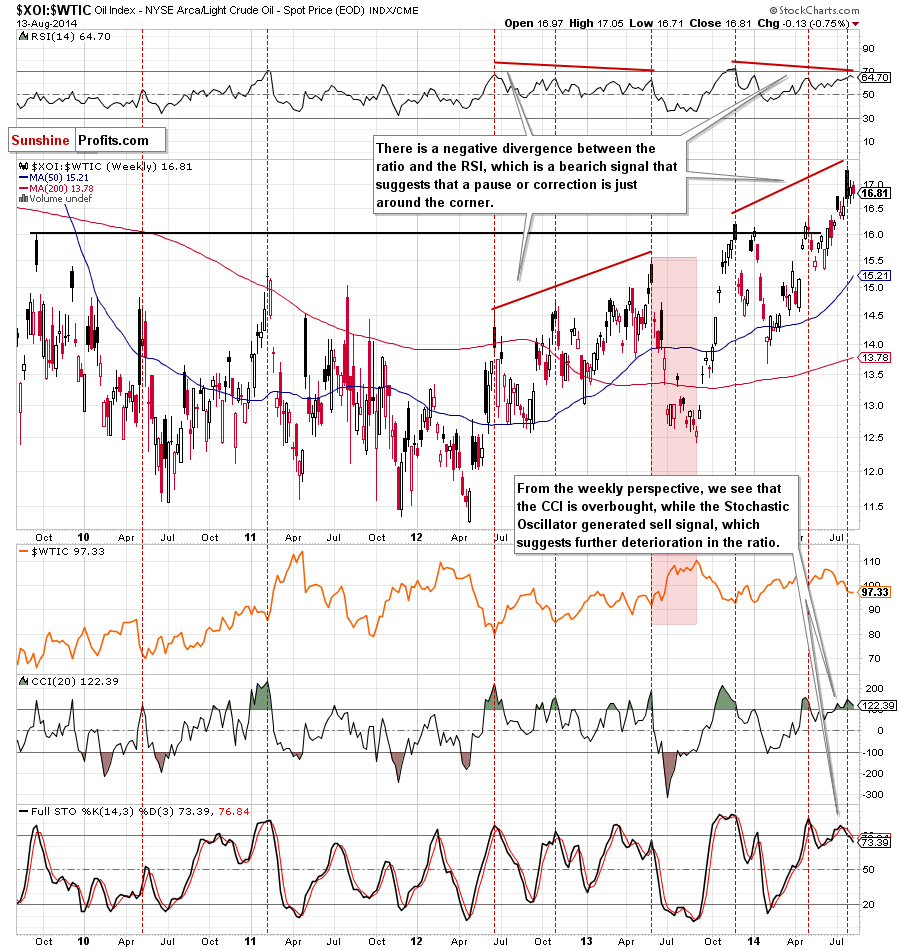
The first thing that catches the eye on the above chart is a strong negative divergence between the RSI and the ratio. When we take a closer look at the chart, we notice that there was a similar situation between the June 2012 and May 2013 highs. Back then, such strong negative divergence preceded a sharp decline in the ratio, which translate to higher values of crude oil. As we mentioned earlier, it seems to us that a bottom of the correction in crude oil is just around thecorner. Please note that the current position of the CCI and Stochastic Oscillator (they are both overbought and the latter generated a sell signal) also reinforced the above-mentioned bearish scenario for the ratio and bullish for crude oil.
Once we know the above, let’s take a look at the non-USD (WTIC:UDN ratio) chart of crude oil. As a reminder, UDN is the symbol for the PowerShares DB US Dollar Index Bearish Fund, which moves in the exact opposite direction to the USD Index. Since the USD Index is a weighted average of the dollar's exchange rates with world's most important currencies, the WTIC:UDN ratio displays the value of crude oil priced in "other currencies".
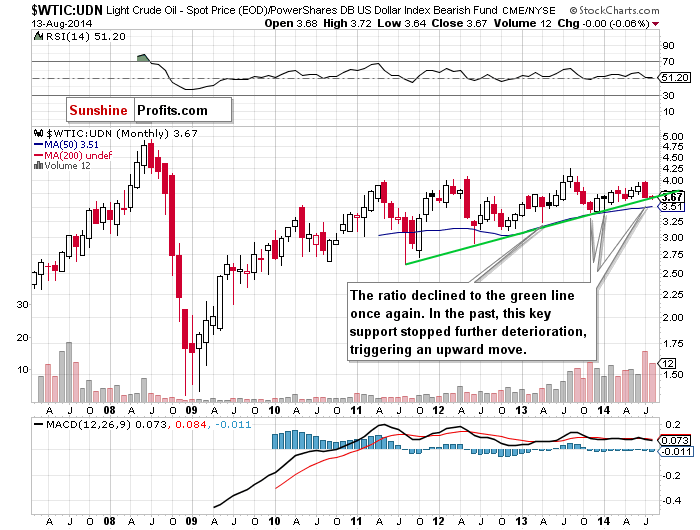
From the monthly perspective, we see that the ratio reached the key support line once again. As you see on the above chart, many times in the past this green line stopped further declines, triggering an upward move. We saw such price action in June 2012, April, November and December 2013 and also at the beginning of the year. Therefore, since the history tends to repeat itself, we think that we’ll see a rebound from here in the coming month, which will also correspond to higher values of crude oil priced in U.S. dollars.
Can we infer something more from the weekly chart?
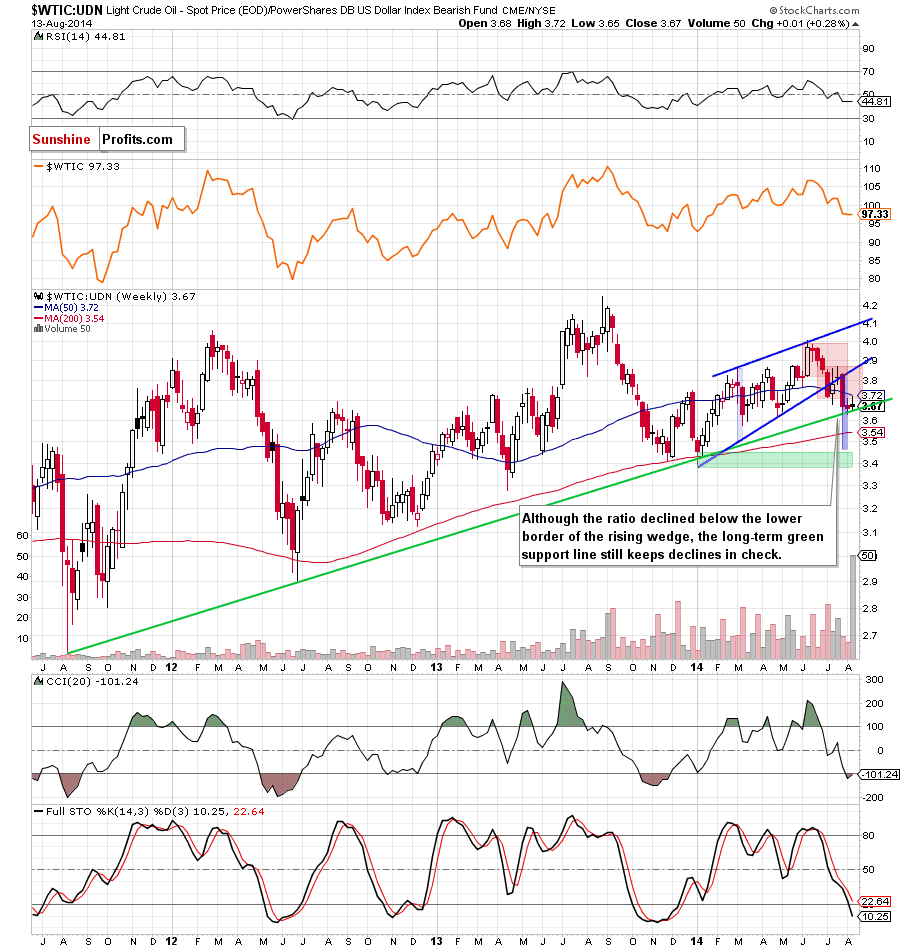
Looking at the above chart, we see that the ratio declined below the medium-term rising blue support line (the lower border of the rising wedge), which triggered a sharp decline to the long-term green support line. At this point, it’s worth noting that with this downswing, the ratio also broke below the lower border of the consolidation (marked with red). As you see on the weekly chart, the recent downward move took the ratio to its downside target (which corresponds to the height of the consolidation), which will likely reduce the selling pressure in the coming week (or weeks). Therefore, it seems to us that the major support line will withstand the selling pressure and we’ll see a corrective upswing and an attempt to come back to the rising wedge. Nevertheless, we should keep an eye on this ratio (as sell signals remain in place), because a breakdown below the long-term green support line would be a very bearish signal that could trigger a sharp decline in the commodity.
Summing up, Although the situation in crude oil is still unclear, it seems that a picture, which emerges from the above ratios is quite optimistic. The current strong negative divergence seen in the oil-stocks-to-oil ratio suggests that if history form 2012/2013 repeats itself once again, we will likely see a bottom of the correction in crude oil in the near future. In our opinion, this scenario will be even more likely if the WTIC:UDN ratio bounces off the major green support line. Therefore, we are convinced that it’s worth to keep an eye on these ratios in the coming days, because we’ll likely receive a valuable clues where the commodity head next.
Thank you.
Nadia Simmons
Forex & Oil Trading Strategist
Forex Trading Alerts
Oil Investment Updates
Oil Trading Alerts
