
This essay is based on the Premium Update posted October 30th, 2009. Visit our archives for more gold articles.
The U.S. Dollar, the currency in precious metals are priced in, is standing at a crossroad today. The possibility of breakout to the upside has grown in the past week, but the trend still remains down. So, what are the implications for the precious metals?
One road is a final plunge following the recent small rally. The other is a breakout to the upside from the severe downtrend it has been jammed in since early March. Should that take place, a rally could gain strength from panic short-covering. Sentiment (in terms of positions taken by Commercial and Non-commercial parties as measured in the Commitment of Traders report) for the dollar is universally bearish. Forex Options and Futures markets show US Dollar sentiment at near-record bearish extremes against almost all major counterparts.
I suppose that your e-mail inbox is inundated with newsletters with headlines such as: "Dollar forced to Abdicate," "End of U.S. Dollar Global Reserve Currency," "Faces of Death: the U.S. Dollar in Crisis," to name just a few.
Could this one-sided positioning in the futures marker suggest that the USD is near a major turning point?
If you follow the fierce debate that has erupted in recent weeks between the two major camps in monetary circles you get the sense that both sides are passionate in their beliefs. The gold bulls/dollar bears believe that the gold is poised to take off while the dollar is perched for a collapse. The other camp - the gold bears/dollar bulls - claim just the opposite.
You don't need the results of a sentiment poll mentioned on CNBC recently that nearly 98 percent of all respondents were bearish on the U.S. dollar. Just listen to the people you know talk about the greenback. I doubt you will find even one among your acquaintances who is bullish on the dollar. The public is worried that the only way to handle America's massive debt is with stealth devaluation over a long period of time.
Is it possible that the policy markers in Washington will allow the mighty dollar to plunge to new depths? Sure it is, if the only alternative is to admit that the previous monetary policy was wrong and that a crisis should have taken place many years ago along with higher unemployment in the past, and publicly state that the U.S. Citizens now have to pay for all that with even higher unemployment and lower standard of living.
Let's go back to the CoT analysis. As I already mentioned a month ago in the September 26th Premium Update (by the way, we've just updated the sample version of the update, so you will now be able to read the latest report free of charge) the CoT analysis (just like everything else) should be put into proper perspective before putting your money on the stake. While commenting on the CoT situation in gold, I wrote the following:
The remarkable thing that is often overlooked in the CoT analysis is that since two previous huge rallies took place when the CoT was unfavorable. Therefore, it seems logical for one to expect a similar thing also here. Guess what - that is exactly what we see today. The latest CoT report shows that the net short position of the Commercial Traders has reached a new extreme. The popular interpretation is that a sell-off is inevitable, but such situation is precisely what we've seen near the beginning of the 2005-2006 and 2007-2008 massive rallies.
I wrote the above when gold was under $1,000 and many CoT analysts warned about the coming plunge, which would have made you miss sizable gains since that time. However, I did not quote the previous update with the "told you so" approach. I quoted it because I wanted to emphasize the influence that using numbers without regard to anything else can be unprofitable. Getting back to the USD situation - the CoT reports indicate near-record bearish extremes, but... Isn't the U.S. Dollar also near its all-time lows? The difference between 76 and 72 on the USD Index is huge only if you focus on the short term. Taking a look at the 20-year USD Index chart reveals that the dollar is indeed near record lows.
Please take a look yourself (charts courtesy of http://stockcharts.com)
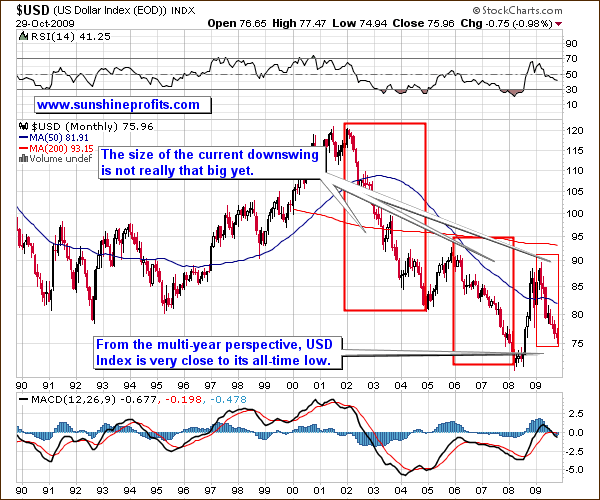
The point is that if the price is extremely low, then similar readings from the CoT reports are to be expected, and thus don't prove a bullish point here. They would, if the value of the USD Index was much higher, and the sentiment was extremely weak, but low prices simply correspond to low sentiment, also in terms of CoT reports. Consequently, there is no divergence that would indicate higher values of USD Index ahead.
Don't get me wrong - if CoTs would indicate that a move lower is likely, that would be a strong bearish signal given that we are already low. However, the situation here is asymmetrical, meaning that negative CoTs at this point are neutral.
Therefore, the most likely direction in which the USD Index will head next is the one according to the current trend - which is down. This is bullish for gold and silver.
Speaking of gold, it has just briefly (and successfully) tested the previous 2008 high, which makes following rally more and more likely.
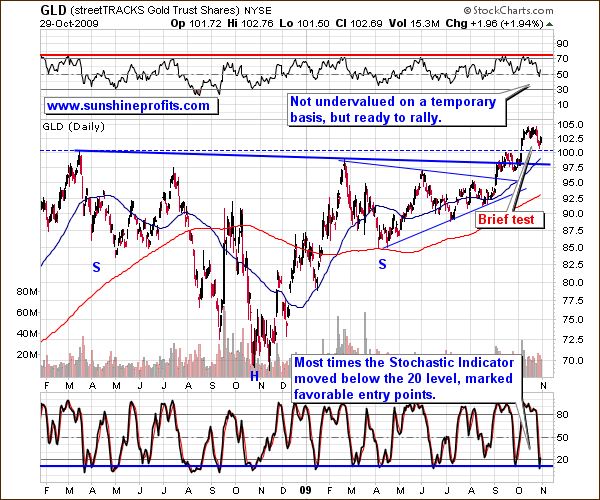
The test was sharp and priced reversed quickly, which on one hand flashes a green light that the previous top has been verified, and on the other hand proves the strength of the bull market. In other words, although price is lower than a few weeks ago, it's a bullish phenomenon.
There are also other bullish factors on the above chart, and these are the RSI and Stochastic indicators. The Relative Strength Index is rather popular, so I won't go into details here - the point is that it is currently right in the middle of its scale (near 50), so a rally from here is certainly possible. It is not undervalued nor screaming "buy gold on margin!" but it is nowhere near the overvalued level marked with the red horizontal line.
The other indicator that I featured above is the Stochastic indicator. It is not very useful in timing tops in gold, as it tends to stay in the overbought territory for weeks before the top is put, but it is not a top that we are focusing on here, and as far as local bottoms are concerned, this indicator is much more useful. Please take a look at its performance and reliability - virtually every time that it dropped to the level marked with the blue horizontal line, it meant a great buying opportunity. This level has just been touched, so the technical picture for gold becomes even more bullish.
Summing up, the situation one the dollar market does not look favorable, but that is the case with gold. The recent action in the general stock market may pose a threat to a part of the precious metals market, because of their historical correlations, but the gold market itself seems to be ready to soar once the trend in the dollar is resumed.
Normally, I would leave the short-term analysis to my Subscribers, but since I've just updated the sample version of the Premium Update, you can now read the full version right now.
There's one more thing that I would like to remind you last week, we've introduced the the new Free Charts section on my website, which i.a. allow you to see details of each gold/silver stock's performance relative to gold/silver, how much under- or overvalued it is, and much more. All of the above is updated on a daily basis (including the interpretation) and available free of charge.
To make sure that you get immediate access to my thoughts on the market, including information not available publicly, I urge you to sign up for my free e-mail list. Sign up today and you'll also get free, 7-day access to the Premium Sections on my website, including valuable tools and charts dedicated to serious PM Investors and Speculators. It's free and you may unsubscribe at any time.
Thank you for reading. Have a great and profitable week!
P. Radomski
--
This week's Premium Update covers many crucial aspects of the critical situation on the precious metals market and on markets that influence it: USD Index, and the general stock market. There are four detailed charts featuring the USD alone, as this is the key topic this week. Other things that I covered include the seasonality on the silver market and in the PM stocks, the CoT analysis of the USD Index, the Gold Miners Bullish Percent Index, and more. I also comment on the recent developments in one of our own key indicators, and provide detailed instructions on how you can deal with the current situation in PMs.
