
Based on the January 27th, 2012 Premium Update. Visit our archives for more gold & silver articles.
This week marked the Year of the Dragon in the Chinese calendar, and according to Chinese mythology, Dragon years bring powerful changes and optimism representing imperial power, prosperity and good luck. This year is supposed to be even more auspicious since it's a Water Dragon year, something that occurs once every 60 years. We admit that we don't yet use the Chinese Horoscope as a technical indicator, and who knows, perhaps we should. One thing is certainthe Year of the Dragon began with an auspicious move for precious metals. The dragon that breathed fire into precious metals prices was the Federal Reserve which announced this week that it is planning to keep interest rates at rock bottom for some years and hinted at further economic stimulus measures. Gold prices hit 6-1/2 week highs on Thursday as stock markets, commodities and the euro all rallied. This followed Wednesday's biggest one-day rise in three months after the Fed said it might consider further monetary easing through bond purchases (creating fiat currency out of thin air) and pushed back the likely timing of an eventual interest rate hike to late 2014.
Since many view a U.S. rate hike as a kiss of death to the gold bull market (we disagree), the news that it won't happen for at least three more years prompted those on the sidelines to join the ride. Gold closed above its 100-day moving average, a technical factor that further boosted confidence.
The Fed said in a statement that the economy had expanded moderately in recent weeks, but that unemployment remained at a high level, the housing sector remained in a deep depression, and the possibility of a new financial crisis in Europe continued to threaten the domestic economy.
Usually after the Asian gold buying binge for the Lunar New Year gold demand tends to drop along with winter temperatures. We have reasons to believe that will not be the case in the short term. Generally, central bank demand is not subject to seasonality (although one could argue about the business and election cycles impact). Accumulation by countries has removed several hundred tons of gold from the market in each of the past two years and there is no reason to think that this year will be different. Central banks use periods of price weakness to step up their buying which reduces downside risk for all of us while setting the stage for sizable snap-backs. Central banks around the world added 157 tons to their holdings in the six months through November, recent World Gold Council data show.
The gold accumulated by Chinese for the Year of the Dragon is not likely to go back into the world market since most Chinese savers and investors buy gold as long-term, quasi-permanent holdings. That coupled with buying by central banks whose holding periods can be measured by decades, means that there is less supply and any rise in demand for jewelry is likely to have a greater effect on the metal's price than might have been the case several years ago.
To see if the Year of the Dragon will be as auspicious as millions of Chinese believe it will be, let's turn to the technical part with the analysis of the USD Index. We will start with the very long-term chart (charts courtesy by http://stockcharts.com.)
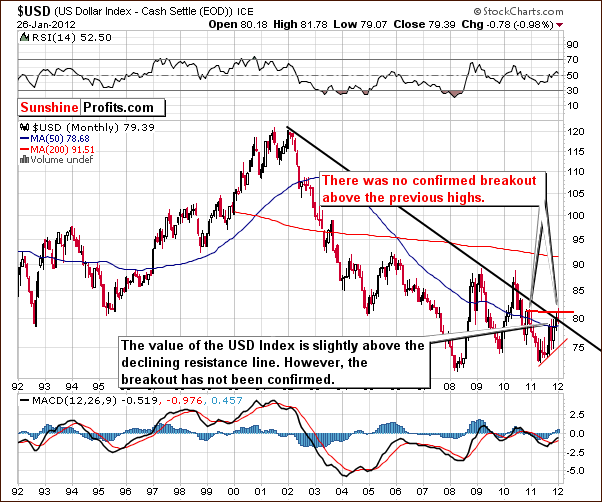
Our first chart today is the very long-term USD Index chart. There has been virtually no change within the past week, but we can clearly see that the recent breakout above the long-term resistance line is being verified or invalidated at this time. The latter is more likely (70% probability or so) since the recent breakout was not confirmed. A reversal to the downside is more probable and likely underway already.
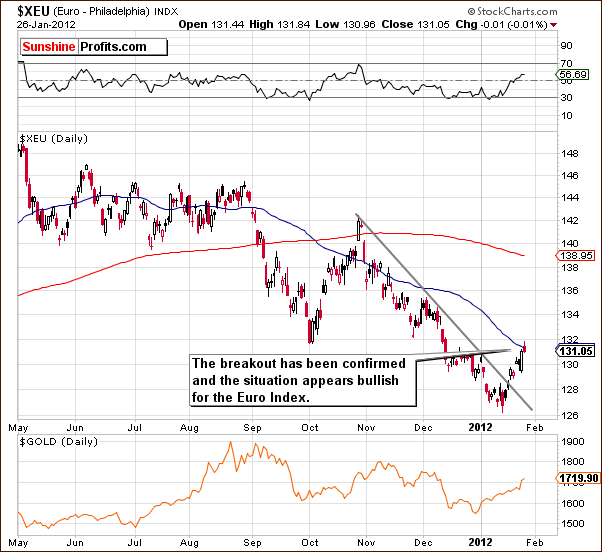
In the short-term Euro Index chart, we see a confirmation of the recent breakout. Recently, we have discussed the lack of a confirmation and a possible breakout in the Euro Index. Several days of closing prices above the support line without any significant moves to the downside not only confirm the breakout, but they also point to strength in the Euro Index at this time actually thats more likely weakness in the dollar that were seeing here, as currency exchange rates are ultimately relative valuations of currencies against each other and the recent statement from the Fed did not help to boost confidence in the greenback.
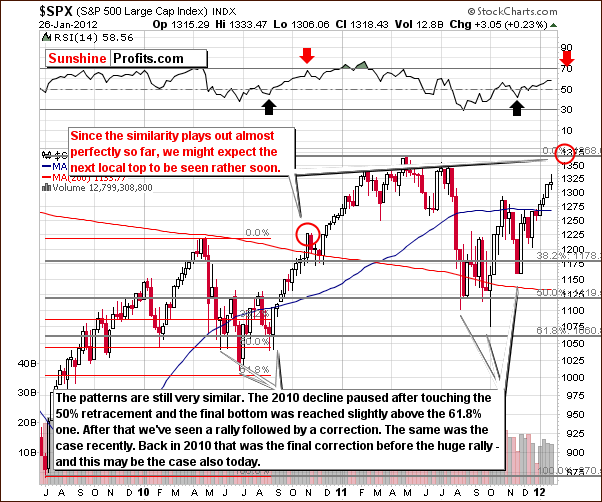
In the long-term S&P 500 Index chart, the self-similar pattern which weve been discussing for a few months with our subscribers has continued to play out well. If this goes on, the next local top will probably be close to the level of the 2011 high. The recent trading pattern has been consistent with the period leading up to the local top in 2010-11. In October-November 2010, declining prices were seen for a few weeks but were quickly followed by a continuation of the rally. We may have a similar situation here.
RSI levels should be looked at as well and are also indicating that a rally is likely ahead. It appears that it could last for two to four weeks as the RSI level will then likely be close to 70. This has coincided with local tops in the past.
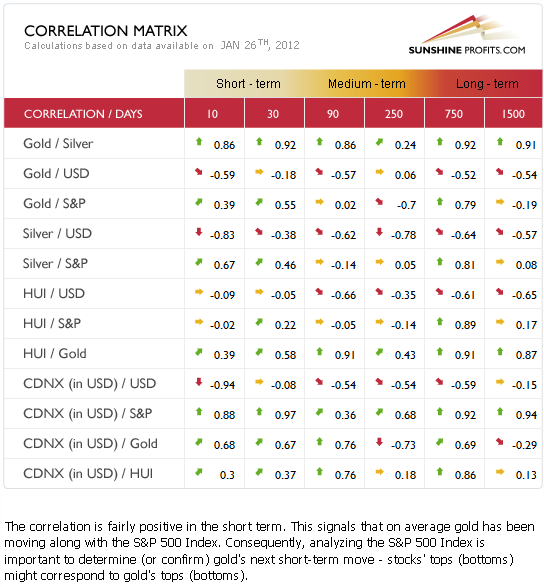
A brief explanation of how the Correlation Matrix worksis to be found in our last essay on the US dollars influence on gold. Significant changes have been seen here this week. The short-term correlation between the USD Index and the precious metals is rather weak and can be attributed to the strong European demand for gold. The yellow metal's price has rallied in all currencies and the correlation between the dollar and gold's price has therefore weakened.
A declining USD Index is medium-term bullish for gold and the precious metals, and the coefficient in the 90-day, medium-term column indicates this. The precious metals and the general stock market both have bullish outlooks at this time and several of their coefficients reflect this although the relationship cannot be described as strong. It seems best at this time to look directly at the precious metals themselves in order to analyze their likely short-term and long-term trends as we do in our full analysis.
Summing up, the breakout in euro above the short-term declining resistance line has been confirmed, which is bullish for euro and bearish for dollar. The situation for the general stock market is a bit unclear for the next few days, but the outlook remains bullish for the weeks and months ahead. Based on correlations, these factors do not disrupt our bullish view on the precious metals sector. More details (price targets, timing forecasts) regarding the precious metals sector are available in the full version of this essay.
Thank you for reading. Have a great weekend and profitable week!
P. Radomski
--
Gold soared this week and the same can be said about silver and mining stocks. The breakouts have been clearly visible and the trend for the precious metals sector is up. However, the question remains how high are metals likely to go. That's why this week's Premium Update includes price targets for: gold, GLD, silver, SLV, HUI Index and GDX ETF along with information when they can be reached.
In Wednesday's Market Alert, we included the analysis of Fed's recent statement with emphasis on the implications for precious metals. Today, we supplement it with our comments regarding the implications on the currency markets and the main stock indices. Among other things, we provide you with the path that the stock market is likely to follow in the coming weeks and months (based on a reliable pattern).
On top of that, we comment on the recent signal coming from one of our in-house-developed indicators, changes in our Correlation Matrix, Iran's steps to re-introducing gold as an international currency, USD and Euro Indices, the financial sector, gold from various perspectives (including GLD), silver / SLV, silver:gold ratio (what does the recent breakout in the ratio mean?), XAU and HUI Index, GDX ETF, GDX:SPY ratio and the Gold Miners Bullish Percent Index.
We encourage you to Subscribe to the Premium Service today and read the full version of this week's analysis right away.
