
This essay is based on the Premium Update posted on April 2nd, 2010. Visit our archives for more gold articles.
In the March 26th commentary we wrote that given the historical significance of the RSI being at 70 and the fact that the USD Index has just touched the 50% retracement of the previous rally leads us to anticipate that the recent USD Index rally will stall out and retrace. In addition, a rally for PMs and PM stocks is looking more and more probable.
Since this is exactly what happened, we believe you might want to read our thoughts regarding U.S. Dollar's and gold's next move. Let's begin with the long-term USD Index chart (charts courtesy of http://stockcharts.com), which is once again the main driver of PM prices (we will write more about that particular topic in the following part of this update).
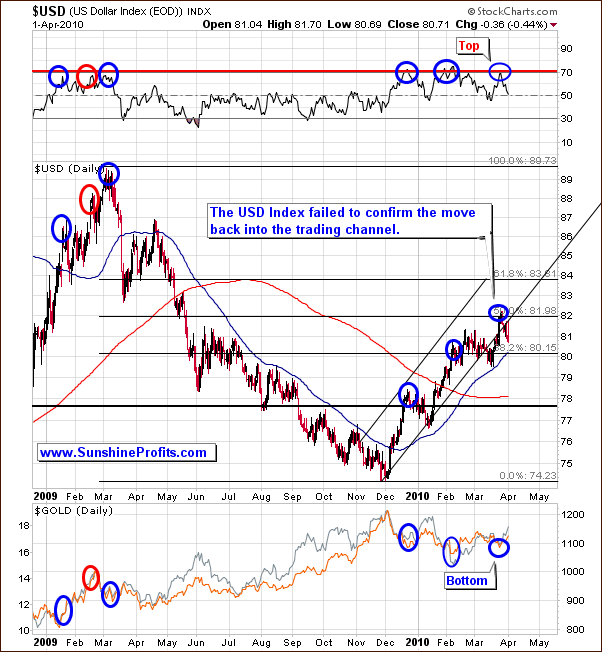
In the previous Premium Update we emphasized that the Fibonacci 50 percent retracement level of the previous (2009 Mar - Dec) decline. Key Fibonacci levels have historically been reliable in identifying key support and resistance, especially on the U.S. Dollar market.
Consequently, the U.S. Dollar moved considerably lower - visibly below the trading channel. This non-confirmation of a breakout is a bearish sign for the USD Index, and a bullish one for the PMs. Please note that once again the RSI at 70 meant a local top in the U.S. Dollar and a local bottom in gold and silver.
Another bullish signal for gold comes from the analysis of its correlation with the U.S. Dollar.
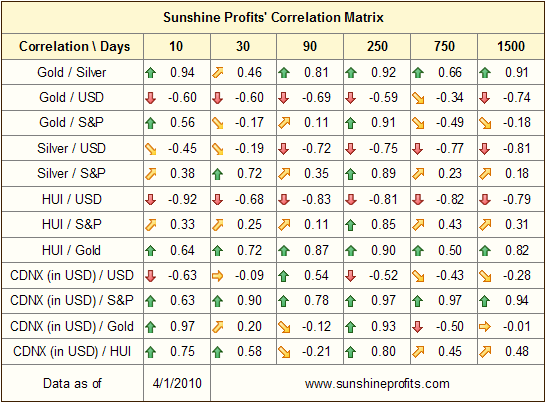
The correlations of the U.S dollar is starting to become more and more aligned with the metals sector, which is something we were looking to see develop as this is what we've seen in the gold / USD markets right before the huge September - December 2009 rally.
Please take a look at the 30-day column at the values of correlation coefficients for USD and gold / gold stocks - they are significantly negative for the first time in the last several weeks. Moreover, at the same time, the correlation between gold / gold stocks and S&P 500 is much lower. This means that gold and corresponding equities are once again mostly USD-driven in the short run.
Silver is still highly correlated with the general stock market, but it doesn't invalidate points made above, as silver tends to move closely with stocks because it has multiple industrial uses.
Therefore, the correlation matrix shows further evidence of the return of the highly negative correlation between USD and PMs. Additionally, the link between gold, mining stocks and the general stock market is much weaker than it was the case during the past several weeks. As mentioned earlier, this is positive news for PMs, because the return of this correlation is what we expected to see before the next big move up.
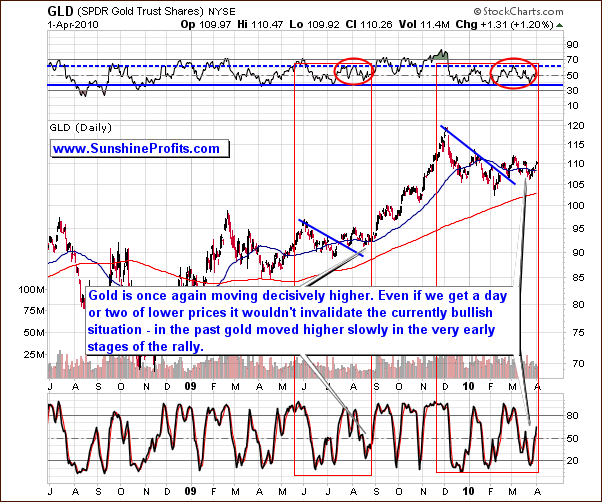
In our previous commentary we've summarized that the bullish analysis of gold is definitely still intact given the strikingly similar pattern in place back in August of 2009 where we had some consolidation followed by a significant rally.
Please note that the similarity is visible not only in the price itself but also in the RSI and Stochastic indicators. Based on the above chart it seems that even if we are going to see gold move a little lower from here, it will not change the bullish implications of the pattern. Let's take a look at the short-term chart for more details.
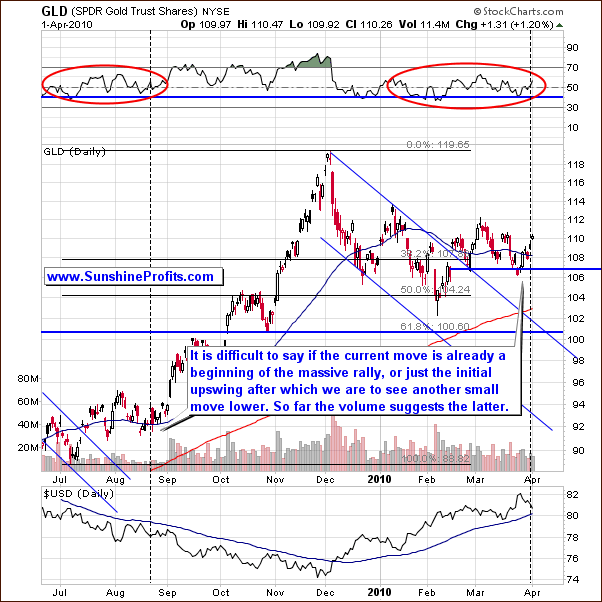
Looking at the short-term chart do not anticipate for the move to be immediate. Sure, it may be the case that gold rallies right away (that's why we had mentioned opening long positions in metals), but based on the similarity to the late August 2009, it seems that we may see gold moving slowly higher instead of rallying immediately. This means that if we see a small correction that takes gold $20 lower or so, it should not make you worried. We will let our Subscribers know if we believe that higher prices are not to be expected in the short- and medium-term.
Summing up, the situation in gold is still bullish - the technical analysis patterns are in place, and the strong negative correlation with the U.S. Dollar serves as a confirmation. Over 6-times bigger version of this essay with many important charts, ranking of juniors, comments on the physical PM market, and - most of all - timing details for the end of the current rally in PMs is available to our Subscribers.
To make sure that you are notified once the new features are implemented, and get immediate access to my free thoughts on the market, including information not available publicly, I urge you to sign up for my free e-mail list. Sign up today and you'll also get free, 7-day access to the Premium Sections on my website, including valuable tools and charts dedicated to serious PM Investors and Speculators. It's free and you may unsubscribe at any time.
Thank you for reading. Have a great weekend and profitable week!
P. Radomski
--
This week we have seen several commentaries dedicated to the current situation on the physical gold and silver markets (following the CFTC meeting on March 25th, 2010), and in this week's update we explain how you should position yourself given the new developments.
We have recently seen particularly interesting move in the USD Index, in addition to letting you know what we think about it, we explain the implications for the precious metals sector. This week's issue includes in-depth analysis of gold, silver, mining stocks, USD Index, and the main stocks indices. Naturally, all of the above are analyzed from both short- and long-term point of view. We also comment on the PM stocks' relative performance relative to other stocks and the recent signal coming from the Gold Miner's Bullish Percent Index.
Additionally, since several charts point to the same target, we also tell you when we expect the current rally to end.
Moreover, this issue includes rankings of top gold and silver juniors. We encourage you to Subscribe to the Premium Service today and read the full version of this week's analysis right away.
