
Stock Trading Alert originally sent to subscribers on June 16, 2014, 7:07 AM.
Briefly: In our opinion speculative long positions are still favored (with stop-loss at 1,910, S&P 500 index).
Our intraday outlook is neutral, and our short-term outlook remains bullish:
Intraday
(next 24 hours) outlook: neutral
Short-term (next 1-2 weeks) outlook: bullish
Medium-term (next 1-3 months) outlook: neutral
Long-term outlook (next year): bullish
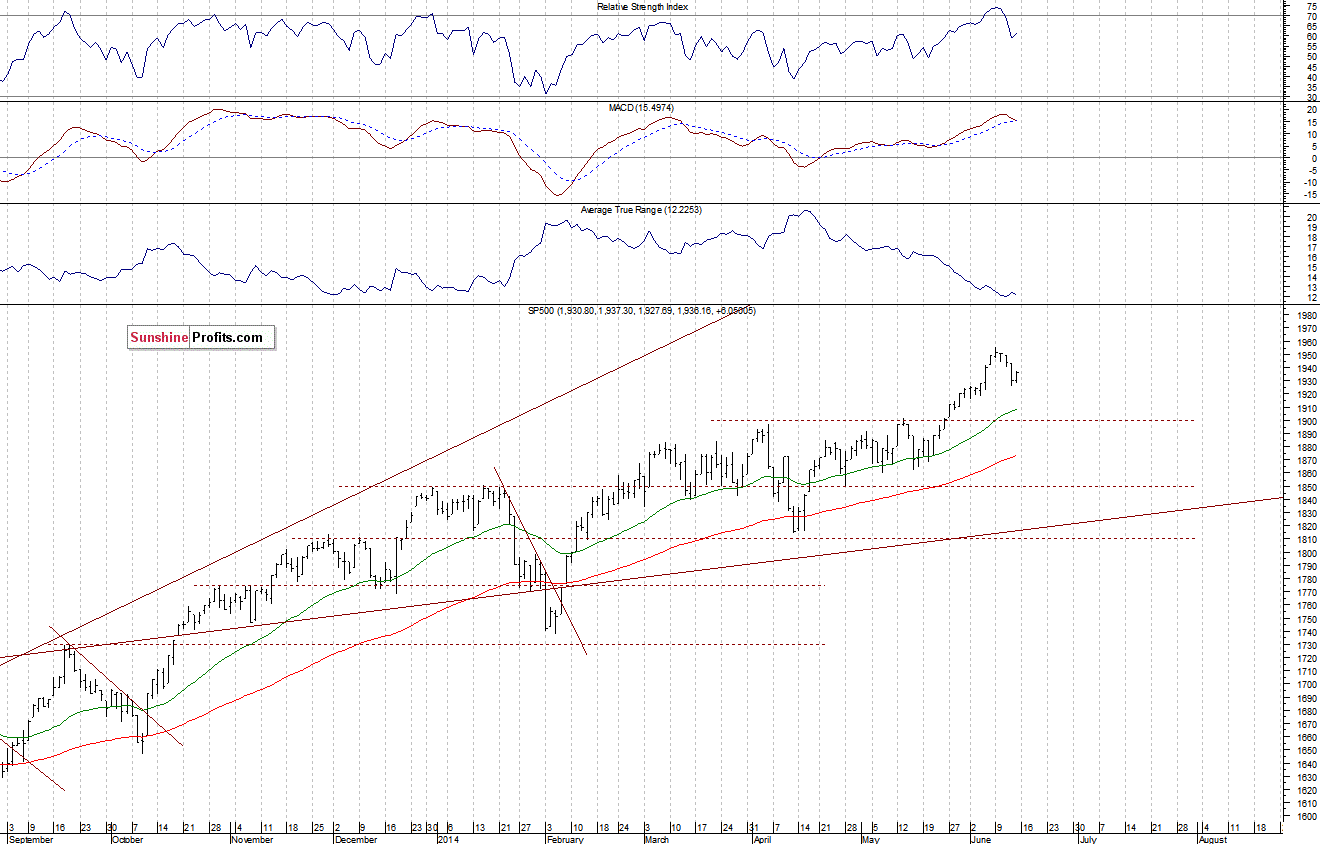
The main U.S. stock market indexes gained 0.3% on Friday, retracing some of their recent decline, as investors bet that stocks would resume long-term uptrend following last week’s downward correction. The S&P 500 index bounced off the support level of 1,915-1,925, marked by late May – early June consolidation. On the other hand, the resistance remains at 1,950-1,955, marked by June 09 all-time high of 1,955.55. For now, it looks like a correction within an uptrend, however, some further move down cannot be excluded. The important support level remains at the psychological 1,900, as we can see on the daily chart:
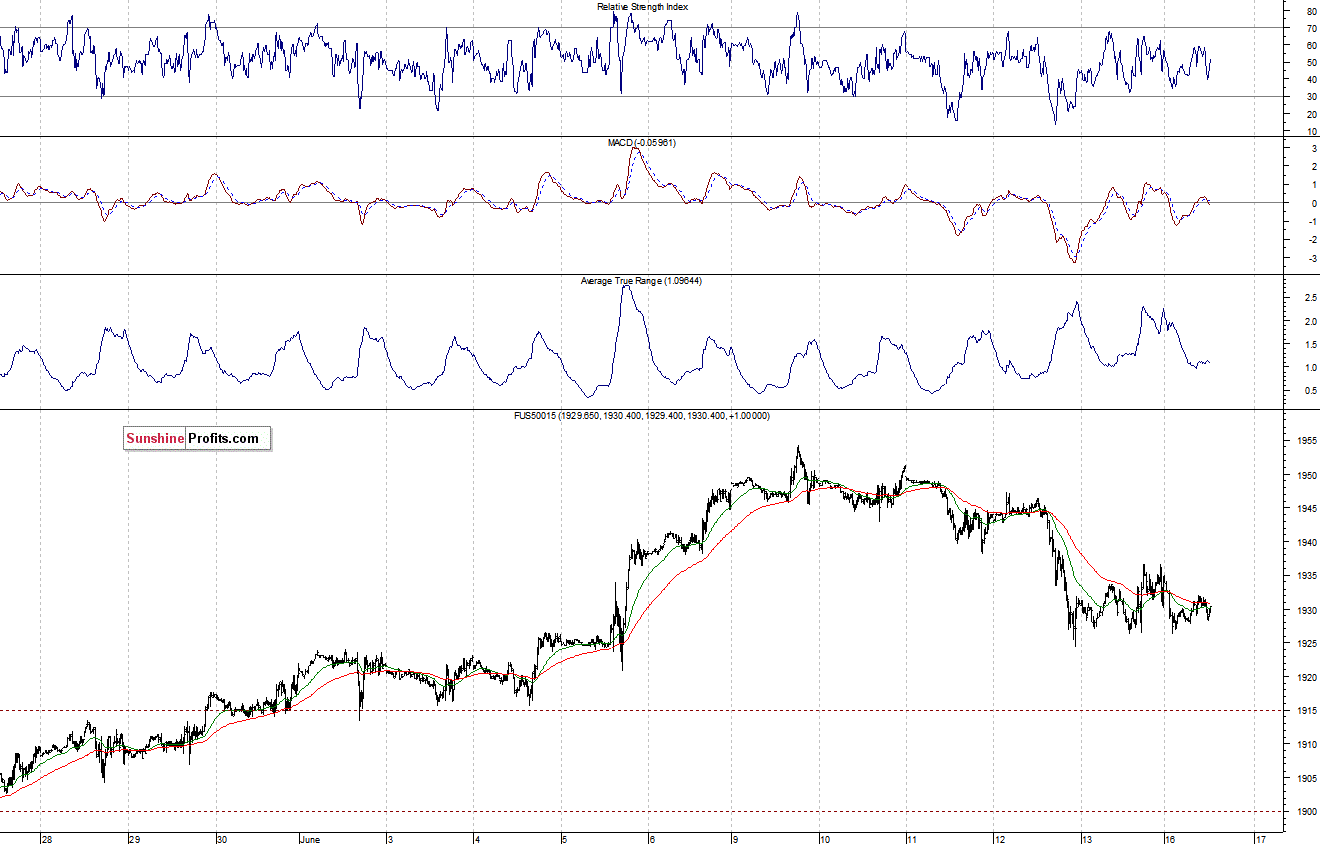
Expectations before the opening of today’s session are slightly negative, with index futures currently down 0.2-0.3%. The European stock market indexes have lost between 0.2% and 0.5% so far. Investors will now wait for some economic data announcements: Empire Manufacturing number at 8:30 a.m., Industrial Production, Capacity Utilization at 9:15 a.m., NAHB Housing Market Index at 10:00 a.m. The S&P 500 futures contract (CFD) extends its short-term consolidation, as it trades along the level of 1,930. For now, it looks like a flat correction following last-week’s decline. However, there is some relatively strong support level at around 1,915-1,925, as the 15-minute chart shows:
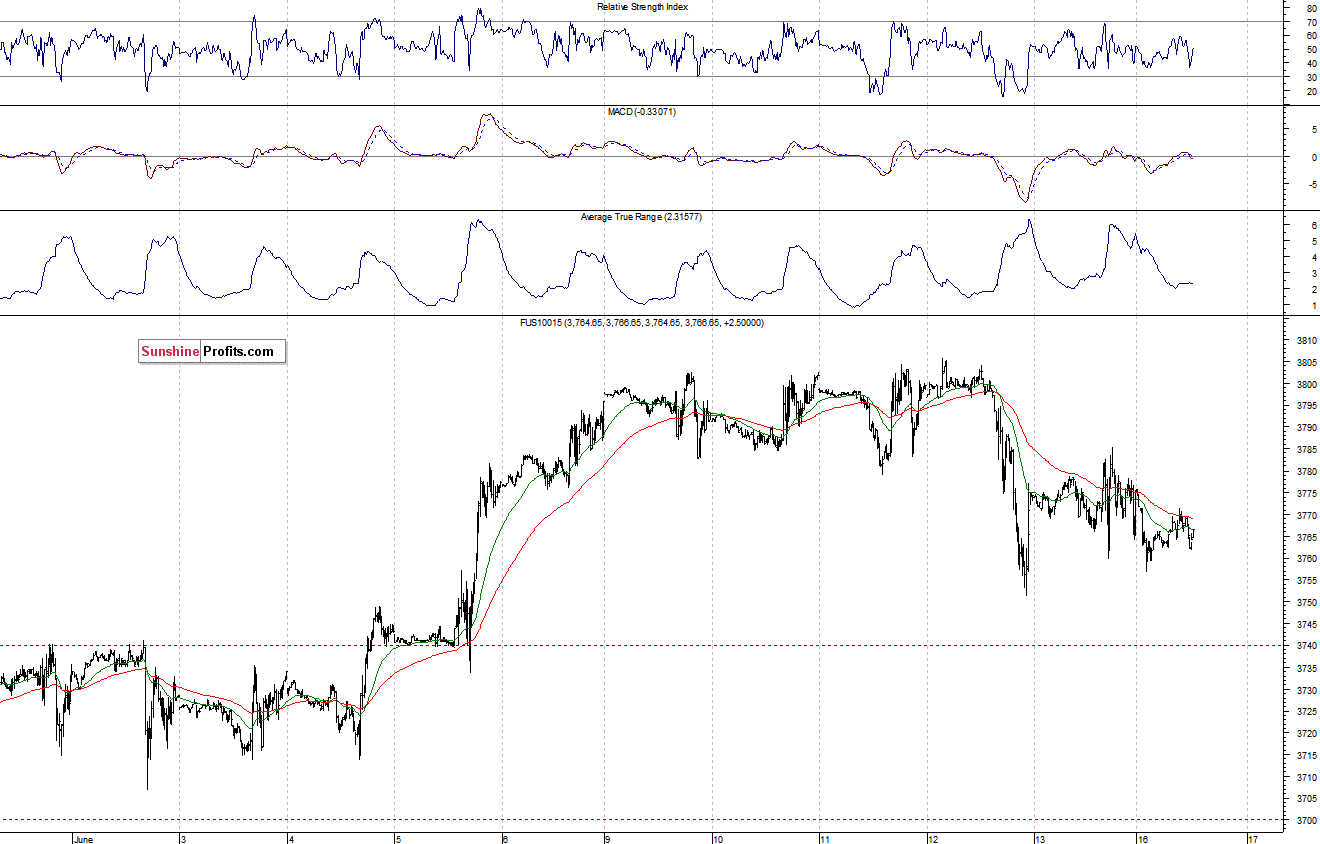
The technology Nasdaq 100 futures contract (CFD) follows a similar path, as it fluctuates in a relatively narrow trading range. The resistance remains at the psychological 3,800. On the other hand, the support level is at 3,750, among others:
Concluding, the broad stock market is in a short-term consolidation, following recent move down. It is hard to say whether this is a correction within a new downtrend, or some sort of a bottoming consolidation. We remain cautiously optimistic, expecting more upside. Therefore, we continue to maintain our already profitable long position, with stop-loss at 1,910 (S&P 500 index).
Thank you.
Paul Rejczak
Stock Trading Strategist
Stock Trading Alerts
