
This essay is based on the Market Alert and the Premium Update posted on January 26th and 27th, 2010. Visit our archives for more gold articles.
This week's free commentary is based on what we've sent to our Subscribers yesterday in the form of a Market Alert. It (along with the following Premium Update) included comments on many markets, but in this essay we will focus on precious metals stocks. Let's begin with a long-term chart of the HUI Index (charts courtesy of http://stockcharts.com.)
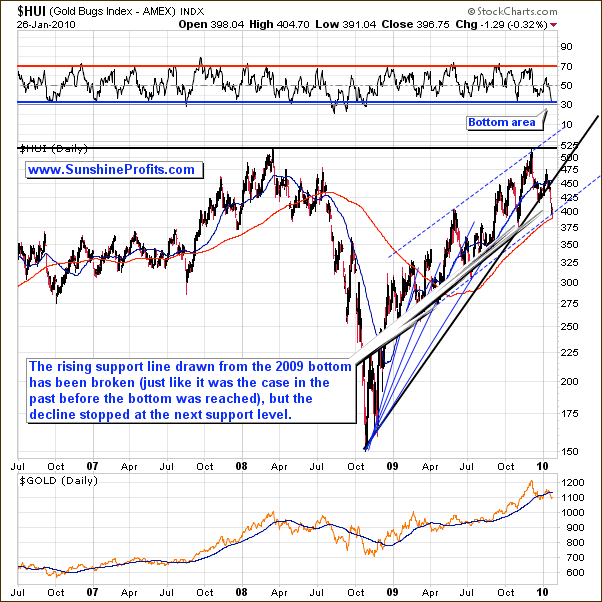
Much of what we wrote in the previous Premium Update regarding the long-term HUI chart is still relevant. We wrote the following:
Please take a look at the thin blue lines coming from the same price/time combination. Each of them was pierced, before the final bottom was put in, and this is what I expect to take place this time.
(...) taking the historical performance of the gold stock sector into account, it seems that PMs will need to move a little lower before putting in a bottom.
(...)
The bottom is likely to be accompanied by the RSI Indicator just above the 30 level.
This is exactly what we have seen today - the RSI is very close to the 30 level (blue horizontal line on the above chart), and HUI has broken below the rising support line just like it was the case in the past before the bottom was formed.
Consequently, the HUI Index appears oversold, and it is likely that the bottom will be formed soon. Still, it does not mean that the bottom is in, as prices may go from oversold to even more oversold in the short run.
Two of the following points that we made yesterday were that the GDX ETF has just touched its 200-day moving average and that the GDX ETF has moved VERY close to the lower border of the declining trend channel and the price that stopped the decline in early October 2009. Let's take a look at the short-term chart for details.
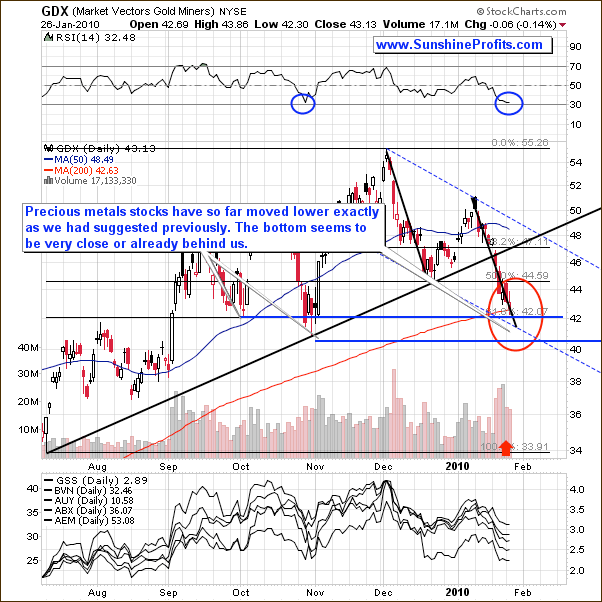
The short-term chart confirms that the GDX ETF is currently very close to the bottoming area (that we've drawn 2 weeks ago), which means that one may want to get ready to buy as far as the speculative capital is concerned.
Volume does not provide us with a clear "the bottom is in" signal. During the last two days the volume has been lower than in the previous three days, but it is not extremely low to suggest that there is hardly any selling pressure on the market.
The next thing that we mentioned in the last Market Alert was the GDX:SPY ratio (used to measure outperformance of PM stocks relative to other stocks) that reached a strong support level. Please take a look at the following chart for details.
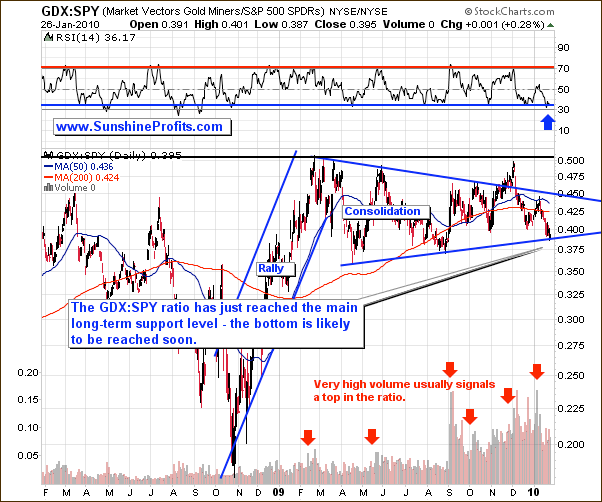
Tops and bottoms in the above ratio tend to correspond to tops and bottoms in the PM sector, so analyzing it often confirms (or invalidates) points made while analyzing other charts. This time the ratio has just hit a long-term support level, which suggests that the bottom in PMs is very close, or that we have just seen it. Please note that not only did the ratio itself reach a support level, but the RSI indicator is also flashing a "buy" signal.
Before summarizing, we would like to provide you with the description of one more of the points made in the recent Market Alert. We wrote that our unique indicators (available in the Premium Charts section) have flashed buy/extreme signal. You will find one of these charts below.
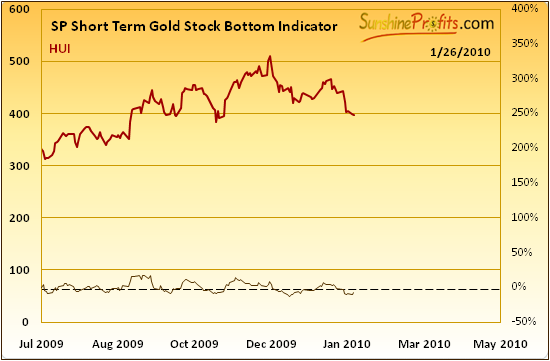
The SP Short Term Gold Stock Bottom Indicator has turned up while being under the dashed line, which is when it flashes a buy signal. Please note that in the past several months this signal has been very reliable.
Summing up, signals coming from the precious metals stocks suggest that the bottom is in or is very close. However, given the current level of globalization in the economy and financial markets, one must keep in mind that no market moves alone - they are connected in this or the other way. From time to time realizing this fact makes us get additional confirmations from markets that one would normally ignore. This time, however, we get a "caution warranted" signal from other markets, and we don't think that one should totally ignore it. Among other things covered in this weeks Premium Update (4x bigger than this essay with many detailed charts; available to Subscribers), we focus on the risk that the plunge in the main stock indices poses to PM Investors and Speculators.
To make sure that you get immediate access to my thoughts on the market, including information not available publicly, I urge you to sign up for my free e-mail list. Sign up today and you'll also get free, 7-day access to the Premium Sections on my website, including valuable tools and charts dedicated to serious PM Investors and Speculators. It's free and you may unsubscribe at any time.
P. Radomski
--
Precious Metals continue to slide and the general stock market appears to be ready to plunge further. What's a Precious Metals Investor to do, given the current uncertainty? Naturally, "now" is always the most difficult time to invest, so we strive to provide you with details necessary to make the optimal trading/investment-related decisions in the PM sector. Among other thing covered in this week's Premium Update (4x bigger than the free counterpart), we focus on the risk that the plunge in the main stock indices poses to PM Investors and Speculators.
In yesterday's Market Alert I wrote that it currently seems that the next several days will provide us with critical details and that I will comment on the situation more thoroughly (and I'll explain what type of signals will confirm that the bottom is in) in the next Premium Update. This week's Premium Update has been built around yesterday's Market Alert - we elaborate on each point made yesterday. We have analyzed the situation on the gold and silver markets, PM stocks (HUI Index, and the GDX ETF), USD Index, and the general stock market - all of which are covered from both long- and short-term point of view. Moreover, we have included analysis of the GDX:SPY ratio, our correlation matrix, and three of our unique indicators.
Additionally, as several Subscribers have requested, we commented on Mr. Robert Prechter's yesterday appearance in CNBC and his bearish views on gold. We encourage you to Subscribe to the Premium Service today and read the full version of this week's analysis right away.
