
Oil Trading Alert originally sent to subscribers on May 30, 2014, 11:15 AM.
Trading position (short-term; our opinion): Speculative short positions in crude oil seem to be justified from the risk/reward perspective.
On Thursday, crude oil gained 0.42% as the EIA report showed a larger-than-expected drop in U.S. gasoline supplies and shrinking inventories in the Oklahoma. These positive numbers overweighed bigger-than-expected build in crude oil stocks and pushed the commodity to the previously-broken support/resistance line. Is this the beginning of further improvement or just a verification of the breakdown?
Yesterday, the U.S. Energy Information Administration showed in its weekly report that crude oil inventories rose by 1.657 million barrels last week , while analysts had expected crude inventories to rise by 483,000 barrels. As we mentioned earlier, this bigger-than-expected build in crude oil stocks was overshadowed by bullish gasoline figures. Gasoline supplies declined by 1.803 million barrels last week, contrary to expectations of a 283,000-barrel increase. On top of that, oil investors focused on shrinking supplies in the Oklahoma, which stood at 21.7 million barrels as of May 23, the lowest level since 2008. Please note that inventories in Cushing have fallen 16 out of the last 17 weeks and are down more than 20 million barrels since late January, when a new pipeline opened to ship oil out of storage to refineries along the Gulf Coast.
Thanks to these circumstances, the price of crude oil moved higher despite a mixed bag of U.S. economic indicators. Yesterday, the Bureau of Economic Analysis reported that U.S. gross domestic product in the first quarter declined for the first time since the first quarter of 2011. Despite this bearish data, the report also showed that consumer spending increased by 3.1%, indicating that economic activity has rebounded. Additionally, the Department of Labor showed in its weekly report that initial claims for jobless benefits in the U.S. last week fell by 27,000 to 300,000, beating expectations for a decline of 9,000.
Did yesterday’s increase change the short-term or medium-term outlook? Let’s look for answer on the charts (charts courtesy of http://stockcharts.com).
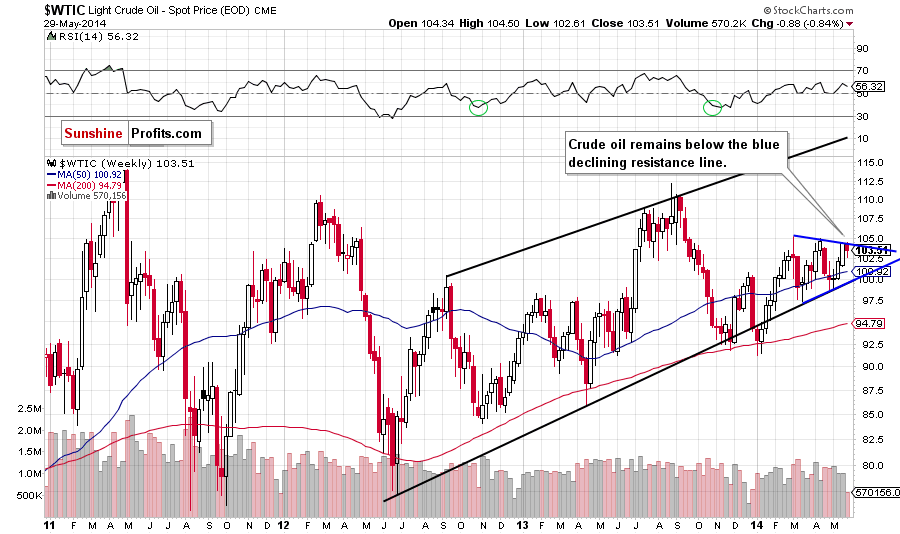
The medium-term picture hasn’t changed much as crude oil still remains below the blue resistance line based on the recent highs (the upper border of the triangle). Therefore, what we wrote yesterday is up-to-date:
(…) If this line holds, we will likely see a pullback and the nearest support will be the 50-week moving average (currently at $100.80) (…) the last week’s increase materialized on relative small volume, which questions the strength of oil bulls. On top of that, the RSI approached the level of 60. We saw similar reading in April and also earlier in March. Back then, such readings preceded declines. Therefore, if history repeats itself once again, we may see a correction in the coming week (or weeks).
Having said that, let’s focus on the very short-term picture.
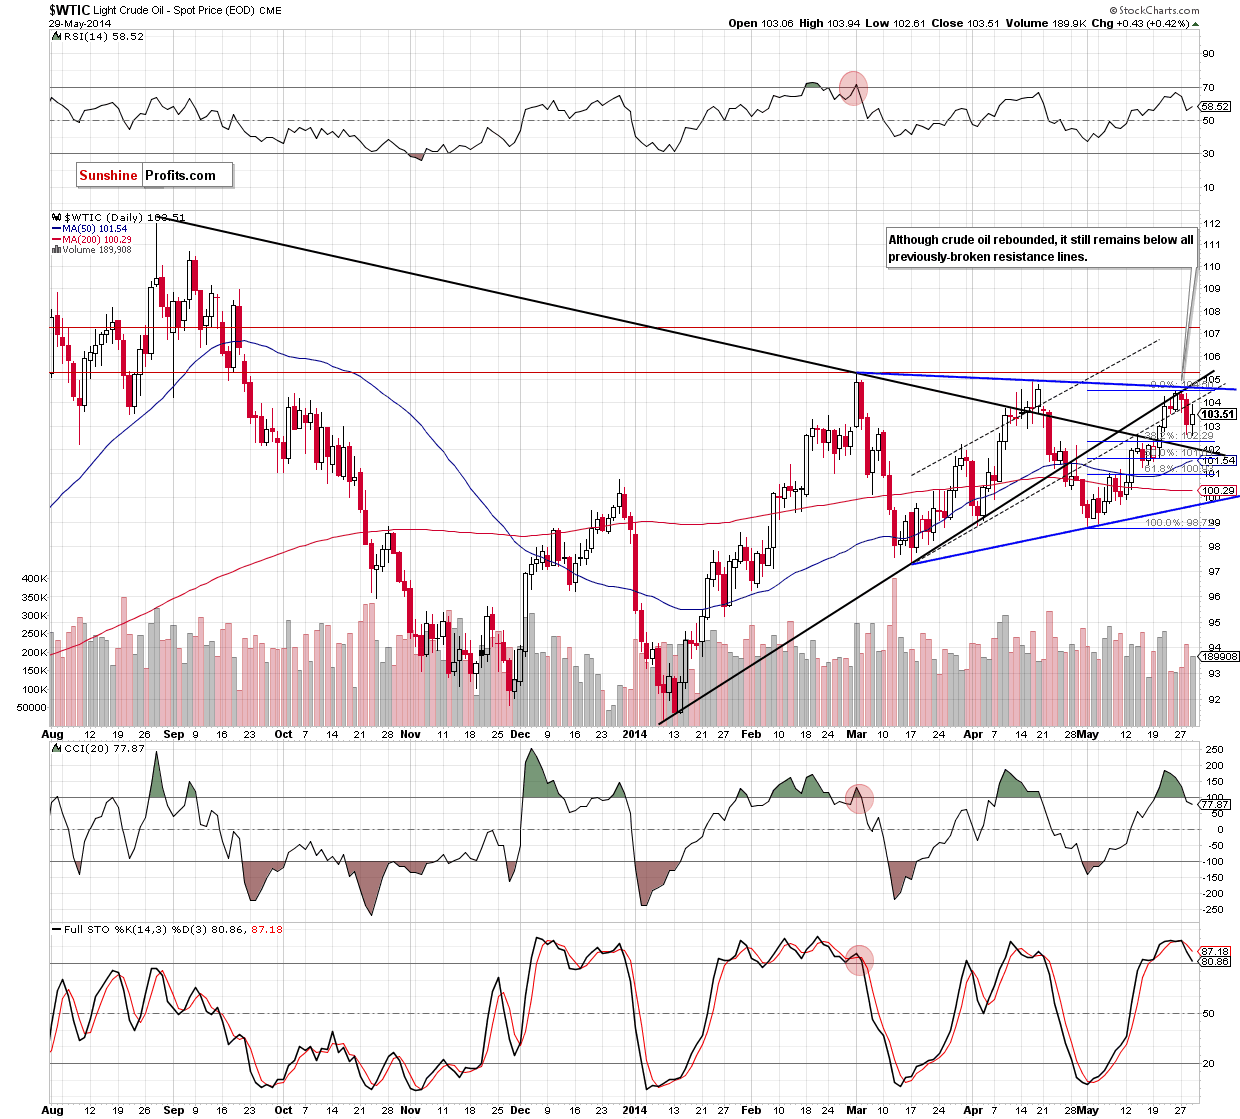
Looking at the above chart, we see that although crude oil rebounded, the previously-broken lower border of the rising trend channel successfully stopped further improvement and the commodity reversed. Additionally, sell signals generated by the CCI and Stochastic Oscillator are still in play. Therefore, we remain bearish and see this upswing as nothing more than a verification of the breakdown below the black dashed line. If this is the case, the commodity will extend losses in the nearest future and the first downside target will be around $102.30, where the 38.2% Fibonacci retracement based on the entire May rally is. If this support doesn’t stop the selling pressure, we will see further deterioration and the next target for oil bears will be the black medium-term declining support line (currently around $102).
Before we summarize today’s Oil Trading Alert, please keep in mind that even if oil bulls do not give up and manage to push light crude higher, we remain convinced that the resistance zone created by the blue and black resistance lines and also the April high will be strong enough to stop further improvement.
Summing up, although crude oil rebounded, reaching the previously-broken lower border of the rising trend channel, we remain bearish and see this upswing as nothing more than a verification of the breakdown below the resistance line. If this is the case, it will be a bearish signal and we’ll see light crude around $102 in the coming day (days).
Very short-term outlook: bearish
Short-term outlook: bearish
MT outlook: mixed
LT outlook: mixed
Trading position (short-term): Short. Stop-loss order at $105.50. We will keep you informed should anything change, or should we see a confirmation/invalidation of the above.
Thank you.
Nadia Simmons
Forex & Oil Trading Strategist
Przemyslaw Radomski, CFA
Founder, Editor-in-chief
Gold & Silver Trading Alerts
Forex Trading Alerts
Oil Investment Updates
Oil Trading Alerts
