
Oil Trading Alert originally sent to subscribers on April 2, 2014, 9:44 AM.
Trading position (short-term; our opinion): Short. Stop-loss orders for crude oil and also for WTI Crude Oil (CFD): $102.95.
On Tuesday, crude oil lost 1.84% as expectations for an eleventh straight weekly increase in domestic crude stockpiles weighed on the price. In this way, light crude declined below $100 a barrel for the first time in a week and closed the day at $99.69.
In recent weeks, builds in U.S. crude oil inventories were offset by declines in petroleum-product supplies. Additionally, consecutive drawdowns on supplies in Cushing, Okla. (as refiners move that crude to the Gulf for processing) supported the price of light crude. However, in the previous week, the EIA showed in its report the first increase in distillate stockpiles, which may remove the above-mentioned support in the following weeks. On top of that, if draws at the delivery point for the U.S. benchmark contract begin to slow down significantly, it would signal declining demand and push the price lower. We should also keep in mind that weak data on China's PMI and a weak increase in a U.S. manufacturing index (below expectations) painted a tepid picture of economic growth and energy demand. Therefore, expectations for an eleventh straight weekly increase in domestic crude stockpiles had a negative impact on the price and pushed crude oil below $100 a barrel for the first time in a week.
At this point, it’s worth noting that yesterday, the American Petroleum Institute showed that U.S. crude inventories rose by 5.8 million barrels in the week ended March 28 (above expectations for an increase of 5.3 million barrels), while distillate stocks increased by 17,000 barrels. Today’s the EIA report was expected to show that crude oil stockpiles rose by 1.1 million barrels last week, while distillate stockpiles, including heating oil and diesel, decreased by 100,000 barrels. Please note that if oil investors receive larger-than-expected numbers, it will likely trigger further deterioration in light crude.
Having discussed the above, let’s move on to the technical changes in the crude oil market (charts courtesy of http://stockcharts.com.)
In our last Oil Trading Alert, we wrote the following:
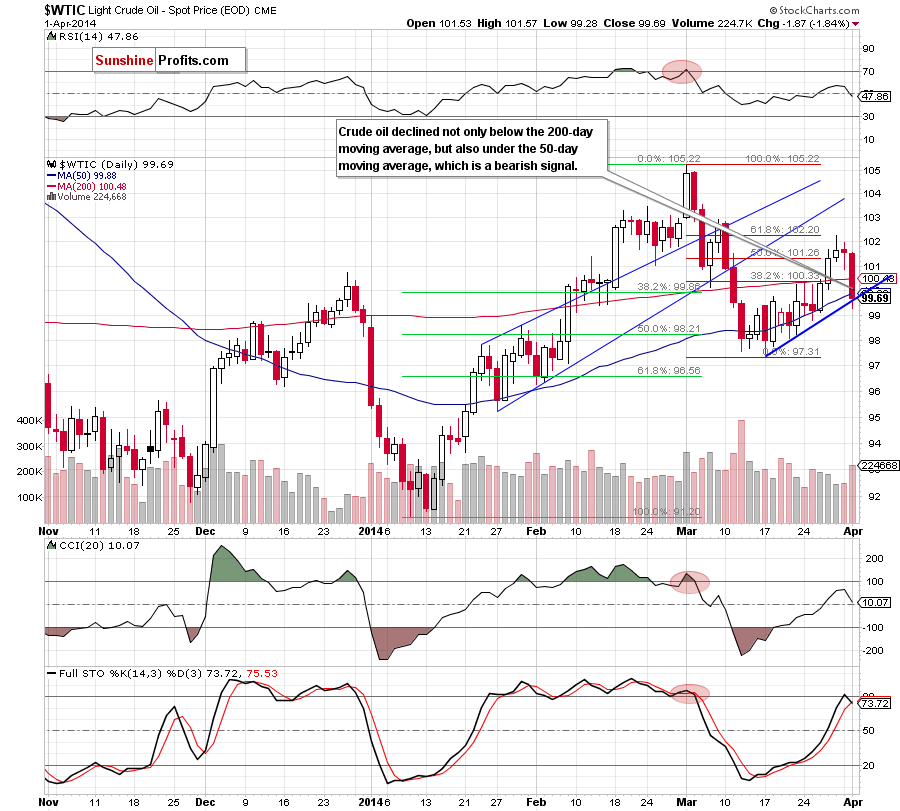
(…) crude oil gave up some gains and still remains below the 61.8% Fibonacci retracement. (…) If this resistance level encourages oil bears to act, we may see a pullback in the coming day (or days). If this is the case, the first downside target will be the previously-broken 200-day moving average (currently at $100.45).
Yesterday, oil bears showed their claws and not only realized this scenario, but also pushed the price below the 50-day moving average, which is a very negative signal. Additionally, this downward move materialized on increasing volume (compared to the preceding days), which confirms the strength of the sellers at the moment. On top of that all indicators reversed and the Stochastic Oscillator generated a sell signal, which suggests that we may see further deterioration in the coming day (or days). As you see on the daily chart, with yesterday’s downswing light crude reached a blue support line (based on the recent lows). If it is broken, the nearest support will be around $98.80, where the 61.8% Fibonacci retracement (based on the entire recent increase) is. Please note that this area is also reinforced by the March 25 low. If it is broken, the next downside target for the sellers will be a support zone (around $98-$98.27) created by the 76.4% and 78.6% Fibonacci retracements and the lower border of the rising trend channel on the weekly chart below.
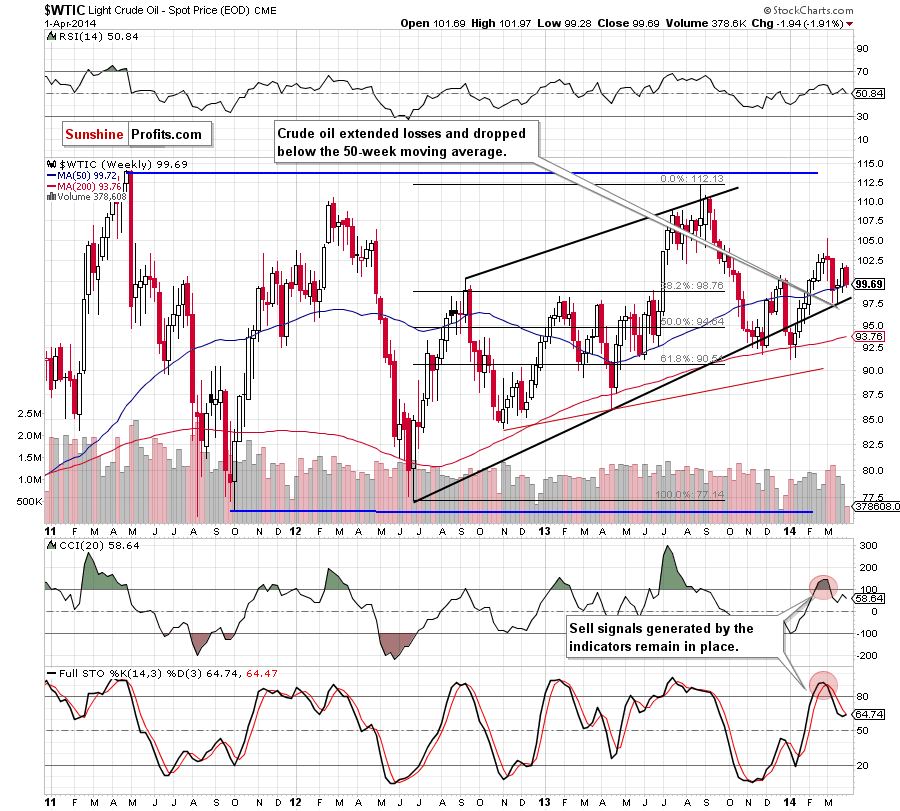
From this perspective, we see that crude oil broke below the 50-week moving average and sell signals generated by the indicators remain in place, which suggests further deterioration.
Having discussed the current situation in light crude, let’s take a look at WTI Crude Oil (the CFD).
Quoting our last Oil Trading Alert:
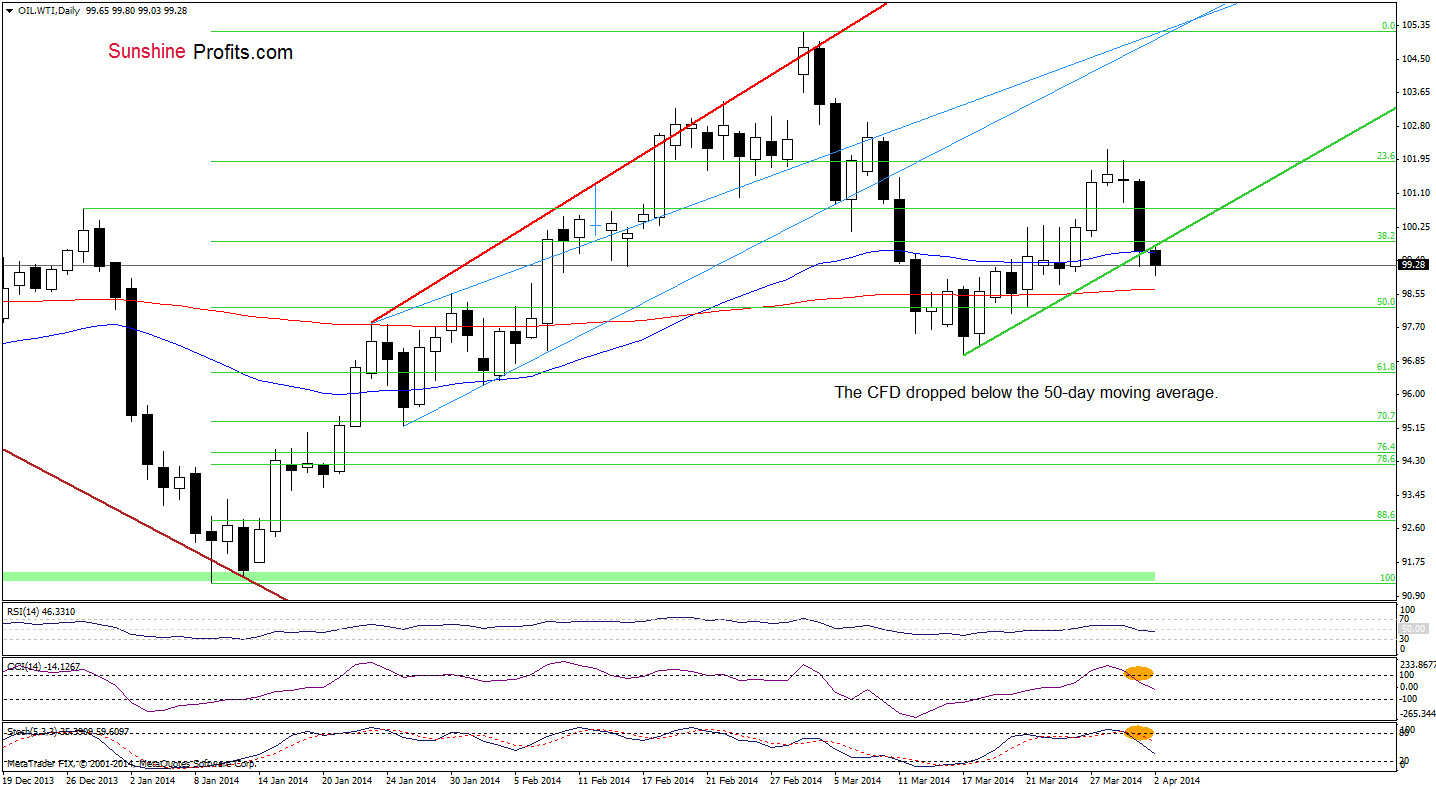
(…) if oil bulls (…) fail, we will likely see further deterioration and the first downside target will be around $100.22, where the 38.2% Fibonacci retracement (based on the entire recent increase) is. Looking at the current position of the indicators, we see that the CCI and Stochastic Oscillator are overbought and very close to generating sell signals, which suggests that a bearish scenario is more likely to be seen in the following hours.
Looking at the above chart, we see that the sellers not only reached this target, but also pushed WTI Crude Oil below the 50-day moving average and the very short-term green support line, which is a bearish sign. Additionally, the CCI and Stochastic Oscillator generated sell signals, which suggests further deterioration. If this is the case, the first downside target will be the previously-broken 200-day moving average (currently at $98.67). However, if this strong support is broken, we may see a correction even to the March 17 low of $96.99.
Before we summarize today’s Oil Trading Alert, let’s take a look at the 4-hour chart.
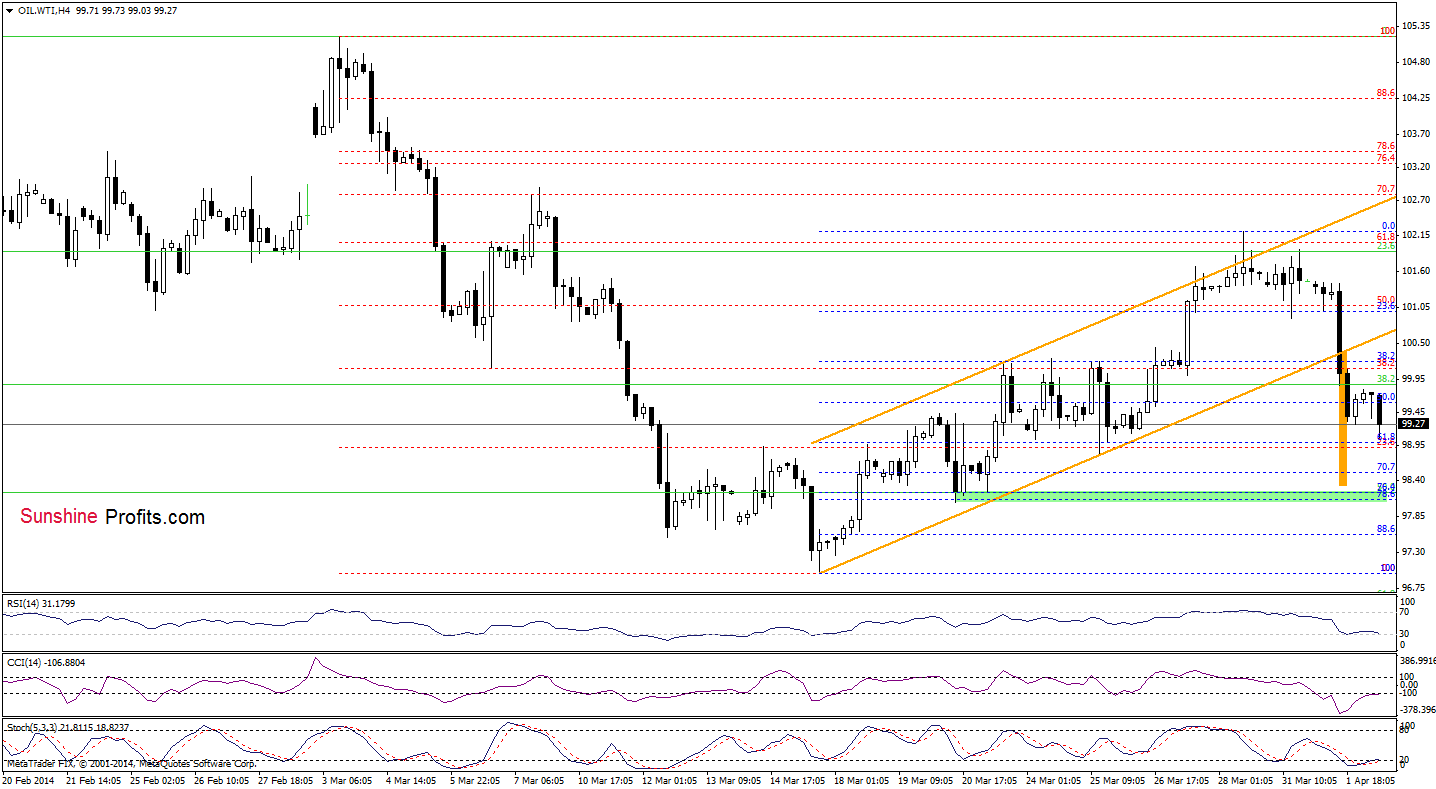
From this perspective, we see that the CFD extended losses and dropped below the lower border of the rising trend channel. According to theory, such price action will trigger further deterioration (just like earlier today) and the downside target will be around $98.31(slightly below the 200-day moving average and only 10 cents above a support zone created by the 76.4% and 78.6% Fibonacci retracements).
Summing up, the short-term situation has deteriorated significantly as crude oil dropped below the 200-day and 50-day moving averages. As mentioned earlier, yesterday’s downward move materialized on increasing volume (compared to the preceding days), which confirms the strength of the sellers. On top of that, the current situation in WTI Crude Oil suggests further deterioration (the CFD remains below the very short-term support/resistance line, while the daily CCI and Stochastic Oscillator generated sell signals). Connecting the dots, it seems that today’s decline in the CFD will have a negative impact on light crude and we will also see further deterioration in crude oil after the market open.
Very short-term outlook: bearish
Short-term outlook: mixed with bearish bias
MT outlook: mixed
LT outlook: mixed
Trading position (short-term): In our opinion, opening short positions at the following terms is a good idea: stop-loss orders for crude oil and also for WTI Crude Oil (CFD): $102.95. We will keep you informed should anything change as far as our opinion is concerned, or should we see a confirmation/invalidation of the above. The above is not an investment / trading advice and please note that trading (especially using leveraged instruments such as futures or on the forex market) involves risk.
Thank you.
Nadia Simmons
Forex & Oil Trading Strategist
Forex Trading Alerts
Oil Investment Updates
Oil Trading Alerts
