
Oil Trading Alert originally sent to subscribers on March 24, 2014, 8:33 AM.
Trading position (short-term; our opinion): Short. Stop-loss orders for crude oil and WTI Crude Oil (CFD): $102.95.
On Friday, crude oil gained 0.95% as concerns about economic sanctions against Russia weighted on the price. In this way, light crude climbed above $100 for the first time since March 11. Despite this increase, crude oil gave up the gains in the following hours and finished the day below this important barrier once again.
At the end of last week, geopolitical tensions over Russia's annexation of Crimea remained high as the European Union and the U.S. intensified sanctions against Russian President Vladimir Putin and his allies. Western nations expanded the list of people targeted by sanctions to include several people close to Mr. Putin (including a financial institution, Bank Rossiya, that is owned by a member of Mr. Putin's inner circle). These circumstances fueled concerns that sanctions against Russia could have economic implications and pushed the price of light crude above the psychological barrier of $100 on Friday. Nevertheless, later in the day, crude oil reversed as Russian President Vladimir Putin said that Russia should refrain from further retaliation against the U.S. in response to sanctions targeting members of his inner circle and other high-ranking government officials following the annexation of Crimea. This comment came shortly before Russia's upper house of parliament approved a treaty to formally annex Crimea which voted to leave Ukraine and become part of Russia during the previous weekend.
Having discussed the above, let’s move on to the technical changes in the crude oil market (charts courtesy of http://stockcharts.com.)
Quoting our last Oil Trading Alert:
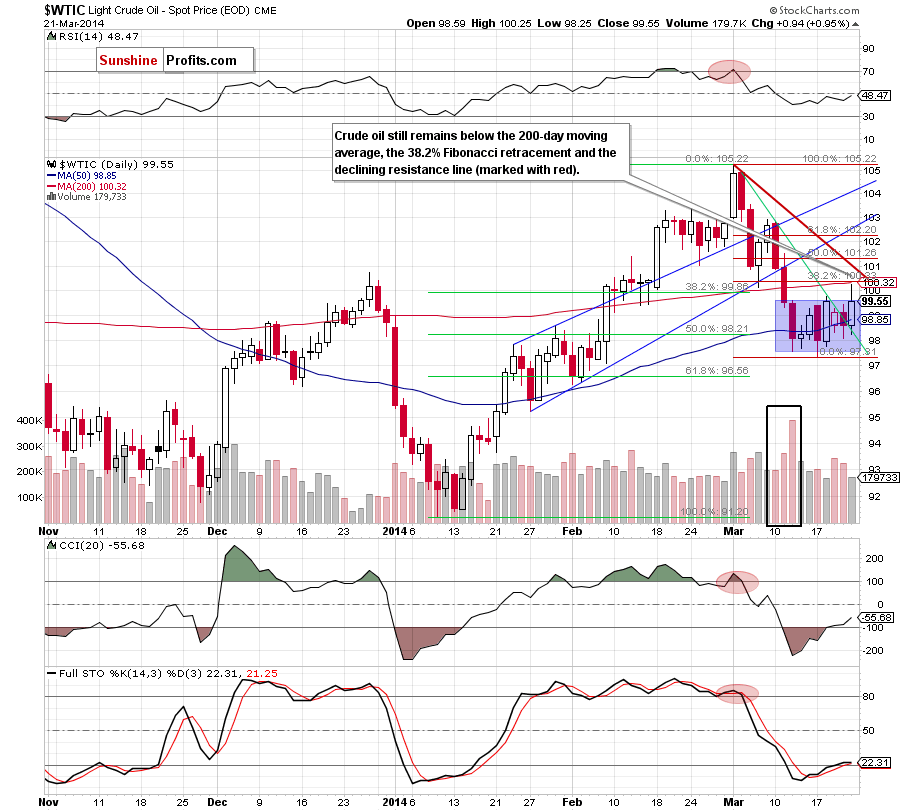
(…) oil bulls tried to push the price above the declining resistance line (…) after the market open, but they failed. (…) However, if this line is broken, we may see further improvement and an increase to the 200-day moving average, which still serves as the major resistance (currently at $100.27). At this point it’s worth noting that this area is also reinforced by the 38.2% Fibonacci retracement based on the recent decline (around $100.33).
Looking at the above chart we see that the buyers realized this pro growth scenario on Friday. However, a strong resistance zone created by the 200-day moving average and the 38.2% Fibonacci retracement successfully stopped further improvement and encouraged oil bears to act. In this way, light crude reversed and declined to the consolidation range (marked with a blue rectangle) once again. From this perspective, it seems that as long as crude oil remains below the resistance zone, a bigger upward move is not likely to be seen. Please note that, slightly above the resistance is also the declining resistance line (marked with red), which reinforces this area (currently around $100.60). Additionally, Friday’s upswing materialized on relative small volume, which is not a bullish sign.
Having discussed the current situation in light crude, let’s take a look at WTI Crude Oil (the CFD).
In our last Oil Trading Alert, we wrote the following:
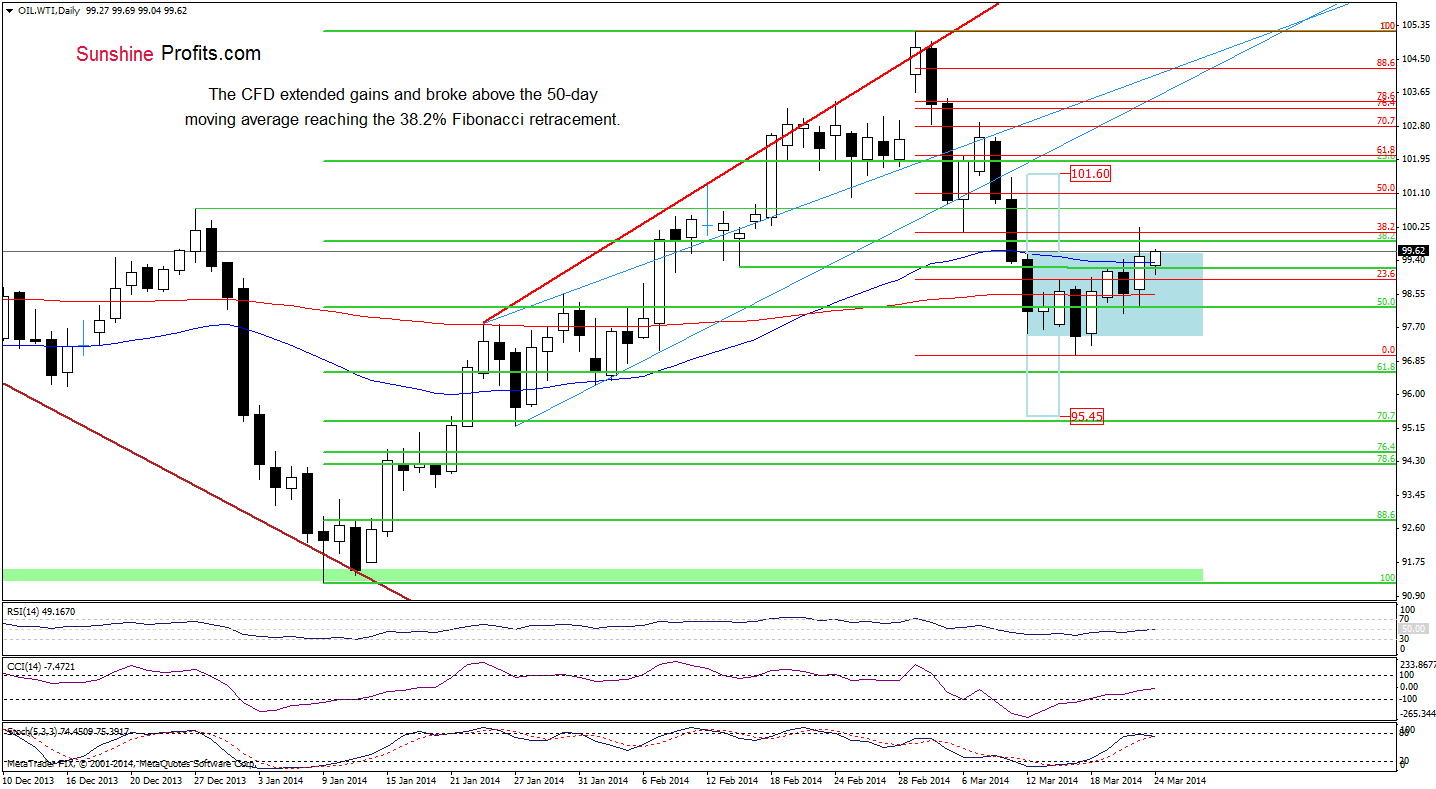
(…) if WTI Crude Oil climbs above the 50-day moving average, we will likely see an increase above the upper line of a consolidation range (marked with a blue rectangle). In this case, the first upside target will be the 38.2% Fibonacci retracement at $100.08 (…).
On Friday, oil bulls successfully realized this scenario and pushed the CFD to the 38.2% Fibonacci retracement. However, as you see on the above chart, this improvement was only temporarily. WTI Crude Oil reversed in the following hours and slipped to the consolidation range (similarly to what we saw in the case of light crude). Although the buyers tried to break above the upper line of the consolidation earlier today, the CFD still remains below the 38.2% Fibonacci retracement, which serves as major resistance and keeps further gains in check.
Summing up, although we saw the first attempt to break above the 200-day moving average and the 38.2% Fibonacci retracement, oil bulls failed and the price declined to the consolidation range. Additionally, Friday’s increase materialized on relative small volume, which doesn’t confirm the strength of the buyers at the moment. The current situation in WTI Crude Oil suggests that we may see another attempt to move higher (in the case of light crude) after the market open. However, as mentioned earlier, as long as crude oil remains below the resistance zone, a bigger upward move is not likely to be seen.
Very short-term outlook: mixed with bearish bias
Short-term outlook: mixed with bearish bias
MT outlook: bullish
LT outlook: mixed
Trading position (short-term): Short. Stop-loss orders for crude oil and WTI Crude Oil (CFD): $102.95. We will keep you informed should anything change as far as our opinion is concerned, or should we see a confirmation/invalidation of the above.
Thank you.
Nadia Simmons
Forex & Oil Trading Strategist
Forex Trading Alerts
Oil Investment Updates
Oil Trading Alerts
