
Oil Trading Alert originally sent to subscribers on March 17, 2014, 10:47 AM.
Trading position (short-term): Short. Stop-loss orders for crude oil and WTI Crude Oil (CFD): $102.95.
On Friday, crude oil gained 0.78% as Sunday's closely-watched referendum in Ukraine’s Crimea region and the IEA forecast weighted on the price. Thanks to these circumstances, light crude extended gains and closed the day slightly above $99 per barrel. Despite this growth, crude oil lost 3.56% in the previous week and this was the second weekly loss in nine weeks.
On Friday, investors were focused on events in Ukraine after Russia launched new military exercises near its border with Ukraine on Thursday, showing no sign of backing down on plans to annex Crimea. Tensions between Russia and the West supported the price of crude oil as the U.S. and Europe threatened that they would impose economic and diplomatic sanctions on Russia.
Another bullish factor, which pushed the price of light crude higher was the International Energy Agency forecast for global oil demand this year. The IEA increased its forecast by 95,000 barrels to 1.4 million a day, citing stronger economic growth.
Despite this positive news, crude's gains were limited as disappointing consumer sentiment data weighted on the price, fueling concerns that U.S. economy will demand less fuel and energy. As a reminder, the Thomson Reuters/University of Michigan preliminary consumer sentiment index fell to 79.9 for March, from 81.6 in the previous month (well below expectations for a rise to 82.0). Additionally, the U.S. producer price index fell 0.1% in February (also below expectations for a 0.2% rise), while core producer price inflation (which excludes food, energy and trade) slipped 0.2% last month (also below expectations for a 0.1% rise).
Having discussed the above, let’s move on to the technical changes in the crude oil market (charts courtesy of http://stockcharts.com.)
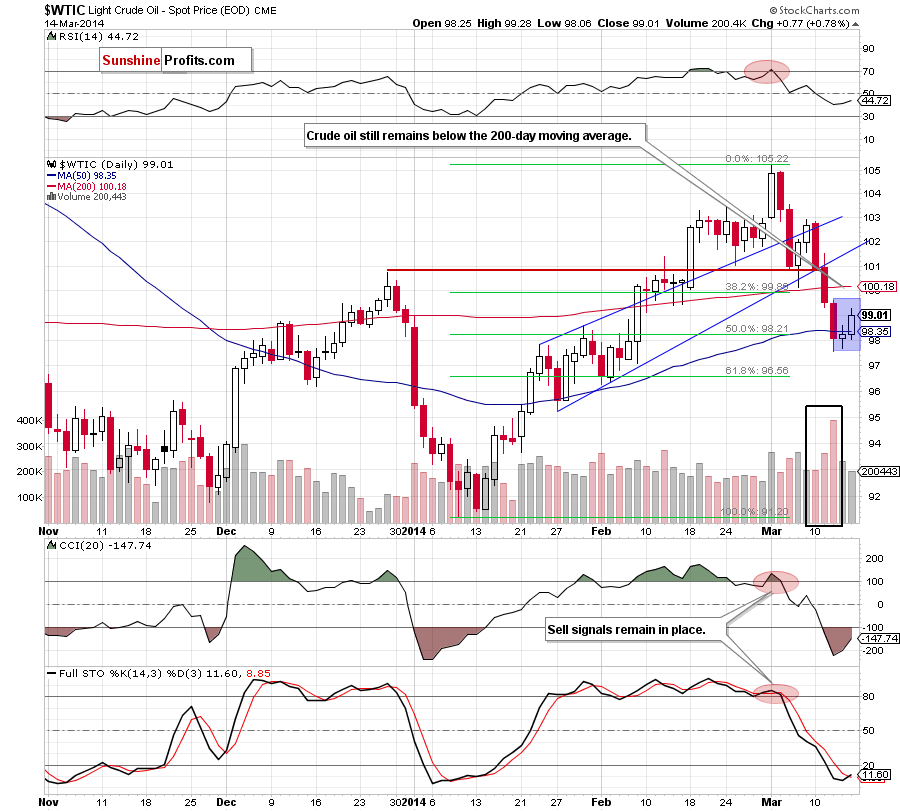
Looking at the above chart, we see that the situation hasn’t changed much as light crude remains in a consolidation (marked with a blue rectangle). Although crude oil extended gains on Friday and came back above the 50-day moving average, it didn’t even erased 38.2% earlier losses (the 38.2% Fibonacci retracement based on the recent decline is around $100.45) and still remains below the 200-day moving average (which serves as the major resistance). As you see on the daily chart, Friday’s upswing materialized on relative small volume, which doesn’t confirm the strength of the buyers at the moment. At this point, it’s worth noting that we saw similar situation at the beginning of the month, when higher values of crude oil were not confirmed by an increasing volume. At that time, such price action triggered a decline, which took light crude to the current level. If history repeats itself, we may see similar price action in the coming day (or days). As mentioned earlier, light crude remains in a consolidation. According to theory, if the price climbs above $99.60, we may see an upswing to around $101.65. However, if the buyers fail and crude oil declines below $97.55, the price target for oil bears will be around $95.50 (please note that the nearest support is the 61.8% Fibonacci retracement, which corresponds to this level).
Having discussed the current situation in light crude, let’s take a look at WTI Crude Oil (the CFD).
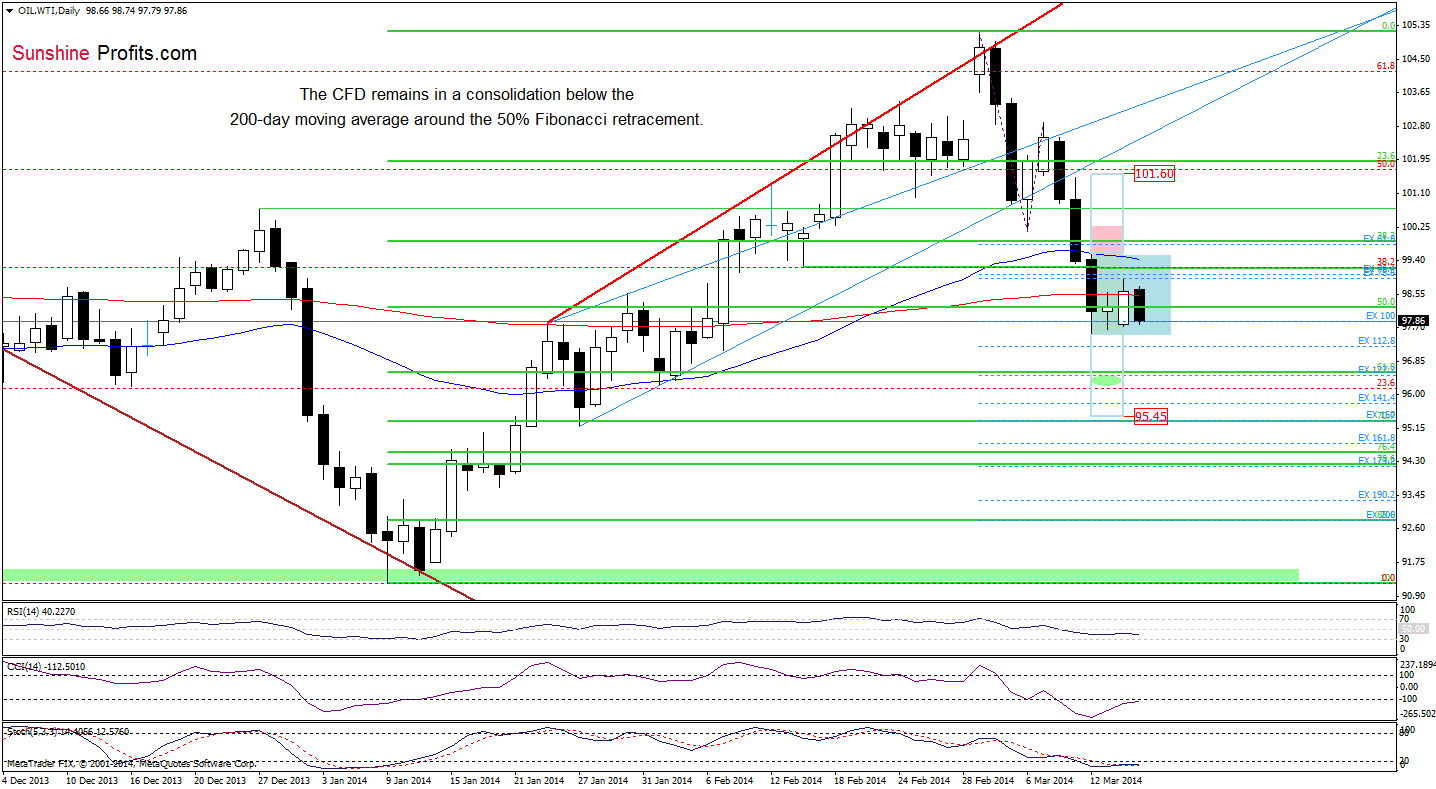
On the above chart, we see a situation (just like in the case of crude oil) hasn’t changed much. Although the CFD moved little higher on Friday, it still remains in a consolidation below the 200-day moving average around the 50% Fibonacci retracement. Therefore, what we wrote in our last Oil Trading Alert is still up-to-date.
(…) From this perspective, it seems that as long as this resistance is in play, a bigger corrective upswing is not likely to be seen and another attempt to move lower should not surprise us. Nevertheless, taking into account the fact that the CFD remains in a consolidation, we should consider two scenarios. On one hand, if oil bulls break above the nearest resistance and push the price above Wednesday high (which is currently reinforced by the 50-day moving average), we may see an upward move to around $101.60. On the other hand, if they fail and the CFD drops below Wednesday low, we may see a downward move not only to the first downside target (the 61.8% Fibonacci retracement around $96.55), but even to around $95.45, where the 70.7% Fibonacci retracement and the Jan.27 low are. Looking at the position of the indicators, we see that they are still overbought, but there are no buy signals at the moment.
Summing up, although crude oil moved higher on Friday, the very short-term outlook remains bearish and the overall situation hasn’t changed much. The current situation in WTI Crude Oil suggests that we may see another attempt to move lower after the market open. At this point, it’s worth noting that as long as light crude remains below the 200-day moving average another downswing can’t be ruled out (especially when we take into account the size of the volume that we saw in recent days and the position of the indicators).
Very short-term outlook: bearish
Short-term outlook: mixed with bearish bias
MT outlook: bullish
LT outlook: mixed
Trading position (short-term): Short. Stop-loss orders for crude oil and WTI Crude Oil (CFD): $102.95. We will keep you informed should anything change as far as our opinion is concerned, or should we see a confirmation/invalidation of the above.
Thank you.
Nadia Simmons
Forex & Oil Trading Strategist
Forex Trading Alerts
Oil Investment Updates
Oil Trading Alerts
