
Without a doubt, July was the worst month for crude oil since the beginning of the year. It spent months climbing slowly from the January low of $91.24 to the 2014 high of $107.68 and then the commodity gave up over 60% of earlier gains in just seven weeks. The latest round of selling triggered a sharp decline below the long- and medium-term support lines, the 200-day moving average and the psychological barrier of $100, which turned the medium- and the short-term outlook to bearish. What’s interesting, at the same time the oil stock index didn’t even erase 38% of the entire 2014 rally, which clearly shows that oil stocks are still stronger than the commodity itself. Did the latest round of selling in crude oil affected negatively the XOI picture? Let’s examine the NYSE Arca Oil Index (XOI) from different time horizons and find out (charts courtesy by http://stockcharts.com).
Let’s begin with the long-term chart.
In our last essay on oil stocks, we wrote the following:
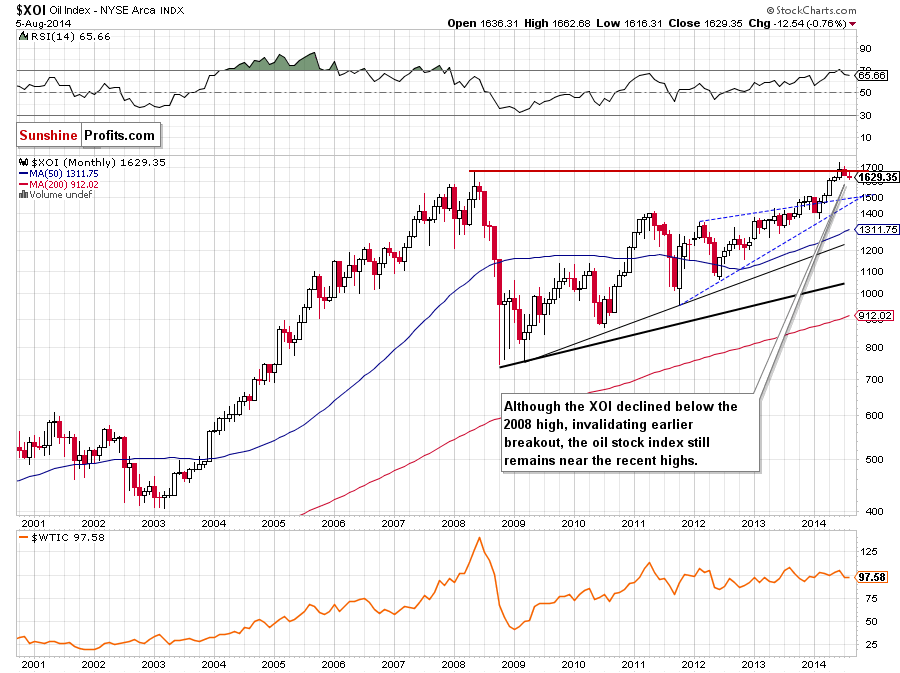
(…) we should keep in mind that the RSI is still overbought, which suggests that a pause or a correction (if the indicator generates a sell signal) in the coming month should not surprise us.
As you see on the monthly chart, the situation developed in line with the above-mentioned scenario as the RSI generated a sell signal. This bearish event triggered a downward move, which took the XOI below the 2008 high. Although an invalidation of the breakout is a strong bearish sign (which usually translates to further deterioration), we should keep in mind that the current correction is still shallow and the oil stock index remains quite near the recent highs. Therefore, we think that it’s worth focus on the medium-term changes and look for more clues about future moves on the weekly chart. So, let’s zoom in on our picture and move on to it.
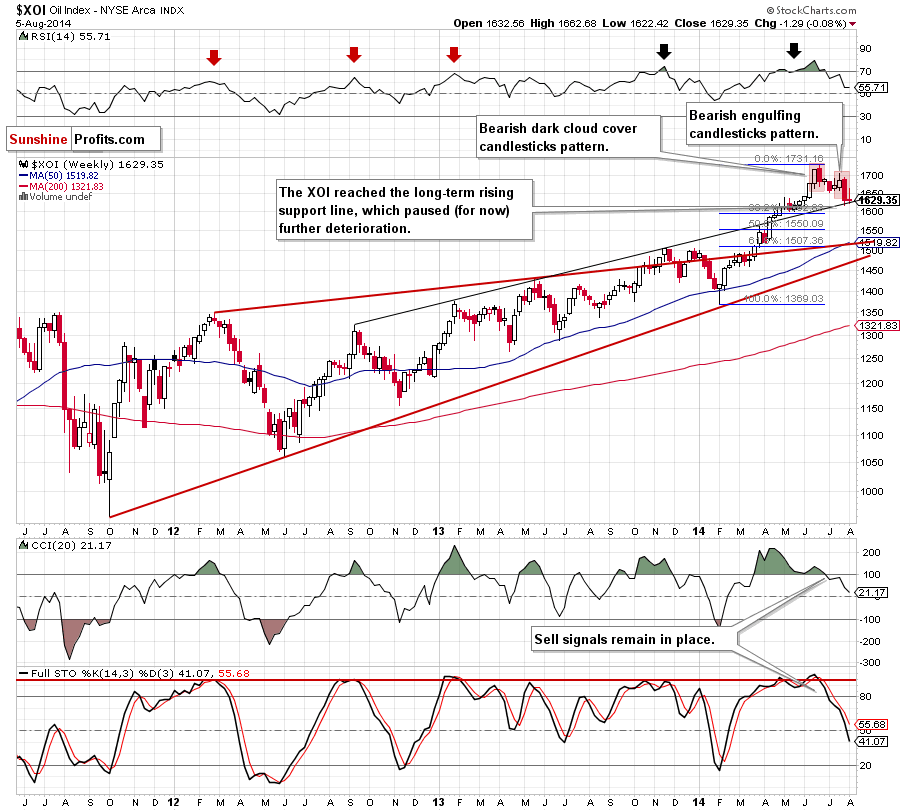
The XOI declined sharply and reached the long-term support/resistance line (marked with black) in the previous week. Because of this downswing, recent candlesticks formed a bearish engulfing pattern, which serves as the nearest medium-term resistance at the moment (around 1,695-1,704). At this point, it’s worth noting that above this area is also another bearish candlesticks formation – a dark cloud cover, which reinforces the resistance level created by the 2014 high. What’s next? If the long-term support/resistance line withstand the selling pressure, we’ll see a corrective upswing from here and an attempt to break above the nearest resistance. However, if it is broken, we’ll see further deterioration and a test of the strength of the psychological barrier of 1,600 in the coming weeks. Please note that this area is reinforced by the 38.2% Fibonacci retracement based on the entire Feb-June rally, which may pause declines. Nevertheless, if it’s broken the next support will be 50% Fibonacci retracement at 1,550.
Having discussed the medium-term outlook, let’s turn to the daily chart.
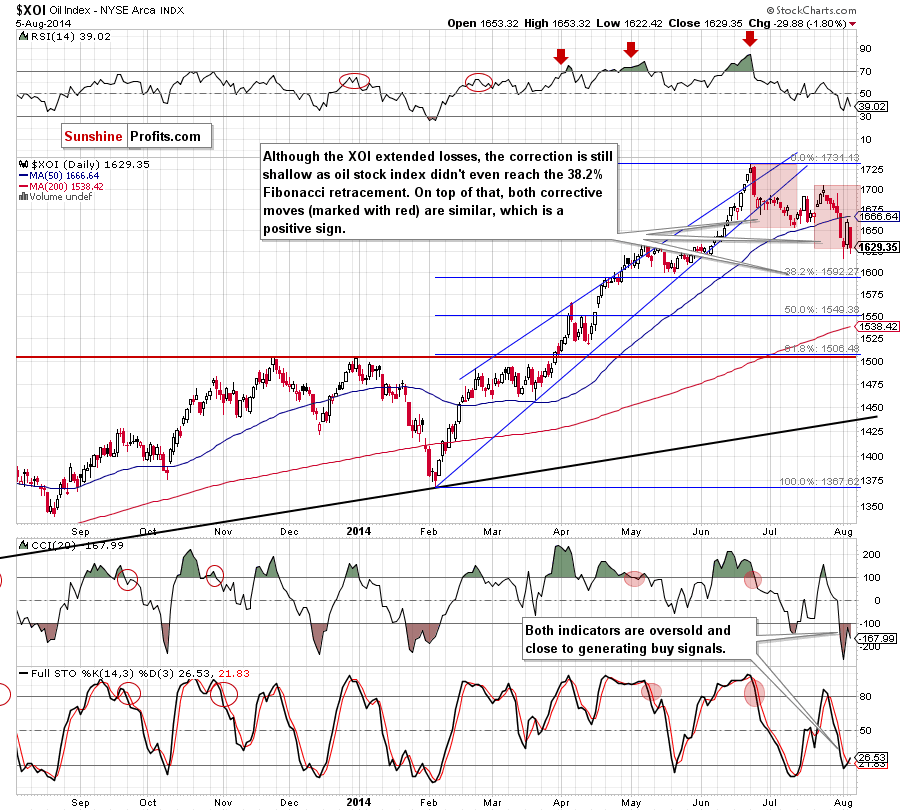
From this perspective, we see that the XOI accelerated declines after a drop below the 50-day moving average, which resulted in a drop to the lowest level since early June. As you see on the above chart, although the oil index rebounded sharply at the beginning of the week, this improvement was only temporarily and the XOI erased all gains yesterday, which suggest that Monday’s upswing was a verification of the breakdown below the 50-day moving average. If this is the case, it will be a bearish signal that could trigger further deterioration and a drop to the 38.2% Fibonacci retracement based on the entire Feb-June rally. Please not that this area is reinforced by the bottom of the correction that we saw in May and the psychological barrier of 1,600, which is slightly above this level. Before we summarize the current situation in the oil stock index we would like to draw your attention to the position of the indicators. As you can see the CCI and Stochastic Oscillator are oversold (additionally the latter generated a buy signal), which suggests that a pause or corrective upswing are just around the corner.
Summing up,, the long-term outlook for oil stocks has deteriorated as the XOI invalidated the breakout above the 2008 high, which triggered a correction to the long-term black support line. As we have pointed out before, if it holds the selling pressure, we’ll see a corrective upswing from here and (at least) an attempt to come back above the 50-day moving average. This short-term improvement is currently reinforced by a depth of the correction (which is still very shallow) and the position of the indicators, which suggests that a pause or corrective upswing are just around the corner.
Thank you.
Nadia Simmons
Forex & Oil Trading Strategist
Forex Trading Alerts
Oil Investment Updates
Oil Trading Alerts
