
Tuesday concerns about the strength of the buyers were unnecessary. Their attack on the strong resistance zone has been effective and the price of light crude oil climbed up to over $102 per barrel which is its highest level since May 2012.
"Investors are taking more risks and are getting ready for Friday's non-farm payroll," said Yusuke Seta, a commodity sales manager at Newedge Japan, adding that traders snapped up oil as the U.S. markets will be closed on Thursday for a holiday.
According to Reuters, traders are waiting for the non-farm payroll figures for affirmation that the economic recovery is on track. It could also give an indication on when the Federal Reserve will start to scale back its bond-buying program.
In today's session light crude slipped after Egypt's armed forces toppled its president, easing concerns over the threat of supply disruptions in the Middle East.
The Suez Canal, a vital waterway for oil shipments, was not affected by the unrest, but analysts said real and threatening supply disruptions in the Middle East, which pumps a third of the world's oil, and in other regions would support prices.
Since we know the important events from the Middle East and the economic calendar let's take a look at the chart and find out how they affected the price of light crude.
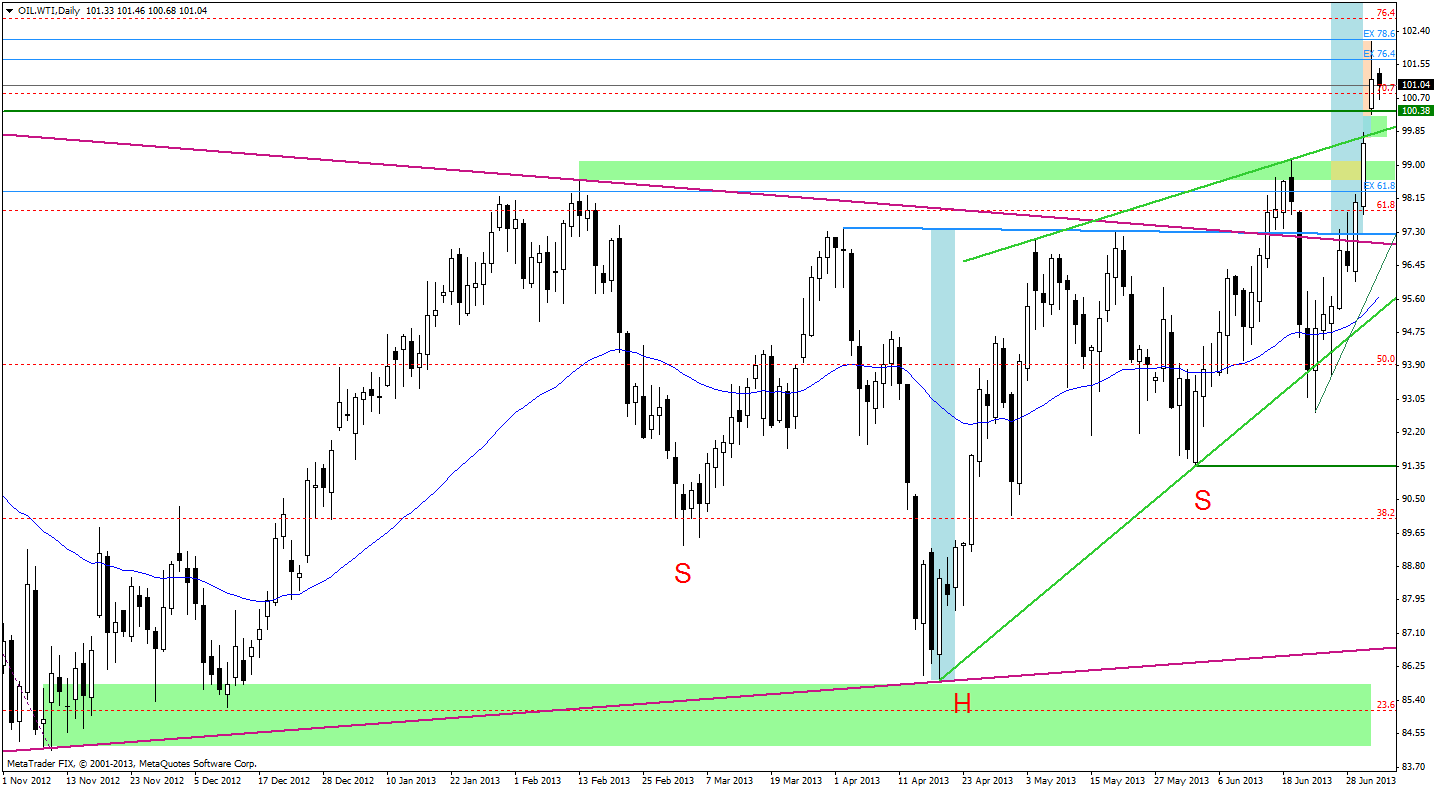
On Tuesday and Wednesday the price continued its rally and reached the level of over $102 per barrel. Without a doubt the most important event of that session was the break up above the resistance level based on the February and April heights.
From the bullish point of view this are very positive circumstances, because the broken resistance zone has become a strong support zone. On the daily chart we see three white candles which negate the bearish candle pattern (the dark cloud cover). The price has soared above the rising resistant line based on the May and June heights (one of the bold green lines) which is also the upper line of the rising wedge. Speaking of breakouts...
When we take a look at the chart from a broader perspective, we see an inverse head and shoulders pattern. The first breakout took place in June, but buyers were not strong enough and the previously mentioned resistance zone stopped them for a while and resulted in declines. However, this time the bulls have managed to take out the resistance level and their situation is better and gives a better basis for further growth. According to theory, the price target for the pattern is around $108.65. Another bullish factor is the gap between Tuesday and Wednesday white candles which creates the first support zone for potential declines. The next support level is based on the February and June heights (the green area on the charts).
Therefore, from this perspective, the situation looks very bullish and brings about optimism.
However, if we want to have a complete picture of the situation, we should take a look at the chart from the bearish point of view. Yes, we have three white candles, but their bodies are getting smaller. OK, this is not a typical bearish advance block because each day didn't open within the previous body but we should notice that the top of the third candle appeared in the resistance zone based on the Fibonacci price projection (light blue levels on the charts) which resulted in a long upper shadow. It may be the first sign of a potential correction and should arouse our vigilance.
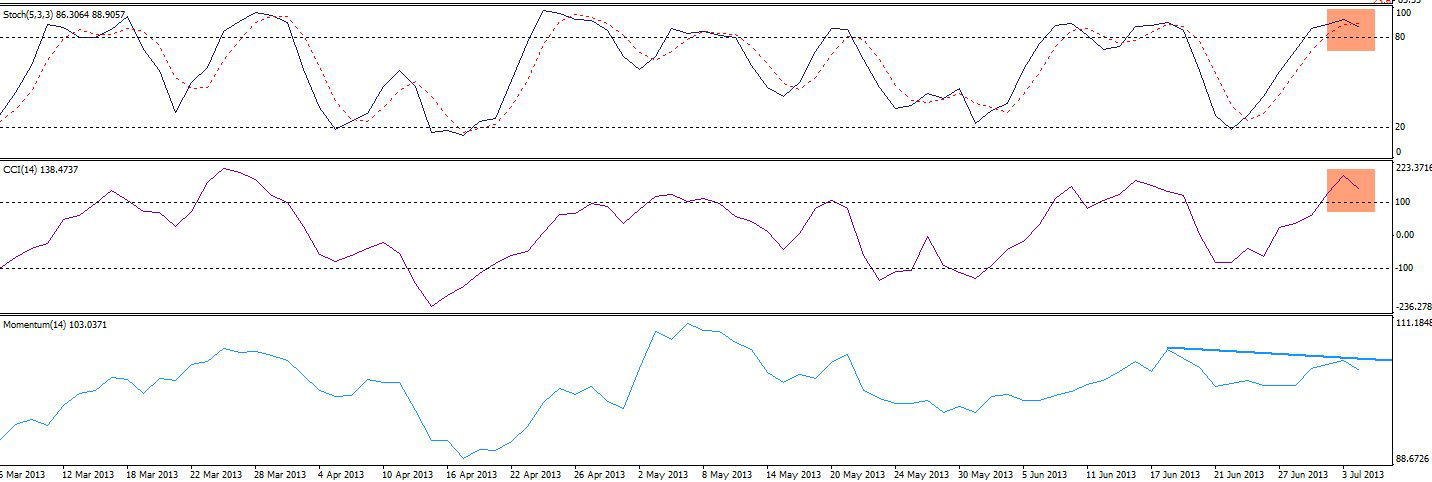
Another bearish factor is the rising wedge (green bold lines). It is a bearish pattern that begins wide at the bottom and contracts as prices move higher and the trading range narrows. It can fit into the continuation category, but mostly it is a reversal pattern and the upward breakout from this rising wedge is unusual because of its rarity. Another factor which suggests caution is the position of indicators. Both the Commodity Channel Index and Stochastic Oscillator support buyers, but they are almost overbought and they have little space for further growth.
At this point, I think that it is worth to take a look at the light crude chart from the Fibonacci perspective to better understand the resistance zones.
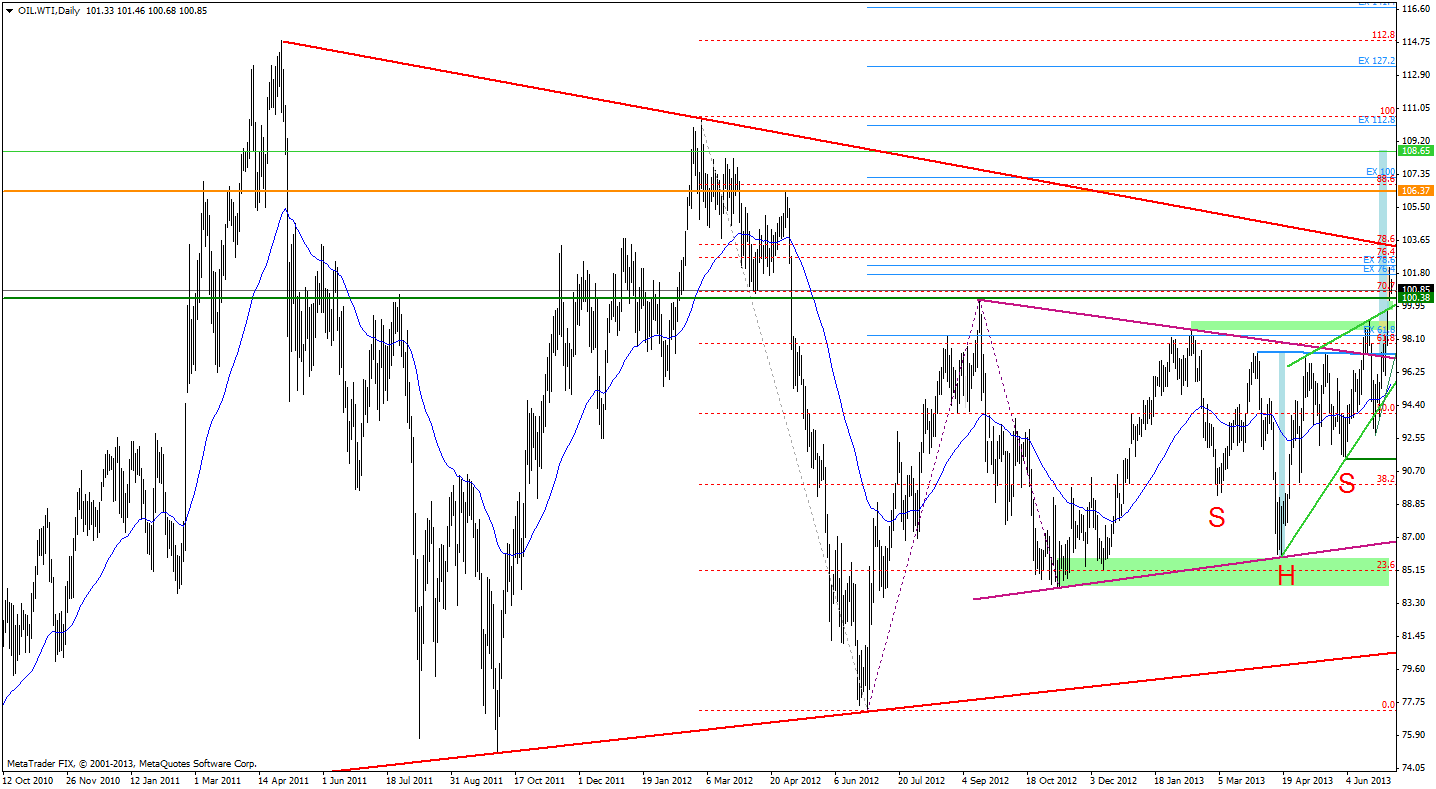
As you see on the above chart there is a previously mentioned resistance zone based on the Fibonacci price projection (light blue levels on the charts). Slightly higher there is another resistance zone based on two Fibonacci retracements - the 76.4% and 78.6% levels. Personally, I treat them as the last stop before a more serious attack on the last peak (in this case - the May 2012 top).
In this place we should also pay attention to the upper resistance line of a large triangle based on the May 2011 and March 2012 heights (the red bold line). Connecting these facts, we see the major resistance zone which might be a strong bearish factor that can slow further growth.
However, if buyers manage to take it out, we might see a further rally to $106.37 where the next strong resistance level based on the May 2012 height and the 100 percent Fibonacci price projection is.
Summing up, the above circumstances make the current situation particularly interesting. We have a lot of bullish factors that encourage further growth: the inverted head and shoulders pattern, the breakout above the strong resistance zone and the price gap. On the other hand, we have some bearish factors: smaller the bodies of white candles, a strong resistance zone based on the Fibonacci price projections, the Fibonacci retracements and the upper limit of the large triangle. Another factor which warrants caution is the position of the indicators (the Commodity Channel Index and Stochastic Oscillator) and the negative divergence on Momentum. On a side note, the conventional interpretation is to use momentum as a trend-following indicator. This means that when the indicator peaks and begins to descend, this can be considered a sell signal.
Connecting the dots, I think the final conclusion will come in the next few days and then we will see whether the current breakout will remain valid and result in increases, or it is false and will lead to a correction of the recent increases.
Thank you.
Nadia Simmons
Back