
This essay is based on the Premium Update posted on May 28th, 2010. Visit our archives for more gold articles.
Since our previous essay dedicated to the general stock market and its influence on the PM sector generated a lot of positive feedback we decided to provide you with a follow-up. However, before jumping straight into the chart analysis, let's focus on the big picture.
McKinsey Global Institute (MGI), prestigious consulting firm, believes India is on the verge of the second-greatest urban migration the world has ever seen. In their new report India's Urban Awakening, MGI says India's urban population could swell to 590 million-nearly twice the size of the United States-by 2030. India would need to build a city the size of Chicago every year for the next 20 years in order to create enough commercial/residential space to meet the needs of its growing population.
MGI says India will have "68 cities with populations of more than 1 million, 13 cities with more than 4 million people and 6 mega cities with populations of 10 million or more."
MGI says the Indian economy is expected to befive times greater by 2030, with urban centers being the key driver of this growth. It projects India's labor force to increase by 270 million-70 percent from urban jobs. This new labor force will also be relatively young compared to other BRIC countries.
While these numbers are amazing, perhaps the most important statistic for us is the projected growth of India's middle class. MGI estimates that India will have 91 million middle class households by 2030, that's more than a 300 percent increase from the 22 million they have today.
Historically, gold has been a preferred form of savings in India as well as in China and many of the other Asian countries. With incomes rising as more people enter the middle class, and with the numbers of the wealthy class increasing, it is more than likely that some of this new found wealth will flow into gold.
While these great, historic changes will take place in the far future, let's take a look at what is in store in the more immediate future. Let's begin this week's technical part with the analysis of the S&P 500 Index. Let's start with the long-term SPY ETF chart (charts courtesy by http://stockcharts.com.)
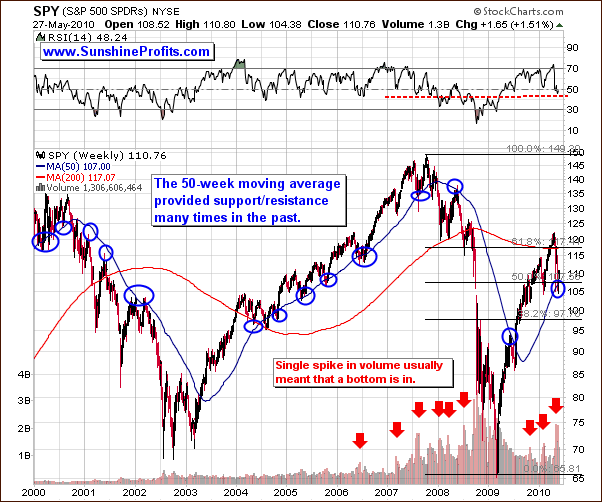
On the very long-term chart above, we see very little change from last week. The implications which need to be re-emphasized here are the support levels which have been reached and the significance of the spike in volume based on weekly closing prices. Thursday's closing level, slightly more than 110, is above the 50-week moving average and also above the 50% Fibonacci retracement level. This is in line with what we expected and reported previously.
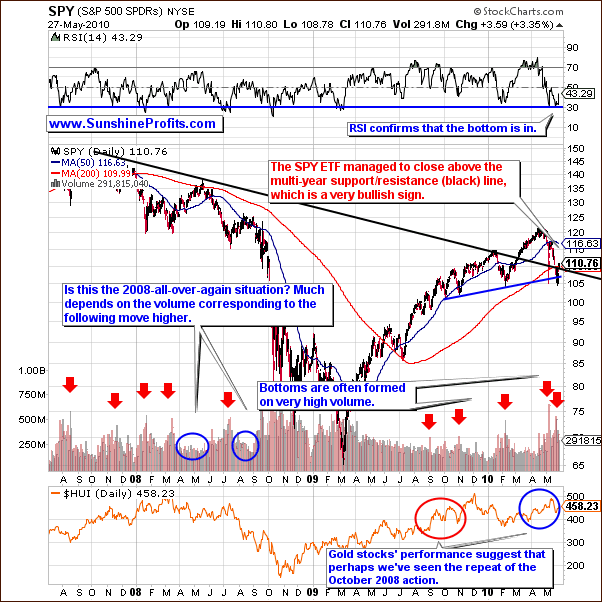
This week we see a rebound in the long-term chart and this move caused the SPY/ETF to close above the declining black line seen above which is the multi-year resistance level. This line has now become a support level. We also see that the close is above the 200-day moving average line in the range of 110. Confirmation that the bottom is in is seen by a spike in volume as well as the low RSI level. Volume levels have not been declining recently (taking weeks into account), similar to what was seen in a 2008 pattern. This indicates that further declines are unlikely at least in the short run. To the contrary, we expect the general stock market to move higher and precious metals to do the same based on the technical signals visible in the above chart.
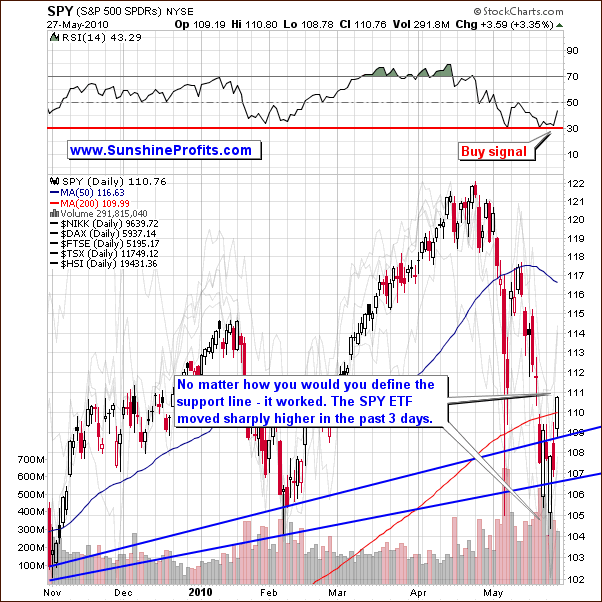
The short-term chart provides us with more timing details. This week we saw huge volatility as the general stock market tested (and verified) its support levels and finally closed above the 200-day moving average. This level is decisively above the rising support lines, regardless of which is selected.
The recent move up was not on huge volume nor were the volume levels extremely low. This trend is common in the early stages of a rally and therefore is not taken to be a bearish sign. This is also confirmed by the RSI level. In short, higher prices for the general stock market appear likely, a bullish short-term sign for precious metals.
Therefore, the general stock market moved up this week as expected and there are signs the rally will continue. Support levels are in place and volume levels indicated some strength in the recent upswing. Furthermore, we do not see some of the negative signs common in past bearish markets. In short, analyses of this week's charts indicate a bullish period ahead for both the general stock market and the PM sectors.
Speaking of the PM sector and stocks, let's take a look at the long-term chart of the HUI Index.
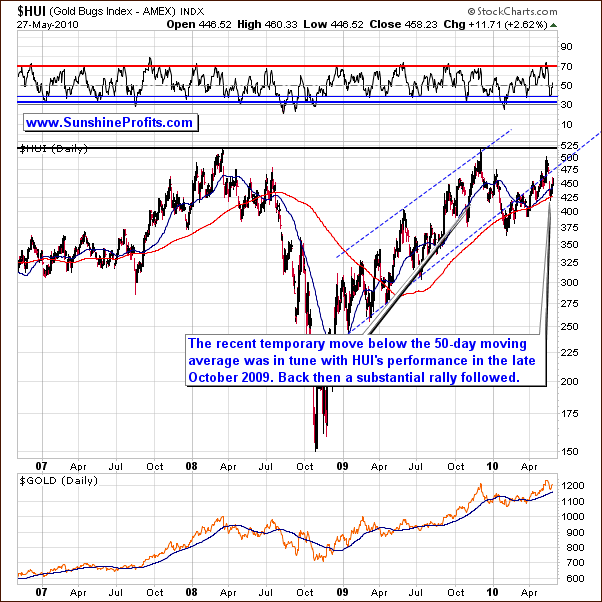
With respect to the precious metal sector this week, the HUI long-term chart last week seemed close to a bottom. It had approached its 50-day and 200-day moving averages and the RSI had moved to a probable low. This suggestion was that a bottom had been reached and a turnaround was likely.
This is exactly what we've seen this week. The fact that it is clearly seen in the long-term chart implies that the turnaround was quite sizable. In the past, when the HUI index moved sharply below its 50-day moving average and the RSI moved below its lower channel, a sharp turnaround with vengeance began a significant rally.
Perhaps this is what we've seen in the past week. The RSI rebounded and the HUI index rose sharply higher after bottoming below the 50-day moving average. If history repeats itself, as it so often does, the HUI index chart suggests that higher prices will be seen in the coming weeks.
One of our indicators (featured below) appears to confirm this point.
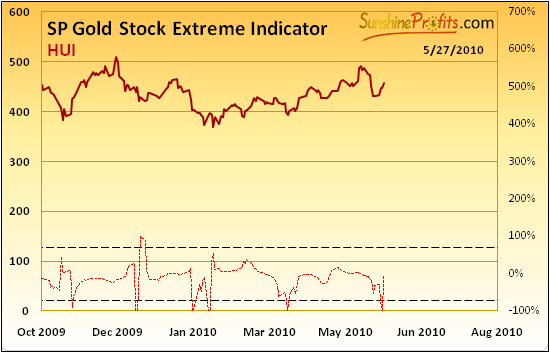
The above chart features our SP Gold Stock Extreme Indicator, which - according to its name - signals tops or bottoms in the mining stocks. This week we've seen this indicator move quickly below its lower dashed line and reversed. This is what we've seen in the past several months when the prices were bottoming, so this is clearly a bullish sign.
Summing up, many tools indicate that the mining stocks are to move higher from here, perhaps just like they did in November 2009. Still, not every part of the precious metals sector is showing extraordinary strength, which suggests caution. For now, we remain cautiously bullish on the mining stocks. Detailed analysis and additional 16 charts are reserved for our Subscribers.
To make sure that you are notified once the new features are implemented, and get immediate access to my free thoughts on the market, including information not available publicly, I urge you to sign up for my free e-mail list. Sign up today and you'll also get free, 7-day access to the Premium Sections on my website, including valuable tools and charts dedicated to serious PM Investors and Speculators. It's free and you may unsubscribe at any time.
Thank you for reading. Have a great weekend and profitable week!
P. Radomski
--
Did we just see the USD put a double top (double bottom in the Euro Index) or was that a confirmed breakout (breakdown)? Did the general stock market bottom or pause in a bigger decline? Which of the above is particularly important for the PM Investors and Traders? Are PMs and mining stocks going higher or lower from here?
These are just a few of the question that we deal with in this week's update. We also provide you with a follow-up on the answer to the "is this the 2008-all-over again" question with emphasis to gold. We explain how gold could react if the main stock indices decline severely, and what would confirm that such a move is in the cards.
This week we feature 21 charts including: USD and Euro Indices, stock indices, precious metals correlation matrix, gold, gold from the non-USD perspective, silver, HUI Index, GDX ETF, Gold Miners Bullish Percent Index, silver:gold ratio, and GDX:SPY ratio. Additionally, we comment on our unique indicators, several of which have recently provided important signals for PM Investors and Traders.
Additionally, we feature news regarding the North Korea, China, Euro-zone, and India. We encourage you to Subscribe to the Premium Service today and read the full version of this week's analysis right away.
