
Based on the February 3rd, 2012 Premium Update. Visit our archives for more gold & silver articles.
This December gold prices swooned by more than 10 per cent in their biggest monthly fall since the collapse of Lehman Brothers. For some insecure gold investors it was like a bad dream. They were happy to wake up to a bright, crisp January whose performance was more than enough to warm the heart of any gold investor. It was the metal's strongest starting month in 32 years giving a resounding answer to those who wondered if the 11-year rally in gold had ended (and they always seem to come out of the woodwork every time gold experiences a correction.)
Gold rose 11 percent in January, taking off like an Olympic hurdle racer easily jumping over the obstacles along the way for the largest gain for the month since 1980. The financial press attributed the rally to the regular list of "round up the usual suspects": a Federal Reserve commitment to keep U.S. rates near zero, dollar weakness, investor and consumer demand and central bank purchases.
On Tuesday, the last trading day of the month, the market produced a technically bullish monthly high close, and on Wednesday, gold prices climbed even higher only to continue its ascend Thursday to reach $1760 per ounce. Some gold investors are even starting to think that gold may post fresh highs this year sooner than later.
There is no question that the Fed announcement that interest rates would be held at current levels through to the end of 2014 helped fuel the rally. The market took into consideration that gold investment in this environment would pose no missed opportunity cost since the dollar will earn nothing, so risk assets should outperform dollar deposits.
The almighty US dollar (not so mighty anymore) is not the only answer to explain the strength of the rally in the precious metals sector. Earlier this week, we focused on the technical situation in the mining stocks and in this essay we will continue with this topic. Lets start with the HUI Index chart (charts courtesy by http://stockcharts.com.)
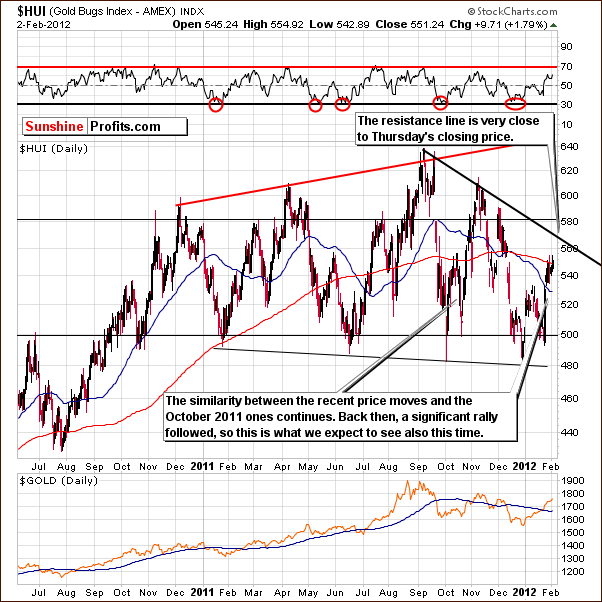
In the long-term HUI Index chart, we see that the index has rallied sharply and is now approaching a resistance line. So far this year, its performance has been quite similar to what we saw last October, when a pause was not seen until the 580 level was reached. Back then, however, there were no resistance lines in play prior to reaching that level. This is not the case today as there is a declining resistance line created by previous local tops. It therefore seems likely that the current rally will top around the 570 level.
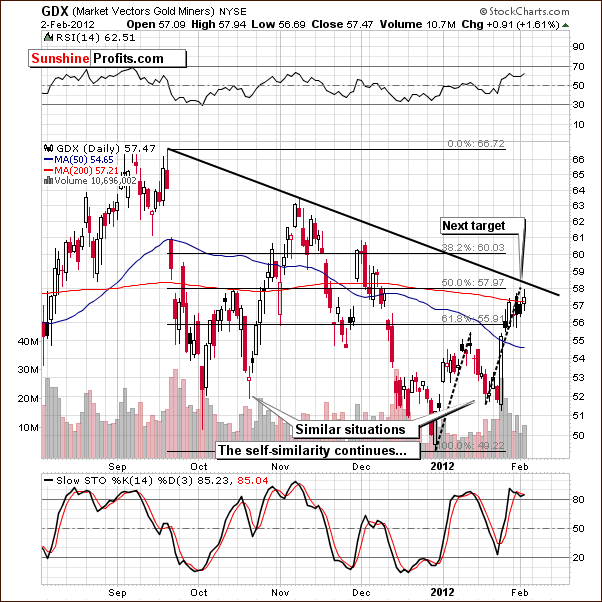
In the short-term GDX chart, we see that miners are close to reaching our defined target level for this rally. In our last essay on gold and silver mining stocks (31st January, 2012), we stated that:
The recent decline took miners to the October 2011 level. If the correction is over, then expect a move to the upside similar to the previous one. Calculating the medium-term resistance line brings us to a likely target around $58.
The miners appear to be heading to the $58 level where the declining resistance line and the 50% Fibonacci level coincide. Once this short-term resistance line is reached, a pause in the rally is probable after which an additional period of rally seems likely.
The shape of this rally is almost an exact self-similar pattern compared to last October.
Mining stocks are quite close to their resistance line, but if gold and silver rally from here, then miners will likely move higher as well. However, the maximum price that we see GDX achieving without correcting first is $60 (the upper Fibonacci retracement level).
The additional confirmation of the coming correction comes from the Gold Miners Bullish Percent Index.
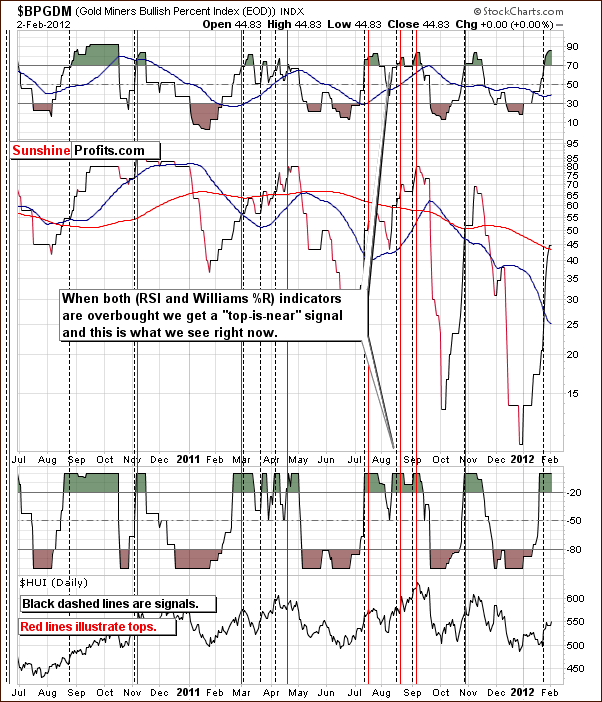
On the above chart we continue to see that both the RSI and the Williams %R are overbought and consequently a top is near signal is in place. In fact, a local top now appears to be just around the corner. Please note that whenever both indicators based on the index (main part of the chart) became overbought a local top in gold stocks soon followed as seen at the bottom of the chart.
Having discussed big senior mining stocks, lets take a look at the small, low-cap juniors.
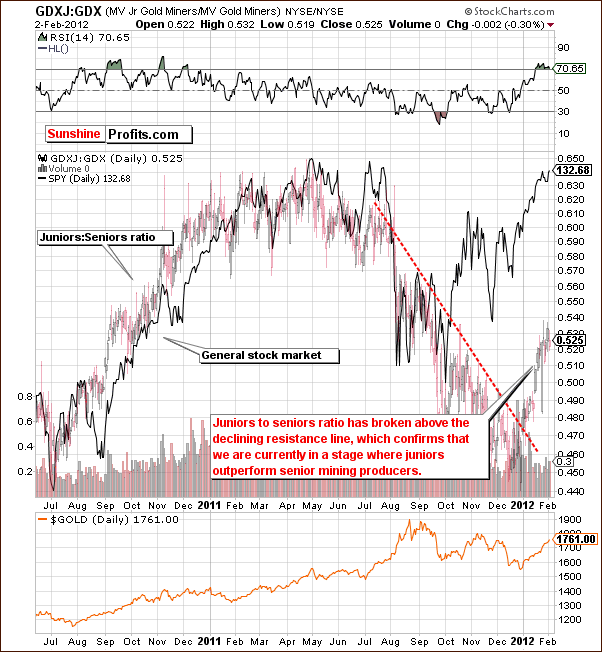
In the GDXJ:GDX ratio chart, we see how juniors (GDXJ being the proxy for the sector) are performing compared to seniors (GDX being the proxy for the sector). The ratio here has broken out above the medium-term declining resistance line and rallied sharply. Juniors are now outperforming seniors and this is consistent with the outlook which we have discussed in our reviews of the sector over the past few months. It is a situation which will likely continue for the month ahead as well.
Summing up, the medium- and long-term outlook for the gold and silver mining stocks is positive, however a correction is likely to be seen soon perhaps it will start next week. Long-term investors should consider purchasing junior mining stocks, while short-term traders might want to trade the coming correction. The full version of this essay includes trading details (upside and downside price & time projections for gold, silver and miners) and the ranking of top gold and silver juniors, so if you've been considering trying out our Premium Service, it appears to be a good idea to do so now.
Thank you for reading. Have a great weekend and profitable week!
P. Radomski
--
Gold moved lower today after an almost uninterrupted rally in the past month - is this the beginning of another downleg and how low can gold slide? Or can gold move even higher before the next local top is seen? What about silver and mining stocks? Today's Premium Update includes in-depth analysis of the short- and long-term situation in the whole precious metals sector along with critical details necessary to make the most of the current trade - we provide you with upside price targets for gold (spot gold, GLD), silver (spot silver, SLV) and mining stocks (HUI, GDX). Moreover, we let you know how long can the coming correction last and how low can gold, silver and miners fall.
In today's Premium Update we thoroughly analyze the situation in the USD and S&P 500 indices. Today's situation in stocks is remarkably similar to what has already happened in the past which allows us to provide price targets (and price path) with significant confidence. The situation in the USD Index is analyzed not only through examination of the USD Index itself, but also through the Euro Index.
Additionally, today's Premium Update includes up-to-date top gold and silver junior rankings.
We encourage you to Subscribe to the Premium Service today and read the full version of this week's analysis right away.
