
There are several indications that the currency war is heating up, the gloves are coming off and new players are piling into the barroom brawl. First, Australia unexpectedly cut interest rates, then both the Swedish and New Zealand central bank governors were making their moves. Way down under, New Zealand’s central bank last week acknowledging that it had intervened in foreign exchange markets to try to fight any further appreciation of the country’s currency, known as the kiwi. The New Zealanders are worried about a runaway property market driven by global money rushing into the country.
Wait a minute... that’s exactly the same scenario in Israel.
This week the Bank of Israel stepped up its efforts to curb the appreciation of the shekel surprising the markets by unexpectedly cutting its interest rate and announcing a program to purchase foreign currency. A weaker currency boosts exports, driven by cheaper prices. The smaller economies are reacting to all the quantitative easing by the world’s large economies.
Israel’s central bank, headed by Stanley Fischer, one of the most accomplished central bankers in the world, cut the key interest rate by a quarter of a percentage point to 1.5% to a three-year low.
Fischer told Bloomberg that the move came “in light of the continued appreciation of the shekel, taking into account the start of natural gas production from the Tamar gas field, interest rate reductions by many central banks – notably the European Central Bank, the quantitative easing in major economies worldwide and the downward revision in global growth forecasts.”
Despite the global financial threats, the Israeli economy is still in the black and healthier than the economies of many European countries. The shekel has risen by nearly 9% over the past six months, making it one of the best-performing currencies in the world, after the Mexican peso. Israel’s central bank also plans to buy around $2.1 billion in foreign currencies.
Israel's economy is heavily dependent on exports, and a strong shekel weakens the competitiveness of Israel's products abroad.
It was Japan this year that shot off the latest round in the currency war after announcing monetary stimulus of historic proportions. Recent steps by the world’s third-largest economy have become a central concern. The impact of the country’s aggressive new monetary policy has been making central bankers around the world lose sleep. Is the Bank of Japan trying to influence exchange rates to give its exporters an advantage? Other countries might react in kind, which is exactly what happens in currency wars.
Actually, this is not surprising to us. The global increase in the money supply and lowering of interest rates is not surprising because countries will have to keep doing that in order to keep their exports competitive. It is a currency war and those who inflate first, get the most benefits. They are short-lived because other countries will follow and the ultimate result will eventually be huge inflation on a global scale, but, again, on a short-term basis, the monetary authorities are pressed not to stay behind others. The comments about the lack of currency war are not surprising either. Speaking publicly about it would simply encourage other countries to join it sooner, and those that are already printing more money don’t want that to happen as it means that the above-mentioned advantage that they gained would disappear.
Implications for gold? Bullish in the long run, nonexistent in the short run.
As we can see, the great fundamental outlook for precious metals is intact. Let's move on to the chart section of today’s essay to see how gold’s current technical situation looks like and therefore how gold can trade in the following weeks. Before we proceed to the yellow metal itself, let us begin with the Euro Index long-term chart (charts courtesy by http://stockcharts.com.)
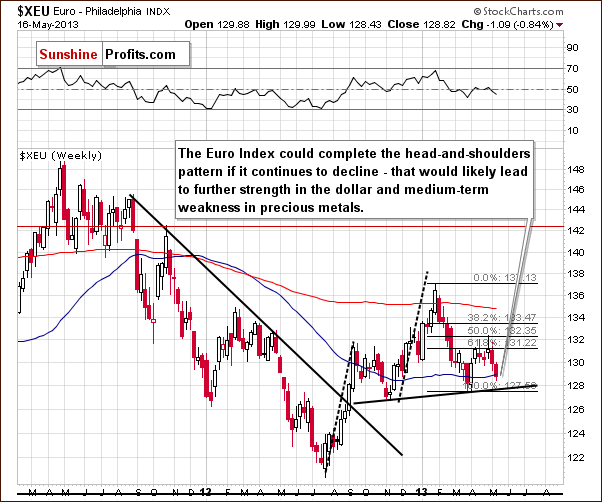
The index has declined for the past two weeks and it seems now that we should consider the possibility that the head-and-shoulders pattern will be completed here. Such a completion would take the Euro Index much lower.
The size of the projected decline after the breakdown and completion of the pattern is roughly the same size as the height of the head in the pattern. If this decline is attached to where the breakdown occurred, the projected downside target level will be about equal to the 2012 low (in the 121 – 122 area). Such a move would likely contribute to a USD Index rally. All of this could also be bearish for gold in the medium term if it all does indeed materialize.
Let’s move on to gold’s very long-term chart now.
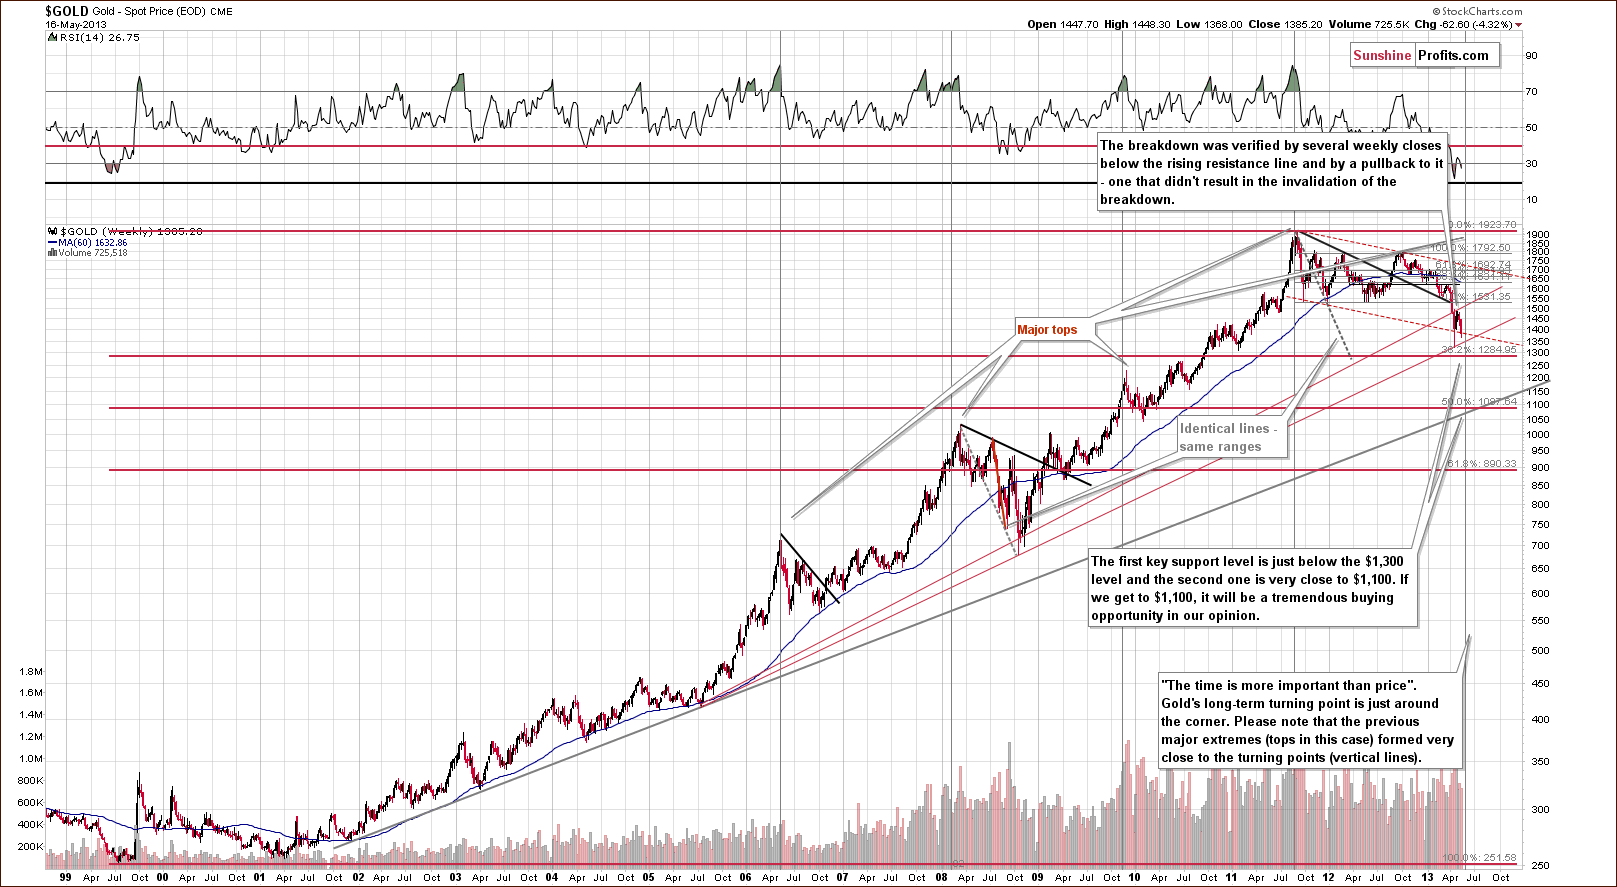
In this chart, we see a situation quite similar to the declines to 2008, where a sharp pullback was followed by a continuation of the severe decline. The most bearish factor here is the shape of the decline, which is a reverse parabola. This formation results in accelerated declines and makes it difficult to tell how low prices will go. Although the declines will likely end shortly, the increased volatility could result in prices moving very low quickly while still being in tune with the trading pattern. This reverse parabola has been in place since last October.
The very long-term cyclical turning point suggests that a local bottom will be seen soon – within the next month, probably about 2 weeks from now. Keeping both of these factors in mind, we should prepare for even bigger declines.
Let us have a look at the Dow to gold ratio chart, as an important technical development took place there.

Here, we saw an important breakout above the declining long-term resistance line. This has bearish implications for gold. Please note that the breakout above the previous – much less significant – resistance line (the red declining line on the above chart) was followed by major declines in gold.
The next resistance level for this ratio is at 12.5 and with it currently at 11, declines in gold will surely be needed in addition to higher stock prices in order for the ratio to move this much higher (it seems that a move higher in the general stock market will not be enough for the ratio to move that high soon). The implications are, of course, bearish.
Summing up, the situation remains bullish for the USD Index. The recent declines in the Euro Index along with the breakout in the USD Index will likely keep the current bullish outlook in place for the coming weeks. The implications of the bullish situation here, especially for the medium term, are bearish for the precious metals. Gold prices declined last week and pulled back on Thursday but it still does not seem that this period of decline is completely over. If you're interested in our preferred way of taking advantage of the current turmoil on the previous metals market, please consider joining our subscribers.
Thank you.
Sincerely,
Przemyslaw Radomski, CFA
P.S. We encourage you to take our reader satisfaction survey if you have not yet done so - it should only take a few minutes and it will make us serve you better.
Back