
Based on the February 22nd, 2013 Premium Update. Visit our archives for more gold articles.
Gold roller coaster seems to go on and on without an end. But what we have seen this week was more of a bungee jumping. However, at this time there seems to be no more room for further declines, as major support lines have been reached already or are about to be reached. Does this mean that we are close to the final bottom and that a strong rally will emerge soon? Let us jump straight into the technical part of today’s essay to find out – we’ll start with the yellow metal’s long-term chart (charts courtesy by http://stockcharts.com.)
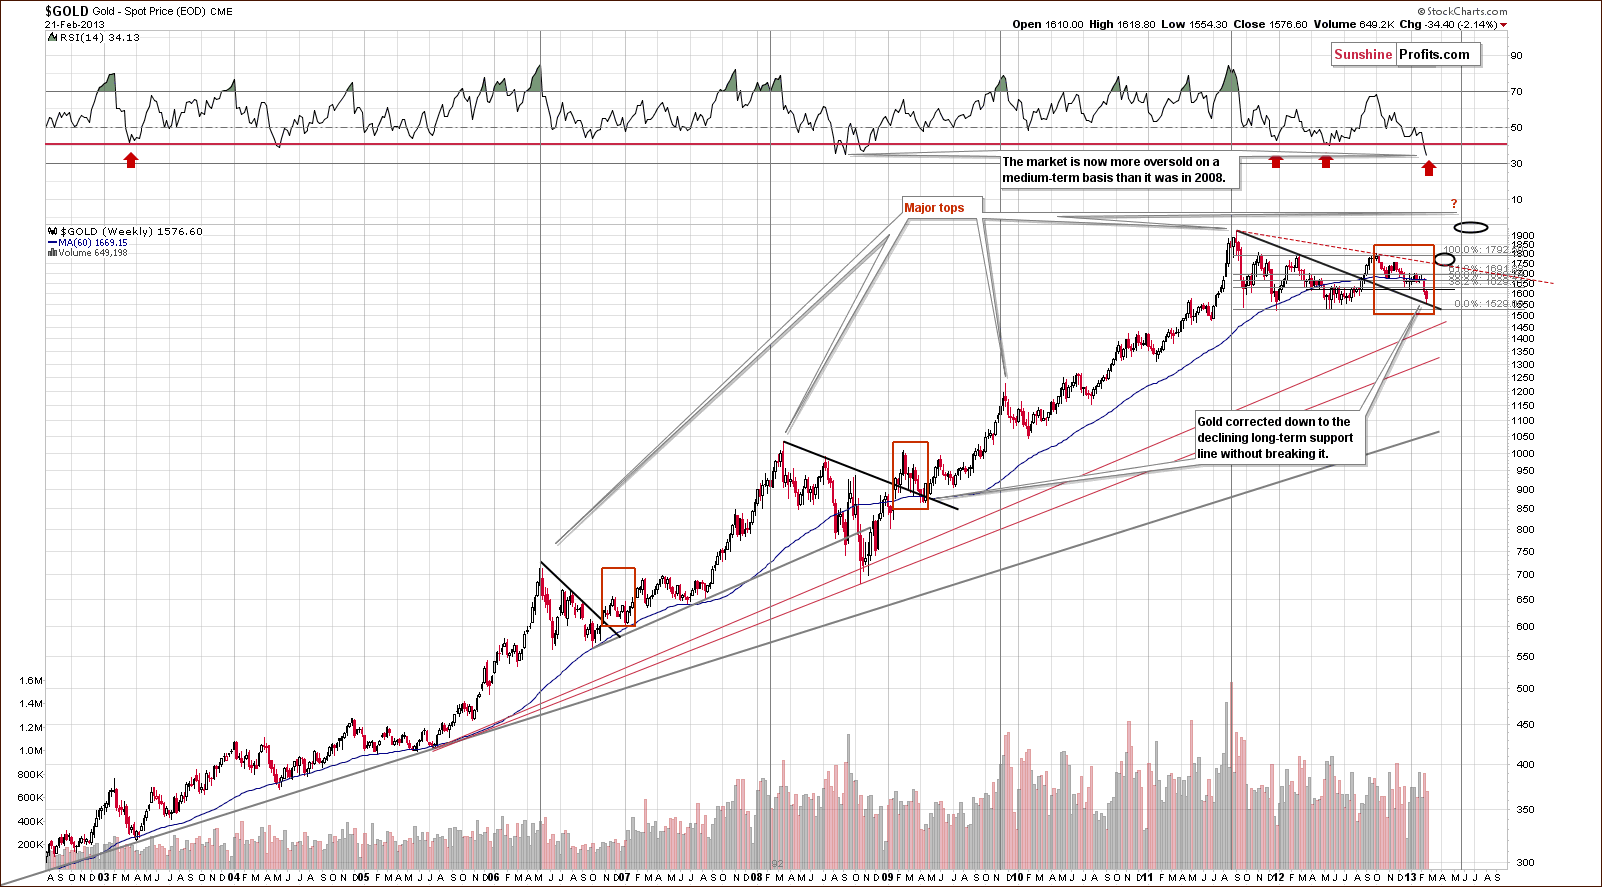
The most interesting point in this chart is not that prices moved to the long-term support line and reversed but rather the current RSI level, based on weekly closing prices. It is the most oversold since the beginning of the bull market and is now more oversold than after the 2008 plunge.
This is a huge deal. Even based on the above alone, the bottom could be in for gold prices. Since the long-term support line has been reached, the medium-term bottom is probably in, and prices are likely to rally in the months ahead. It seems that perhaps a major top will be seen close to mid-2013.
Let’s see how the situation looks like from the non-USD perspective.
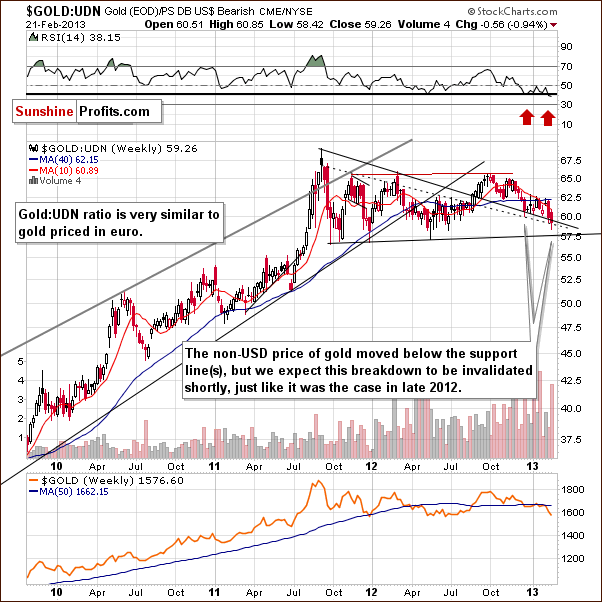
We continue to see a somewhat bullish picture here. Extensive consolidation has been seen after the 2012 breakout. Gold moved below the declining support line this week and while the situation looks a bit discouraging, we expect the recent breakdown to be invalidated – likely today. The support line currently in play has held declines for several months now with only one previous quick dip below it which was invalidated towards the end of 2012.
Now, let’s take the Canadian Dollar perspective which yields yet another encouraging analogy with 2008.
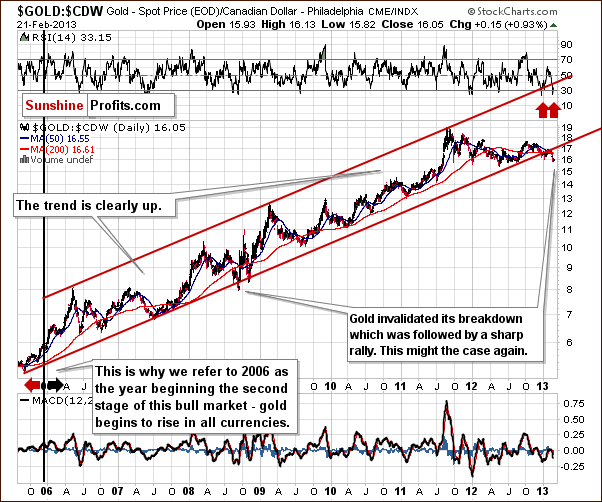
In this chart, we see that prices are now below the trading channel, much the same as was seen in 2008. That move was followed by a strong move to the upside, and with the situation heavily oversold here today, we expect prices to move back into the trading channel and rally sharply as we saw in 2008. Note the extremely oversold RSI levels - see the red arrows in our chart.
Finally, we would like to address one of our subscriber’s questions regarding a death cross technical formation on the gold market. Supposedly, it is a herald of doom for gold investors, but we would like to confront this belief with cold facts.
Q: Could you please address whether we need to be concerned about the recent golden death cross technical formation. Thanks.
Thanks for the daily market alerts! They are very helpful, especially during these trying times!
A: We discussed the death cross in gold in April, 2012 and here's a quote:
Yes, we do have something to say about the death cross in the precious metals market. Something quite to-the-point:
It doesn't work.
To be precise, in our opinion, it doesn't work as signaling a good moment to sell gold or silver. Actually, in most cases it was a very reliable buy (!) signal. Here are the moments where the death cross was seen in gold during this bull market:
End of Q2 2004 - right after a major bottom and before a big rally (lower prices were never seen after that bottom); Mid-2005 - right before a major bottom and before a huge rally (lower prices were never seen after that bottom); Beginning of Q4 2006 - right after a major bottom (lower prices were never seen after that bottom); Q3 2008 - in the middle of the 2008 plunge.
Which of these four scenarios is the odd one? The last one marked neither a good buying point nor a good exit point - it was right in the middle of the extraordinary decline. In all other cases the death cross was a bullish development.
Summing up, 3 out of 4 cases where the death cross was seen were great moments to buy and the 4th one was neither a good nor bad moment to buy.
Therefore, the implications of a death cross are actually bullish.
In reality, gold did move lower in the weeks following the above comment despite the bullish impact of the death cross (it sounds weird, but that's how it used to work), so we now have 3 out of 5 moments that were great times to buy gold, one average moment and one before a not-so-deep decline. It's still not bearish.
By the way, please keep in mind that we have a search function on our website (top right part of the page) that works very well - it breaks the results into sections and can you can also filter them by dates. We will happily reply to questions in this section of updates and the , but we are naturally not able to provide answers 24/7, and our search engine can do it instantly. You can try searching for “death cross” and you will find, for instance, similar comments for the silver market.
Summing up, support lines are in play for two out of three of this article’s gold charts and it’s likely that a local bottom has indeed formed. Additionally, RSI levels indicate an oversold situation. The outlook for gold from here is bullish.
Today's Premium Update on which the above article is based, provides clear trading suggestion that should help you make the most of this critical situation in gold, silver and mining stocks. This is not the time to panic, nor to be extremely optimistic - it's time to consider major factors that are currently in play and take advantage of them. We encourage you to join our subscribers and read this week's Premium Update. As our premium subscriber, you will also start receiving daily market alerts that our current subscribers particularly value during these volatile times.
Thank you for reading. Have a great weekend and profitable week!
Sincerely,
Przemyslaw Radomski, CFA
