
Based on the December 30th, 2013 Premium Update. Visit our archives for more gold articles.
In our Dec. 20 commentary, we discussed the outlook for the USD Index, Euro Index, and how these currencies were likely to impact gold. We summarized the essay by writing that the situation was bullish for the USD Index, and bearish for the euro. We wrote that the implications for gold were bearish. That was 10 days ago and we haven’t seen any big price swings since then (except for an intra-day decline in the USD Index, but we will move to that in just a few paragraphs). Has anything changed? Was there any kind of confirmation or invalidation that would increase the bullishness of the situation for gold? Or, perhaps, the situation is even worse now than it was before (despite a small move higher)? Let’s take a look (charts courtesy of http://stockcharts.com).
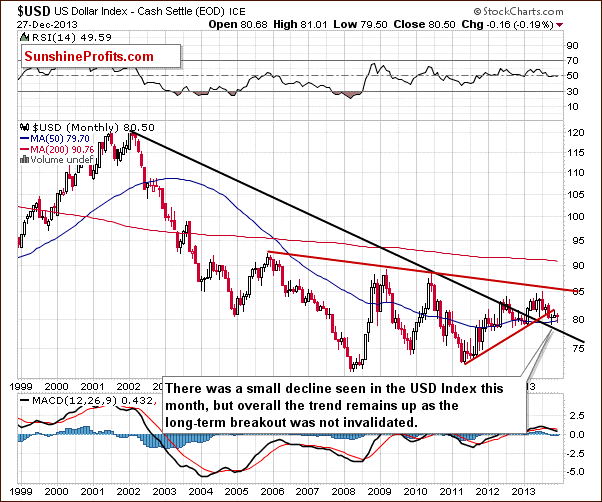
From the long-term perspective, the outlook hasn’t changed at all and what we wrote on Dec. 20 remains up to date.
Despite a small decline that we have seen since the beginning of the month, the uptrend remains in place as the breakout above the declining long-term support line was not invalidated.
Now, let’s examine the weekly chart.
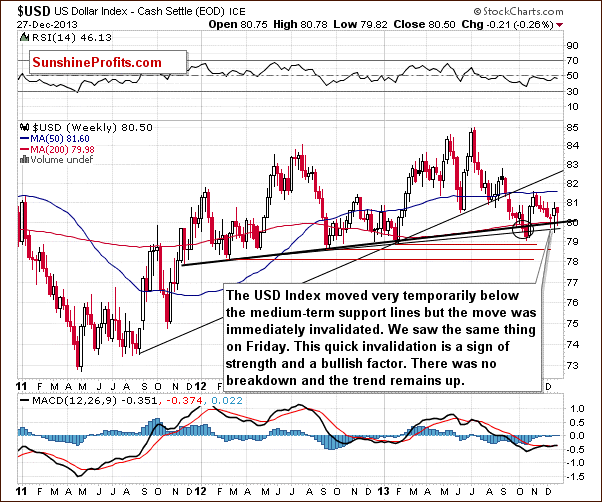
Looking at the above chart, we see that at the end of the week we had a situation similar to those that we saw earlier in December. Like a week ago, the USD Index broke below the medium-term support line based on the February 2012, September 2012 and January 2013 lows (bold black line), but once again this deterioration was only temporary. The dollar quickly rebounded and invalidated the breakdown below this medium-term support/resistance line, which is a sign of strength and a bullish factor. At this point, it’s worth mentioning that this time the USD Index didn’t decline to the lower medium-term line based on the September 2012 and January 2013 lows (thin black line), which confirms the strength of the buyers. From this perspective, there was no true breakdown and the trend remains up.
Let’s check the short-term outlook.
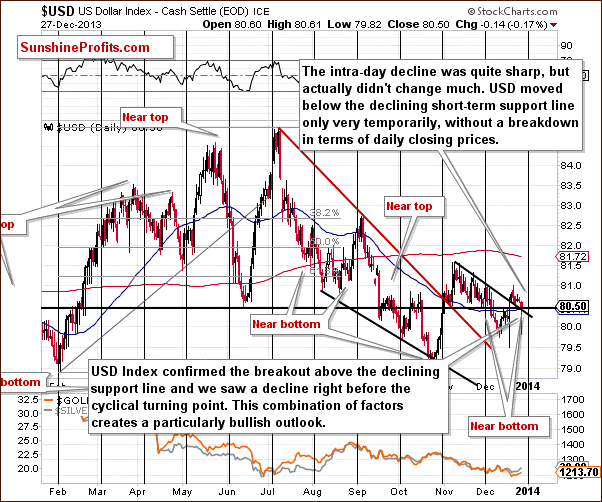
Looking at the above chart, we see that the USD Index extended its rally and moved higher breaking above both resistance lines (the horizontal support line based on the June low and the declining short-term resistance line) after our previous article was published. Although the greenback gave up the gains and declined in the following days, it confirmed the breakout above the declining short-term support/resistance line. At this point, we would like to draw your attention to the fact that although Friday’s intraday decline was sharp, it actually didn’t change much. The U.S. dollar moved below the declining short-term support/resistance line only very temporarily, without a breakdown in terms of daily closing prices, which is a positive signal. On top of that, this decline materialized right before the cyclical turning point.
This combination of factors creates a particularly bullish outlook and it could be the case that another rally in the U.S. dollar is just starting.
Let’s now take a look at the long-term Euro Index chart.
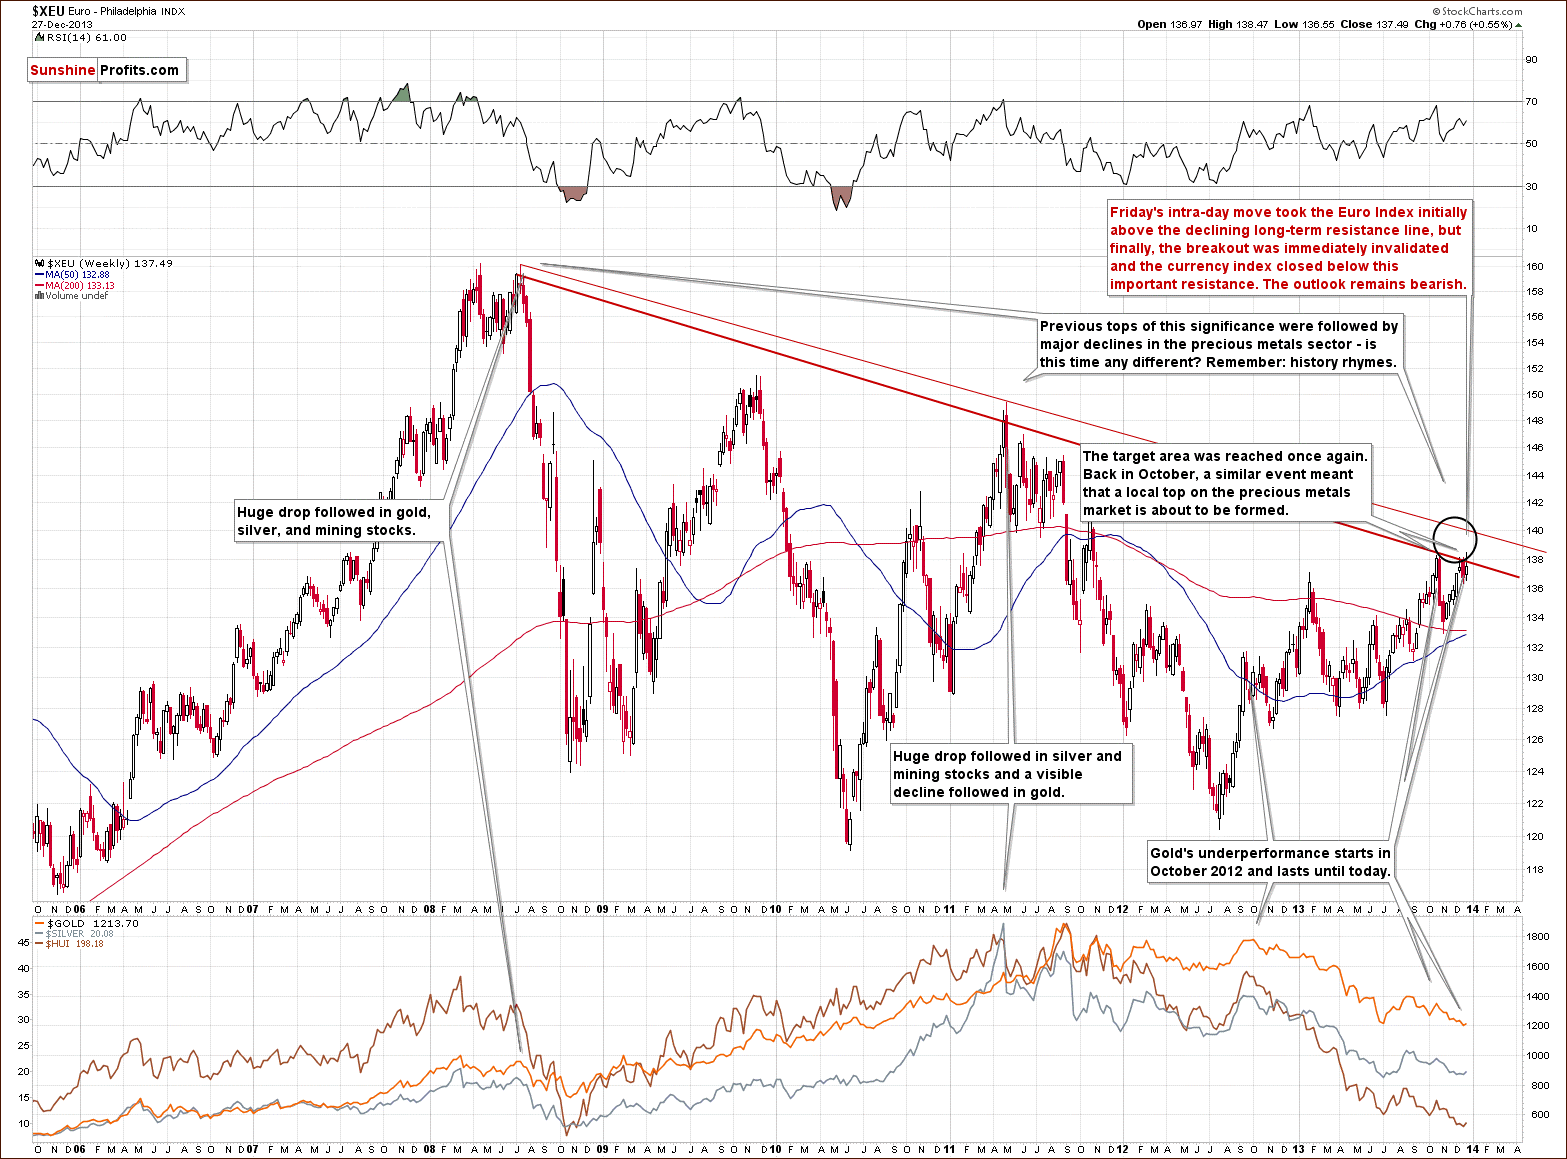
The first thing that catches the eye on the above chart is the target area, which was reached once again. As you can see on the above chart, Friday’s intraday move took the Euro Index not only above the October high, but also the long-term declining resistance line based on the 2008 and the 2011 highs (in terms of weekly closing prices). However, as it turned out in the following hours, this improvement was only very temporary and finally, both breakouts were immediately invalidated. The currency index closed below these important resistance levels, which is a bearish signal and the outlook remains bearish.
What’s most interesting, gold didn’t follow that rally, which suggests that we’ll likely see further deterioration – similarly to that seen in the past.
In our previous article, we wrote the following:
(…) a similar situation preceded a local top in precious metals. On top of that, previous tops (in 2008 and then in 2011) were followed by major declines in the precious metals sector. If history repeats itself we may see similar price action in this situation.
Please take a moment to compare the euro’s performance in the past few weeks with the performance of the precious metals sector (lower part of the above chart).
Let’s take a look at our Correlation Matrix to find out how the above may translate into precious metals and mining stock prices.
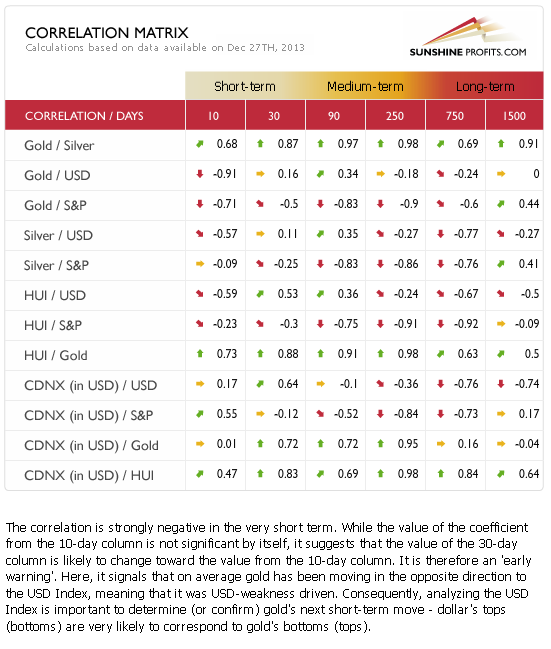
The values of the correlation coefficients are basically unchanged from last week, so we will quote our previous comments – they are up-to-date.
Basically, the short-term numbers don’t tell us much at this time when we look at them directly, but can tell us something if we look a bit beyond them.
The correlation between the USD Index and the precious metals sector is slightly positive in the 30-day column (and even moderately significant in the case of the mining stocks), which tells us that in the past 30 days PMs and the USD Index moved on average in a similar direction. However, this was the case when they both declined – and when USD moved higher (this week), metals and miners declined even more. This is a very bearish combination – whatever USD does, the precious metals sector seems to either decline modestly or strongly.
Overall, the implications for the precious metals sector are bearish.
Having discussed the bearish impact from the currency markets (actually, even more bearish than last week because of the proximity of the cyclical turning point in the USD Index), the question remains if anything changed in case of the gold market itself.
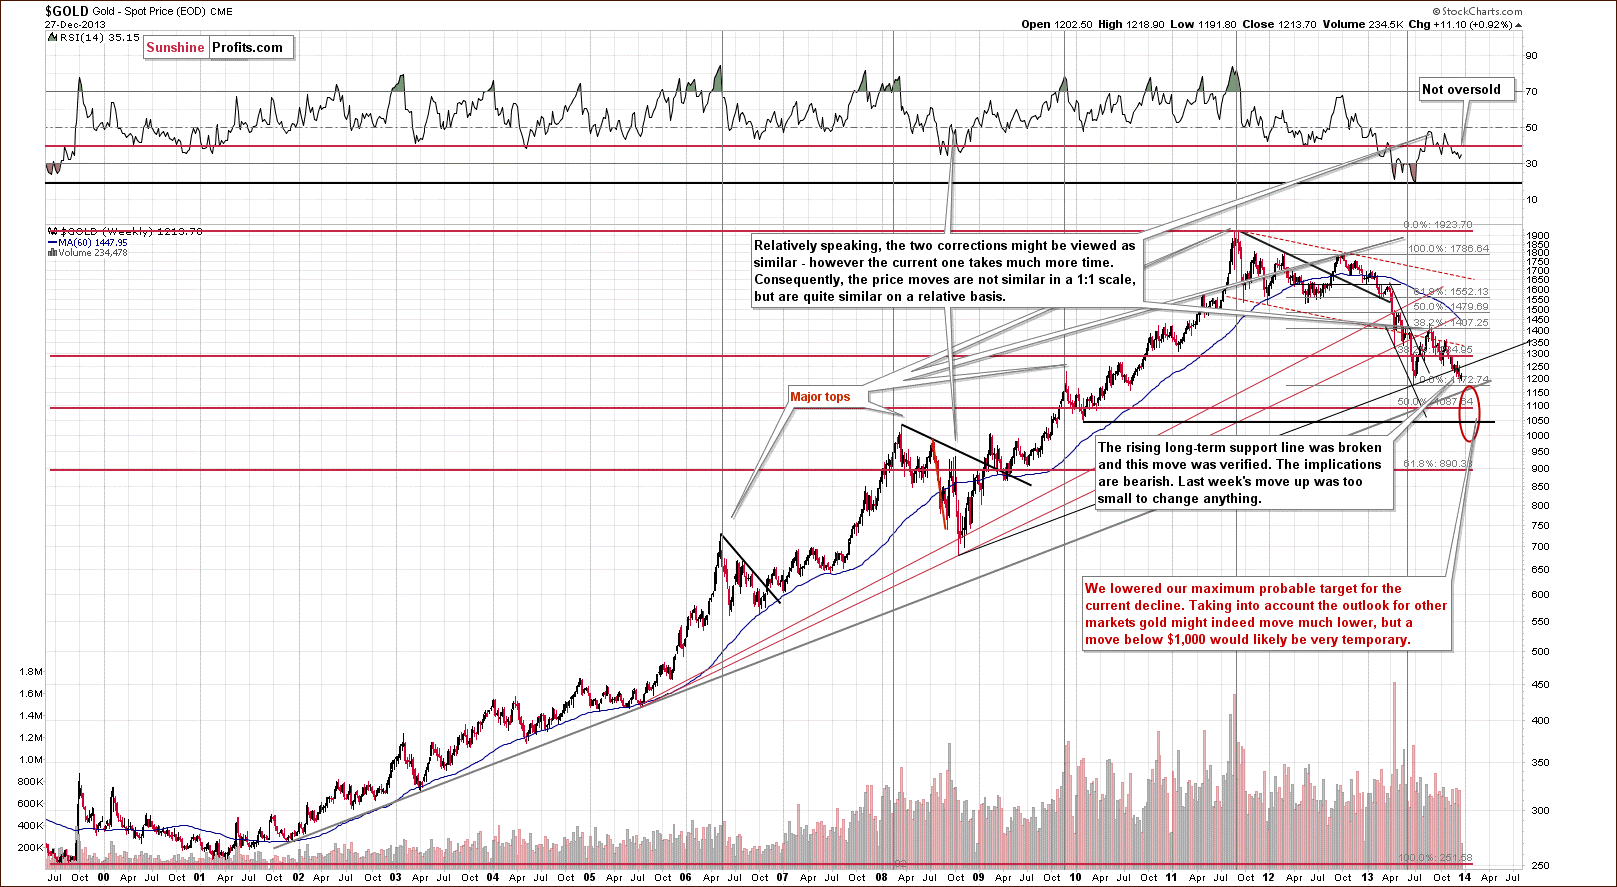
Not really. Generally, from the long-term perspective not much changed on the gold market. What we wrote in our previous article remains up-to-date as the breakdown below the rising long-term support/resistance line was not invalidated:
Gold didn’t manage to successfully climb above the rising long-term support line (not to mention staying above this line), which triggered a sharp decline. With this downward move, the yellow metal not only declined below last week’s low, but also slipped below the level of $1,200. These circumstances clearly show the weakness of the buyers and it seems that the previous 2013 low will be reached quite soon.
(…)
Please note that the exact target for gold is quite difficult to provide. In the cases of silver and mining stocks there are respectively: combinations of strong support levels, and a major support in the form of the 2008 low. In the case of gold, there are 4 support levels that could stop the decline and each of them is coincidentally located $50 below the previous one starting at $1,150: $1,150, $1,100, $1,050, and $1,000.
Summing up, looking at the current situation in both currencies, we are likely to see further deterioration in the Euro Index and improvement in the USD Index in the near future. As mentioned earlier in this section, the euro almost immediately invalidated both breakouts, which is a bearish signal. Additionally, the USD Index reversed course after a drop below the medium-term support lines (to be precise: similarly to what we saw last week, there was no true breakdown overall) and it seems that the bottom for this decline might already be in. On top of that, gold's lack of will to really (!) react to positive news, like the dollar's huge intra-day drop, is a bearish piece of information on its own and an indication that gold is likely to move lower in the short run – it seems that all it needs is a rally in the USD Index, which – as you can see above – will likely be seen shortly.
=====
Announcement: Bitcoin Trading Alerts & Forex Trading Alerts
In the recent survey (thank you for participation) you told us that (among other things that will contribute to the way we provide our services sooner or later) you are indeed interested in the bitcoin and forex trading services. We are starting these services today in the “preview mode” and they will be fully launched in one week. During this week, you will have full access to both of these services. Both will take the form of daily trading alerts (+ extra alerts when the situation requires it).
During the “preview week”, new services will be posted in the Articles section on the website, and then they will be published in their own sections, respectively. We will also send notifications about them via e-mail.
Forex Trading Alerts will be authored by Nadia Simmons, who spent countless hours (speaking of thousands) analyzing the currency markets and trading them. As you have read on numerous occasions, Nadia has expertise in the crude oil market and everything that relates to it. However, Nadia actually has even more experience in the forex markets than in the crude oil market (by the way, the only reason we started with Oil Trading Alerts, and not Forex Trading Alerts several months ago was that crude oil got more votes than currencies in our previous survey as far as providing additional services was concerned) and you will now be able to utilize and profit from this experience.
Bitcoin Trading Alerts will be authored by Mike McAra. Even though this name might sound new to you, you have already read or used multiple features of our website to which Mike contributed. You will find Mike’s short bio below:
Mike is a quantitative analyst passionate about finance and economics, particularly interested in the topics of uncertainty, investor behavior and portfolio management.
He holds two master’s degrees, the first in quantitative methods and the second in finance; he is always more interested in the reality around him than the model itself. His investment approach is grounded in empirical evidence without rejecting common sense.
With Sunshine Profits since 2009. Prior to 2014, Mike was developing innovative investment tools, verifying the usefulness of popular techniques and providing thorough internal research, contributing to many of the company’s successful ventures. His quantitative and financial background, along with experience in the gold market and a personal interest in bitcoin, naturally led to the launch of the Bitcoin Trading Alert service.
Currently, he is studying towards the CFA charter, having already passed the first exam with the highest calculated percentage range in the following areas:
- Alternative Investments
- Corporate Finance
- Derivatives
- Equity Investments
- Ethical & Professional Standards
- Financial Reporting & Analysis
- Portfolio Management
- Quantitative Methods.
Thank you for reading. On behalf of the whole Sunshine Profits Team, I would also like to thank you for staying with us in 2013 and wish you a Happy and Prosperous 2014!
Przemyslaw Radomski, CFA
Back