
This essay is based on the Premium Update posted on June 18th, 2010. Visit our archives for more gold articles.
Back in early 2000, during the euphoria of what later became known as the Dot.Com Bubble, one well-known professional investor stuck his neck out and predicted the bursting of that bubble. Jeremy Grantham was a bit early and was willing to give up millions in fees from customers who fled his fund transferring their money to managers who promised the party would never end. In 2000 Grantham predicted stocks would lose 3.9% per year annualized for the next 10 years and he was proven right.
Given his prescient calls, we like to pay attention when Grantham publishes his famous quarterly newsletters, which have appeared since 1999. The publications represent his personal views on the stock market. Although he doesn't write specifically about gold, concentrating more on equities, the various asset classes are all inter-related and as gold investors it behooves us to consider all aspects of the economy. Grantham, co-founder and chief investment strategist of Boston-based GMO has recently published the spring edition of his quarterly newsletter entitled "Playing with Fire (A Possible Race to the Old Highs)". Grantham is predicting the opposite of what he said in 2000. When the NASDAQ was at 5,000 he said sell. Now with the NASDAQ at about 2,307 he's saying buy.
Grantham is far from euphoric-don't forget that in the title of his missive are the words "playing with fire.' He says the massive bailout program stopped the meltdown of the financial system and engineered at least a temporary economic recovery. The obvious cost of this bailout is well known-- deterioration of the Federal balance sheet.
Grantham explains why he believes the rally will run through next fall.
"In October we enter the third year of the Presidential Cycle, the year every Fed except, of course, Volcker's, helped the incumbent administrations get re-elected. Since 1932, there has never been a serious decline in Year 3. Never! Even the unexpected Korean War caused only a 2% decline. Even when Greenspan ran amok and over-stimulated the first two years instead of cooling the system down - which he did twice, having not suffered enough the first time - he stimulated Year 3 as well. The result was that we entered Year 3 in October 1998 and Year 3 in October 2006 with horribly overpriced markets, and still the market went up, and by a lot."
So far since 1932 the market has had 19 tries to go down in the third year and has never pulled it off, he says.
Grantham believes that the market will move in the next 18 months or so back to the old highs, say, 1500 to 1600 on the S&P, accompanied by an equivalent gain in most risk measures, followed once again by a very dangerous break. If the break comes rates will still be low and thus difficult to use as a way to jump-start the economy. The financial system will still be fragile, and the country's piggy bank will be more or less empty.
"We are definitely playing with fire and need some luck."
Another veteran global investor, Mohamed El-Erian, who runs Pimco and has lived through several financial crises, also recently issued a report to his investors. He described the new, dangerous state of today's global economy like this: "The world is on a journey to an unstable destination, through unfamiliar territory, on an uneven road and, critically, having already used its spare tire."
The U.S. used its spare tire to prevent a collapse of the banking system and to stimulate the economy after the subprime market crash. The European Union used its spare tire to help save the euro due to the meltdown in Greece. Having used up its spare tires, it seems to us that the world could probably not cope well with any new crisis.
Another financial heavyweight and famed contrarian, Marc Faber, gave a talk recently at the leading Austrian economic think tank, the Ludwig von Mises Institute. The publisher of the "Gloom, Boom and Doom Report" gave his perspective on the financial crisis and his bleak outlook for the future.
Faber said that contrary to what the "talking heads" are saying, markets are not out of control. It is the central banks that are out of control printing money. As a result, Americans must re-think what constitutes a safe asset. Traditionally ranked from most to least safe are the following assets: cash, Treasuries, corporate bonds, equities, commodities. However, since the Federal Reserve will keep interest rates at zero, cash and long term bonds will be a bad place to hold one's money and equities will also be a risky proposition given the effects of rampant currency depreciation, he says. According to Faber, precious metals are the best place for wealth preservation. In an environment of money-printing and high volatility physical gold is the best thing to own.
Faber says the fiscal situation is much worse than it is made out to be. U.S. government leaders will try to postpone the hour of truth, pushing the problems off for future Presidents and Congressmen.
David Einhorn, president of Greenlight Capital, a hedge fund, and the author of "Fooling Some of the People All of the Time" doesn't think it will take that long for the hour of truth to arrive. In a recent New York Times opinion piece "Easy Money Hard Truths" Einhorn wrote:
Before this recession it appeared that absent action, the government's long-term commitments would become a problem in a few decades. I believe the government response to the recession has created budgetary stress sufficient to bring about the crisis much sooner. Our generation - not our grandchildren's - will have to deal with the consequences.
Einhorn points out that it was once unthinkable that triple A, "risk-free" institutions could fail.
Our government leaders are faced with the same risk today. At what level of government debt and future commitments does government default go from being unthinkable to inevitable, and how does our government think about that risk?
The current European sovereign debt turmoil is a prequel to what might happen in the U.S., he says.
I don't believe a United States debt default is inevitable. On the other hand, I don't see the political will to steer the country away from crisis. If we wait until the markets force action, as they have in Greece, we might find ourselves negotiating austerity programs with foreign creditors...Though we don't know what's going to happen next, the good news for our grandchildren is that we will have to face our own debts. If we realize that our own future is at risk, we might be more serious about changing course.
Before moving on to the technical part of this week's update, we would like to comment on one the questions that we've received this week:
The question is if with existing homes sales number looking like a decline does this generally make the price of gold go down or up.
Generally, the average real estate prices don't change quickly - the price line is rather smooth (please take a look at the real-estate-related charts in the Gold Fundamentals essay for details.) Therefore, whatever the influence of this tendency would be on the gold market, it is very likely that this effect is already discounted in the price. Consequently, if gold market was able to rally significantly during the past years along with declining real estate values, we expect this trend to continue.
To see if our own future as precious metals investors is at risk, let's begin this week's technical part with the analysis of the long-term gold chart (charts courtesy by http://stockcharts.com.)
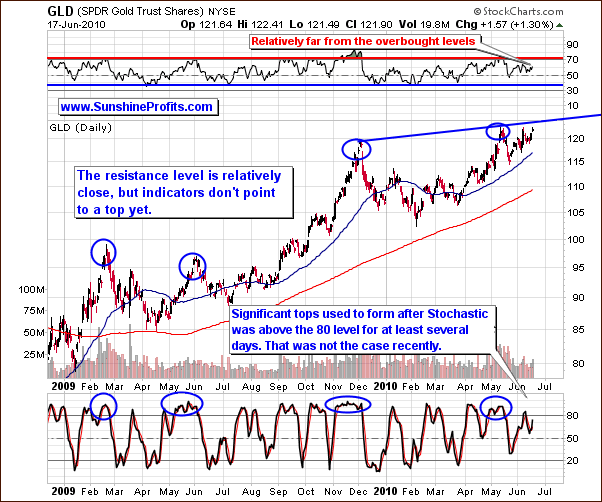
The weekly gold prices right now are above the previous high weekly close. This means that if gold does not decline on Friday (and we don't expect it to decline), the weekly close this week would be the highest ever in nominal terms.
There is a short-term resistance line slightly above were we are today. This is the only negative factor that can be seen at this time, so its impact is limited. The RSI and stochastic indicators both point toward gold moving higher before its next top is in. The stochastic indicator level is not yet above 80, which is typical for a local high. The RSI is not close to its normal market top levels either.
Moreover, seasonal tendencies for gold point towards more strength in the coming days, as the mid-June bottom appears to be behind us.
Please take a look at the following charts for details (please note that we've assumed gold beginning the July slightly above $1,255 - this is not our official prediction for this date, we've put this number there to provide you with "real" size of the upswing instead of the percentage one):
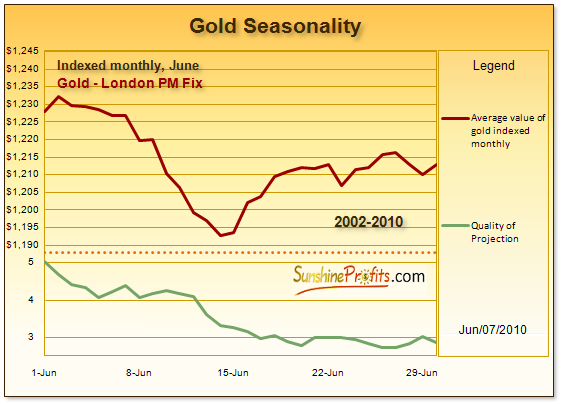
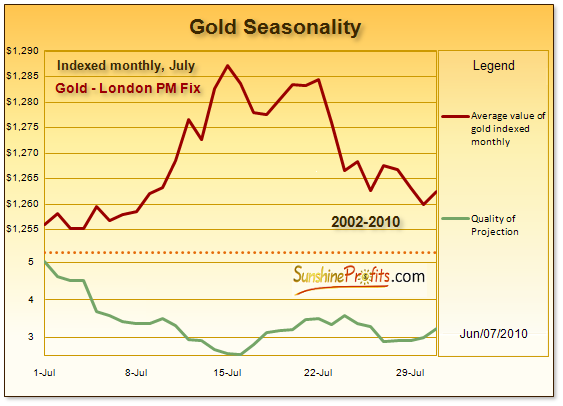
Based on the seasonal tendency patterns, the expected trend is to rally to the end of the month, consolidate at the very end of the month and in early July, and rally around the second week of July with the possible top forming in mid-July or so. This would perfectly fit into our target forecast (detailed target is available for Subscribers). We would see gold move to or above the rising support level formed with December and May tops, take a breather, and then move higher once again. The top could form in mid-July and it could be followed by a regular summer consolidation. This is the most probable scenario based on the signs we have available today.
The final chart this week will be the one featuring the GDX:SPY ratio, because of its usefulness in timing tops. Since we have seen a strong rally to previous highs the question is if this is the top or not?
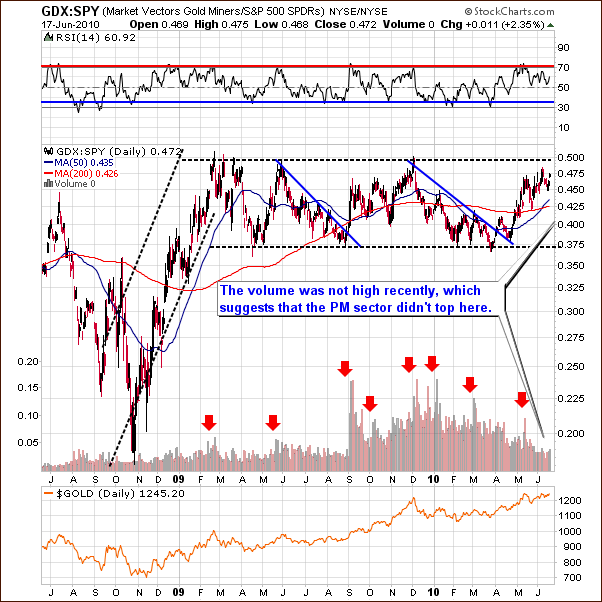
Based on the analysis of other charts we inferred that gold is likely to move even higher before topping out, but a confirmation is always useful, and the GDX:SPY ratio provides us with one. It flashes a "sell" signal when it moves on a huge volume, especially when the ratio encounters a resistance level. None of the above has been the case recently. Therefore, the above chart does not suggest that any tops are imminent.
Summing up, based on the information that we have available today, it does not seem that the ultimate top for this gold rally is behind us. Naturally, we may need to revisit this view if we see new developments on the market, but at this point, we remain bullish on the yellow metal.
To make sure that you are notified once the new features are implemented, and get immediate access to my free thoughts on the market, including information not available publicly, I urge you to sign up for my free e-mail list. Sign up today and you'll also get free, 7-day access to the Premium Sections on my website, including valuable tools and charts dedicated to serious PM Investors and Speculators. It's free and you may unsubscribe at any time.
Thank you for reading. Have a great weekend and profitable week!
P. Radomski
--
This week has taken gold much higher and in all likelihood gold is going to provide us with the highest weekly close ever - only in nominal terms of course. Are we witnessing a serious breakout or a major top in gold appears to be the most important question in Gold Investor's mind. Accordingly, we provide an extensive coverage of the gold market (full 6 charts out of total 19 are dedicated to gold alone in this particular update), and provide a price target for the next monthly move.
Moreover, we comment on the situation in Euro- and USD Indices - and what influence this pair could have on the future price of gold, we provide short- and medium-term thoughts on the situation in the general stock market and its influence on gold, silver, and mining stocks. We also analyze the correlations between the abovementioned markets, and important seasonal patterns with particularly interesting cyclical tendencies (for USD Index, and silver).
We encourage you to Subscribe to the Premium Service today and read the full version of this week's analysis right away.
