
This essay is based on the Premium Update posted on May 28th, 2010. Visit our archives for more gold articles.
In our previous essay we've commented on the precious metals stocks, and since that time we've received many questions about the yellow metal itself, we would like to provide you with a more information regarding that particular topic.
Let's begin with the long-term chart of the GLD ETF (charts courtesy by http://stockcharts.com.)
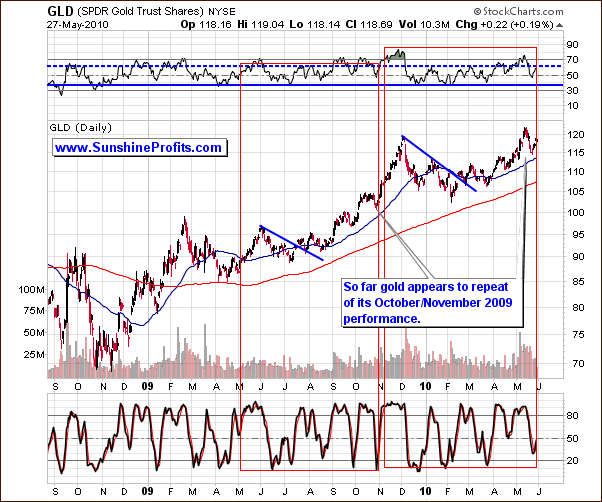
We see a situation similar to what we reported last week on the long-term gold chart. The self-similar pattern is again useful and indicates we may be seeing a repetition of October-November 2009. This is confirmed by both the RSI level and the shape of the stochastic indicator. As a reminder - self-similar patterns are situations when the past price patterns repeat in a very similar manner, at times (as above) in a bigger or smaller scale - meaning that a 10-day move, could now translate into a 15-day one.
Having said that, let's move to the short-term chart.
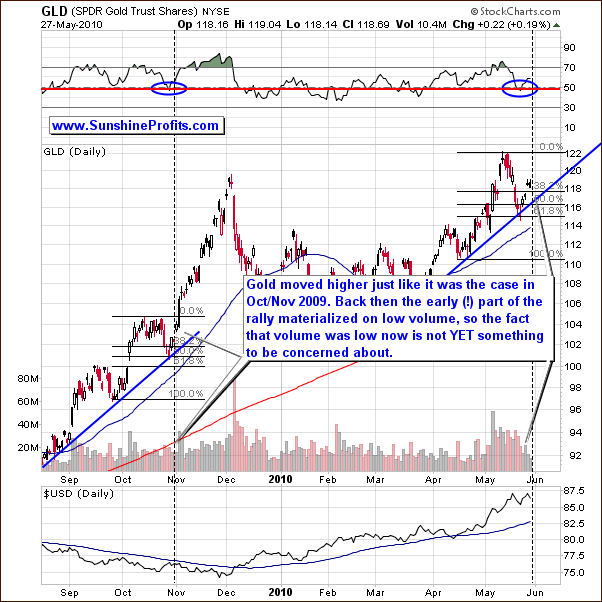
The short-term chart this week may appear quite perplexing at first glance. The price has perfectly followed the Oct-Nov 2009 pattern, but we have not seen huge volume levels. What one needs to keep in mind here is that at the beginning of November, volume levels initially were quite low (before the point marked with vertical dashed line), followed shortly thereafter by a tremendous increase (right after the point marked with the vertical dashed line.) The second thing that one needs to recall here is the fact that the scale of the pattern is bigger this time, which means that a few additional days on low volume are not necessarily a bearish sign. Still, if we don't see higher volume along with rising prices soon, it will make us concerned about the existence of this particular rally.
There's one more thing that we'd like to comment on regarding the "is this 2008 all over again" question and that the way that gold is likely to react even if we get a substantial decline from here in the main stock indices. We all remember how gold (and also the rest of the precious metals sector) reacted to the severe plunge in the world's main stock indices - it was far from amazing. In fact, gold got smashed along with everything else, as many (institutional) investors were required to raise cash
Here's how it can develop:
A hedge fund manager sees that his stocks are declining, so he thinks of selling some of his other investments (including gold), as this he recalls that everything declined back in 2008. However, before clicking the "sell" after having selected his gold position on his trading platform he decides to give this idea a second thought.
Hey - wait a second - gold moved temporarily lower, but just a year and a half after the decline started it moved about 20% higher, so in fact that decline was just a temporary phenomenon. In hindsight - there was nothing to be worried about - in fact, why did I sell back then?! Fundamentals didn't deteriorate, so why did I jump out of my gold position, when everyone else did? Hmm... I guess I panicked with everyone else. There were some margin calls that I needed to comply with, but there were other ways of raising that cash besides selling gold. Well, I can't fix what already happened, but I sure can learn on the past mistakes and make better decision this time.
Let's take a look at our quant team report... Wow! There's no way I'm selling gold this time! The correlation coefficient based on the last 3 years equals -0.42, which means that on average gold used to move rather in the opposite direction to stocks, so maybe if stocks decline from here, gold won't fall at all... It's a tough call, but even if it moves down temporarily, it's still likely to rebound soon and move to new highs, so why would I risk not getting back in near the bottom?
Besides, I know that John, Andy, Michael, and Daniel have also noticed gold's extraordinary performance just after the bottom was put and their quant team's have the same correlation coefficient, as we have and I sure don't want to have a lower rate of return than they do! So, I'm keeping my gold this time - I will have no trouble in explaining this action to my clients since they are aware of gold's performance.
As you may see, the above thought process appears rational, and if many institutional investors follow it, it might result in the decline in gold being minimal even if the general stock market plunges. After all, if many wealthy investors (that might influence the market) decide not to sell because they will believe the coming downturn is just a very temporary phenomenon, such downturn may not materialize at all.
Summing up, overall the situation for gold appears bullish. However, it is unclear if we are seeing the early stages of a big rally like November 2009. We would need to see a confirmation in the form of a visible upswing along with very large volume levels before stating that higher prices are likely. More short-term details are available to our Subscribers.
To make sure that you are notified once the new features are implemented, and get immediate access to my free thoughts on the market, including information not available publicly, I urge you to sign up for my free e-mail list. Sign up today and you'll also get free, 7-day access to the Premium Sections on my website, including valuable tools and charts dedicated to serious PM Investors and Speculators. It's free and you may unsubscribe at any time.
Thank you for reading. Have a great weekend and profitable week!
P. Radomski
--
Did we just see the USD put a double top (double bottom in the Euro Index) or was that a confirmed breakout (breakdown)? Did the general stock market bottom or pause in a bigger decline? Which of the above is particularly important for the PM Investors and Traders? Are PMs and mining stocks going higher or lower from here?
This week we feature 21 charts including: USD and Euro Indices, stock indices, precious metals correlation matrix, gold, gold from the non-USD perspective, silver, HUI Index, GDX ETF, Gold Miners Bullish Percent Index, silver:gold ratio, and GDX:SPY ratio. Additionally, we comment on our unique indicators, several of which have recently provided important signals for PM Investors and Traders.
Additionally, we feature news regarding the North Korea, China, Euro-zone, and India. We encourage you to Subscribe to the Premium Service today and read the full version of this week's analysis right away.
