
Based on the March 2nd, 2012 Premium Update. Visit our archives for more gold & silver articles.
We would like to begin todays essay with a discussion of points from a few e-mails that we received after publishing our previous essay entitled Gold Downside Targets and Manipulative Excuses. Most messages were about the remarkable reliability of the self-similar pattern, and about the silver market, but there were a few interesting messages about the manipulation in the gold market, and these are the messages that we will focus on here.
One of these messages included readers opinion that the recent move lower was probably a central bank intervention. Another message said that our article showed a lack of understanding of the manipulation of the precious metals market and that sharp drops can be predicted by watching the crooked bankers as they increase their massive short positions. Another reader wrote that the severity of the take downs at specific times is in their opinion reflecting substantial market manipulation involving the dumping of significant volumes at the time when the market is in overbought territory.
While we are thankful for these messages, we would like to point out that our previous essay was not about whether gold and silver markets are being manipulated or not. In fact, in the article (third paragraph), we wrote that there are indications that gold and silver markets are being manipulated. We meant for instance incredibly volatile moves in silver close to derivatives expiration dates.
The article was about the mistake that one can make by attributing all downswings to price manipulation. This would imply that if there was no manipulation, there would be no corrections and that gold and silver would move only in one direction up. Furthermore, since corrections do occur in every market and have always occurred, then it means that all markets have been manipulated at all times. Consequently, using technical analysis doesnt make sense. This is simply not true and that was the point of this essay.
Our reasoning doesnt end at the above paragraph in the previous essay we provided a proof that some downswings can be successfully predicted in advance. We even included target levels (which were hit today by the way) that are normally reserved to our premium subscribers and we provided analysis behind it the point was to show the performance of technical analysis in real time.
By showing that the decline was predictable, we wanted to show that ignoring technical analysis can be costly and that explaining all sharp market moves with manipulation theory is not appropriate.
Having said that, lets move to the technical part of our essay. This time we will focus on the markets that at times influence moves in the precious metals market. We will start with the very long-term chart of the USD Index (charts courtesy by http://stockcharts.com.)
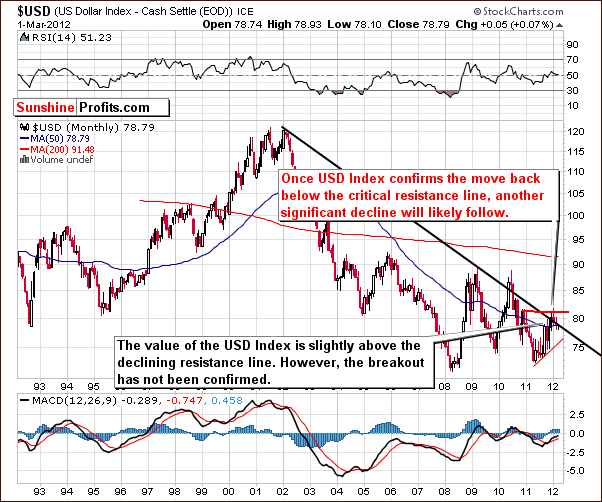
There has been no change since the past week. The situation is still very tense as the index is right at its long-term support and resistance lines.
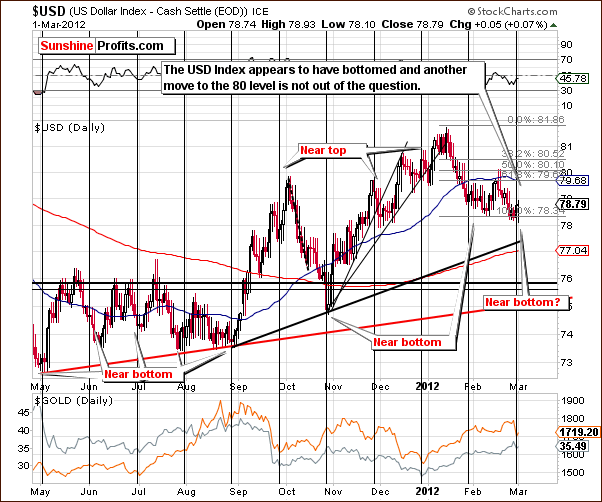
In the short-term USD Index chart, we see a move to the upside after the cyclical turning point was reached. This rally has brought the index to the 79.3 level and the 80 level may provide significant resistance here. The rally could stop right now or a little bit higher, its simply too tough a call at this point.
Dollars recent rally contributed to metals decline. However, the same can be said about stocks move lower.
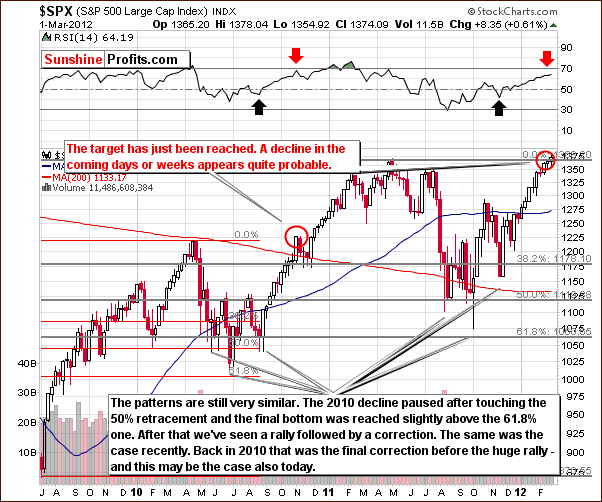
Based on the similarity to 2010, a consolidation or period of decline is likely to be seen next in the general stock market (a part of which we have already seen). RSI levels were close to the range seen in October-November 2010 when the rally in stocks paused, only to resume with vengeance.
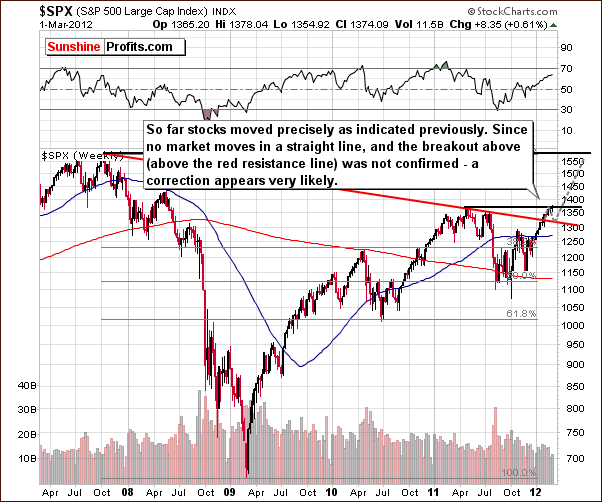
In the above long-term S&P 500 Index chart, once again we see that a correction appears to be in the cards.There was no real confirmation of the breakout above the red-resistance line which is now a support line. We believe that stock prices could move back to this support line and then move higher once again. The latter is based primarily on the extremely low interest rate environment we are currently in.
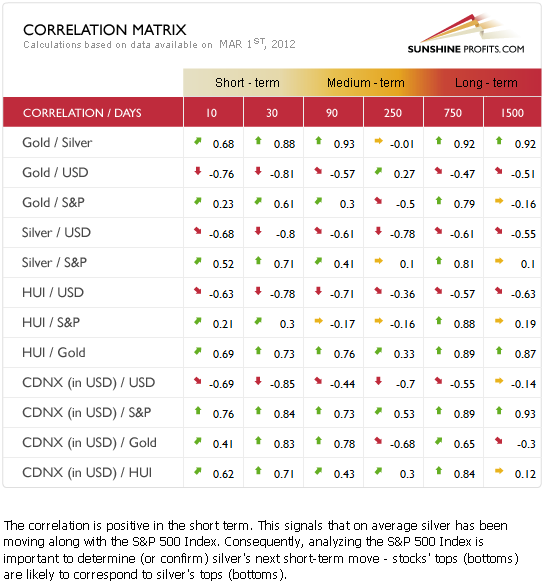
The Correlation Matrixis a tool which we have developed to analyze the impact of the currency markets and the general stock market upon the precious metals sector. The situation here is normal once again (metals move along with stocks and in the opposite way to the USD Index). Consequently, whats bullish for USD and bearish for stocks is bearish also for the precious metals market.
Consequently, we are seeing a rally in the USD Index and there are clear indications that the general stock market will see a correction fairly soon. We have seen a move lower on Tuesday so the correction may already be over, but at this point a continuation of the decline is just as likely.
Still, since our target area for the yellow metal has been reached, we are now bullish on gold. Stocks may move lower from here, but it seems that even they did, they would not drag gold much lower, as the downside in gold is quite limited.
Thank you for reading.
P. Radomski
--
Earlier today we've sent out a Market Alert regarding suggested actions for short-term traders and long-term investors. It included also comments on the most recent signal from one of our in-house developed indicators. We encourage you to Subscribe to the Premium Service today and read the full version of this week's analysis right away.
