
Gold & Silver Trading Alert originally sent to subscribers on November 17, 2014, 7:10 AM.
Briefly: In our opinion no speculative positions are currently justified from the risk/reward perspective.
Gold moved substantially higher on Friday and the volume was huge. The session was both: significant and bullish, but the question remains if such show of strength can be a start of the next big move. As we promised in Friday’s second alert, we analyzed the situation thoroughly over the weekend and are reporting to you today.
Let’s jump right into charts (charts courtesy of http://stockcharts.com).
First of all, let’s take a look at something that didn’t change – the situation in the USD Index.
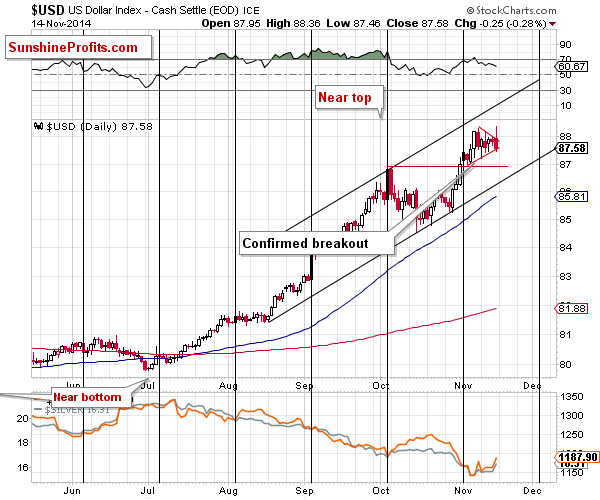
The Index remains in the triangle pattern. The important thing to keep in mind is the intra-day attempt to break above the upper border of the pattern, which was invalidated shortly thereafter.
If the USD Index breaks down from the triangle patter, it’s not likely to fall much further – there are short-term support levels at the Oct. high and the rising black support line. We don’t expect the USD Index to move visibly below the 86.4 - 87 area. We would expect the rally to resume after this area is reached.
On the other hand, if the USD Index does indeed rally right away, then it could move much higher before it really tops (above 89).
Theoretically, this means that gold has limited short-term upside and bigger downside. Does it?
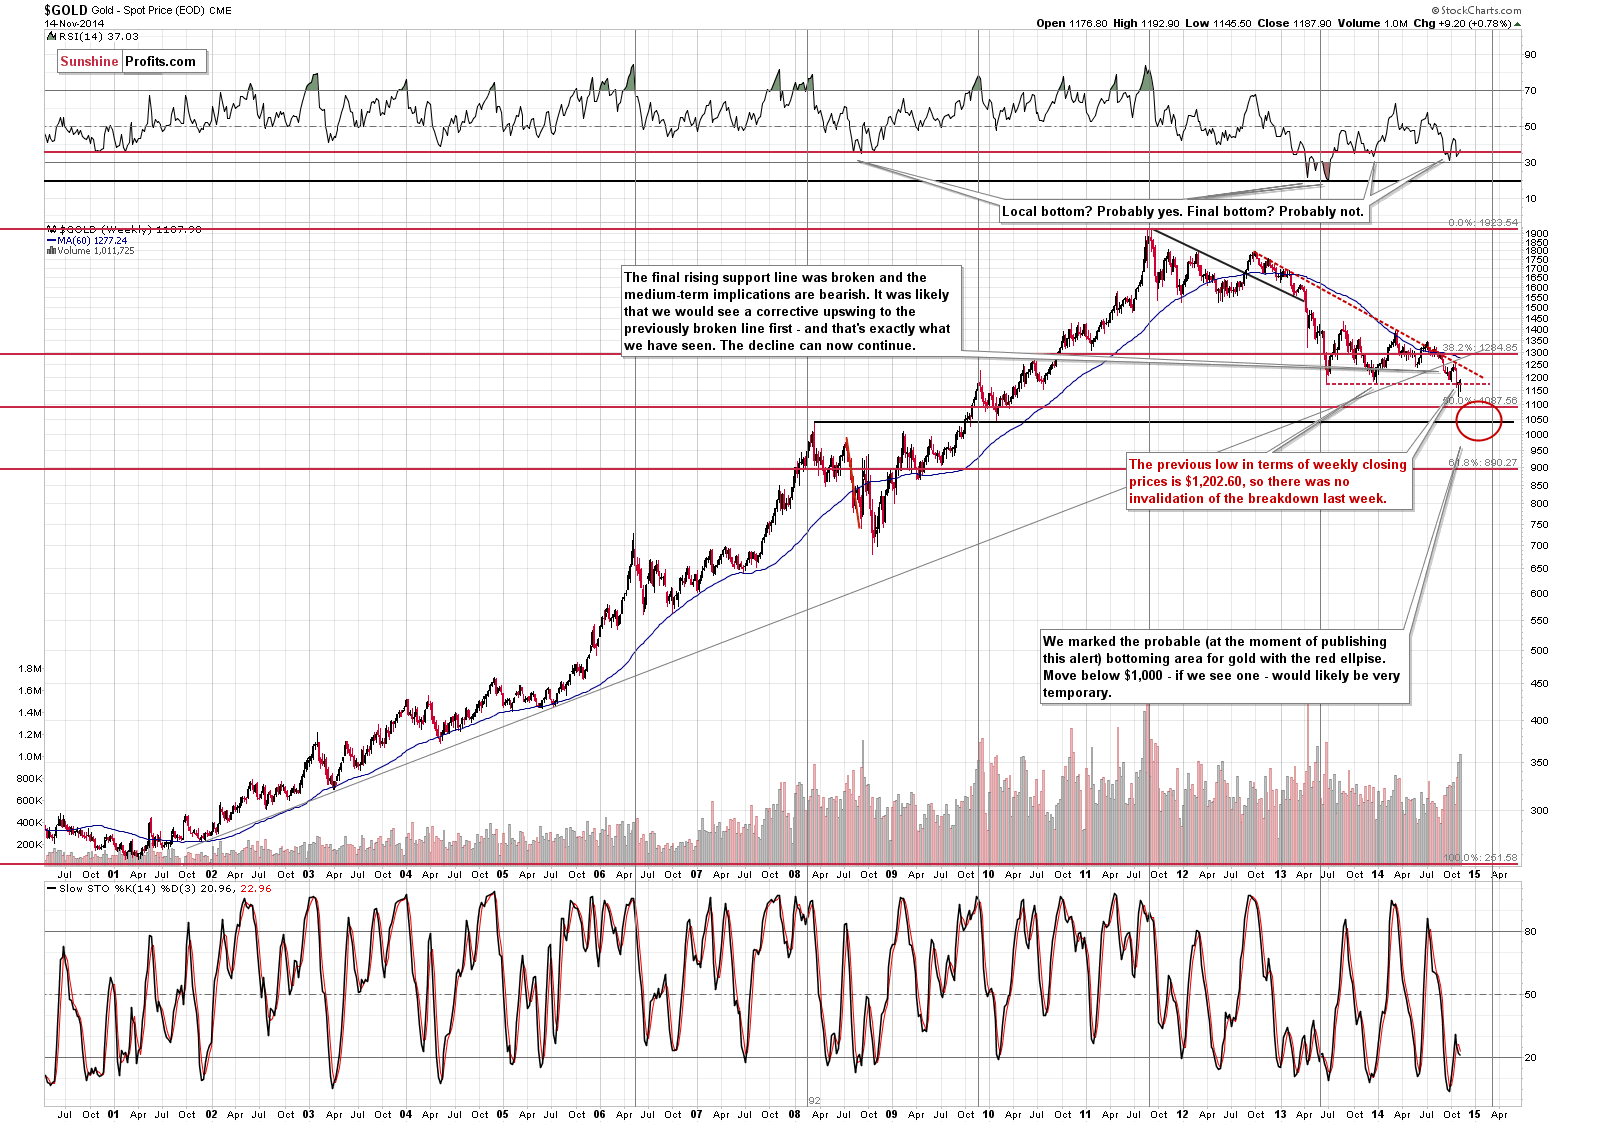
The significant downside is definitely present, as there was no move above the declining (red, dashed) resistance line and gold didn’t close the week above the previous 2013 low (in terms of weekly closing prices).
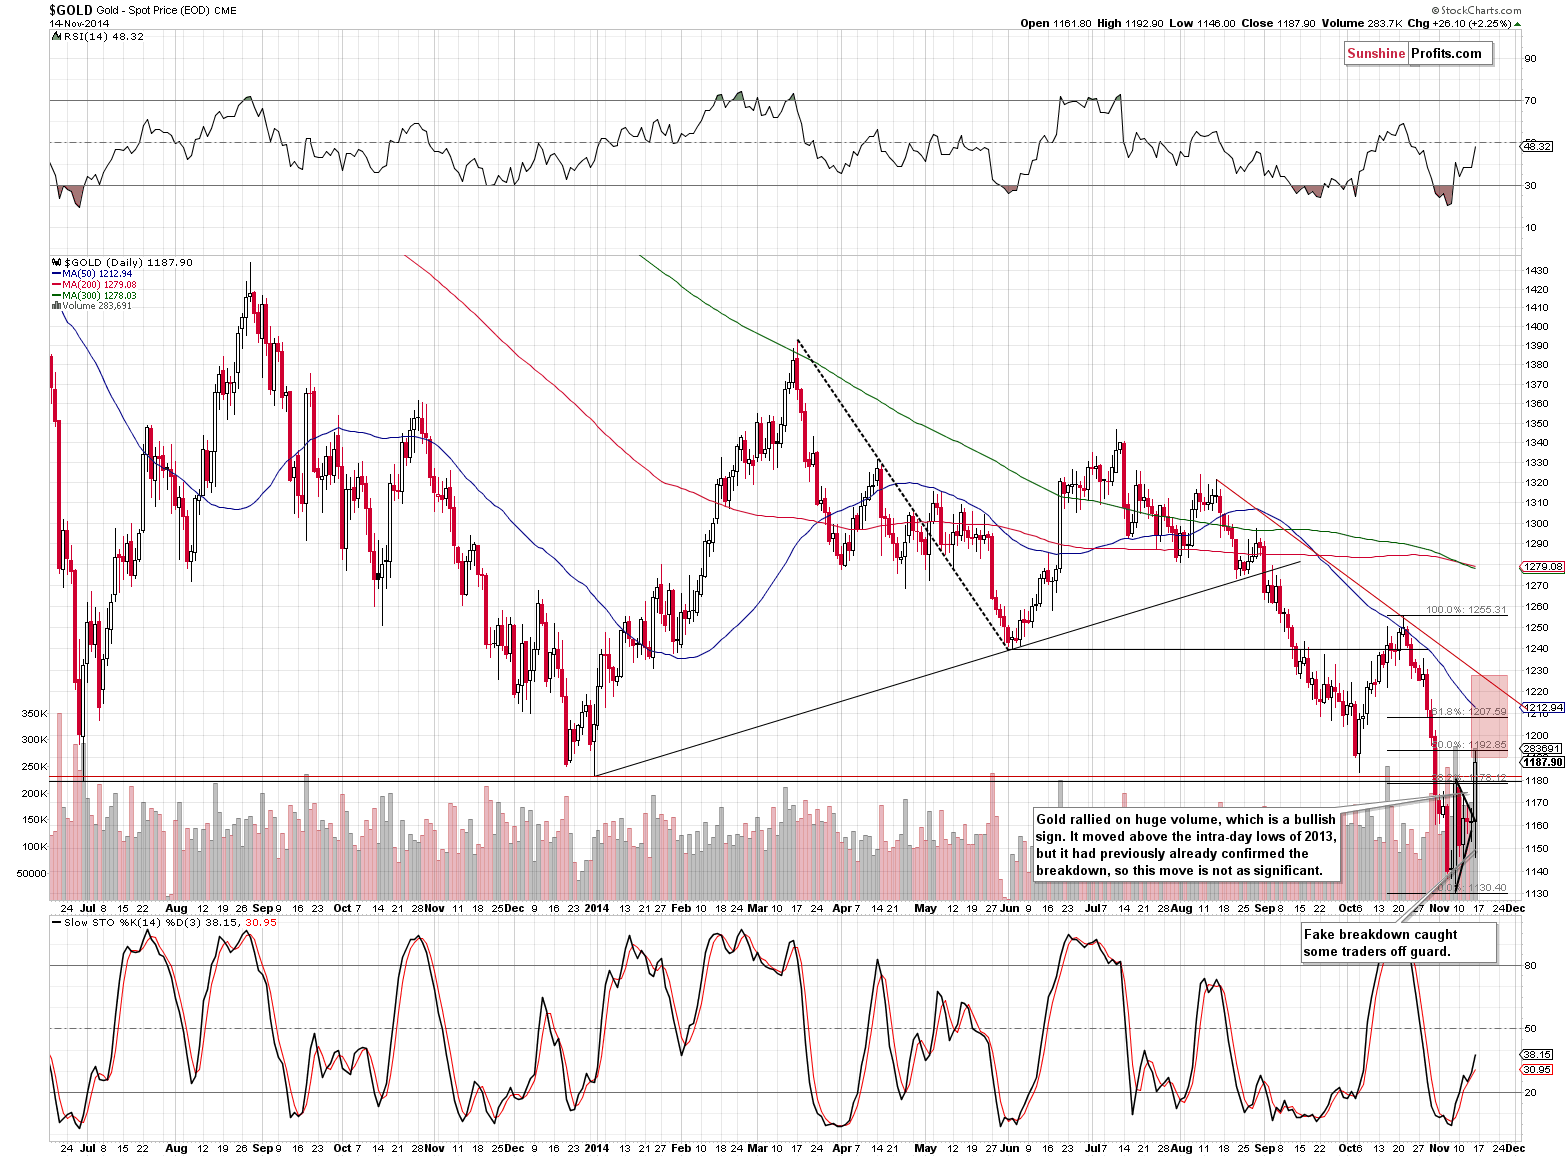
On the short-term chart we see that gold corrected to another important retracement level – the 50% one. Is it enough to stop the rally? It’s certainly possible, but after such a sizable daily rally on strong volume, we can expect some more strength in the coming day(s). So, how high can gold go? To the following resistance levels, of course. The next one is the 61.8% Fibonacci retracement, and a bit higher we have the declining short-term resistance line. It seems likely to us that one of them will stop the rally, as they more or less correspond to the support levels in the USD Index. Which of them is more likely? It’s a touch call at this time – it seems that focusing on other markets / ratios and waiting for a confirmation is a good idea at this time.
Speaking of ratios – can the gold:USD Index ratio tell us something?
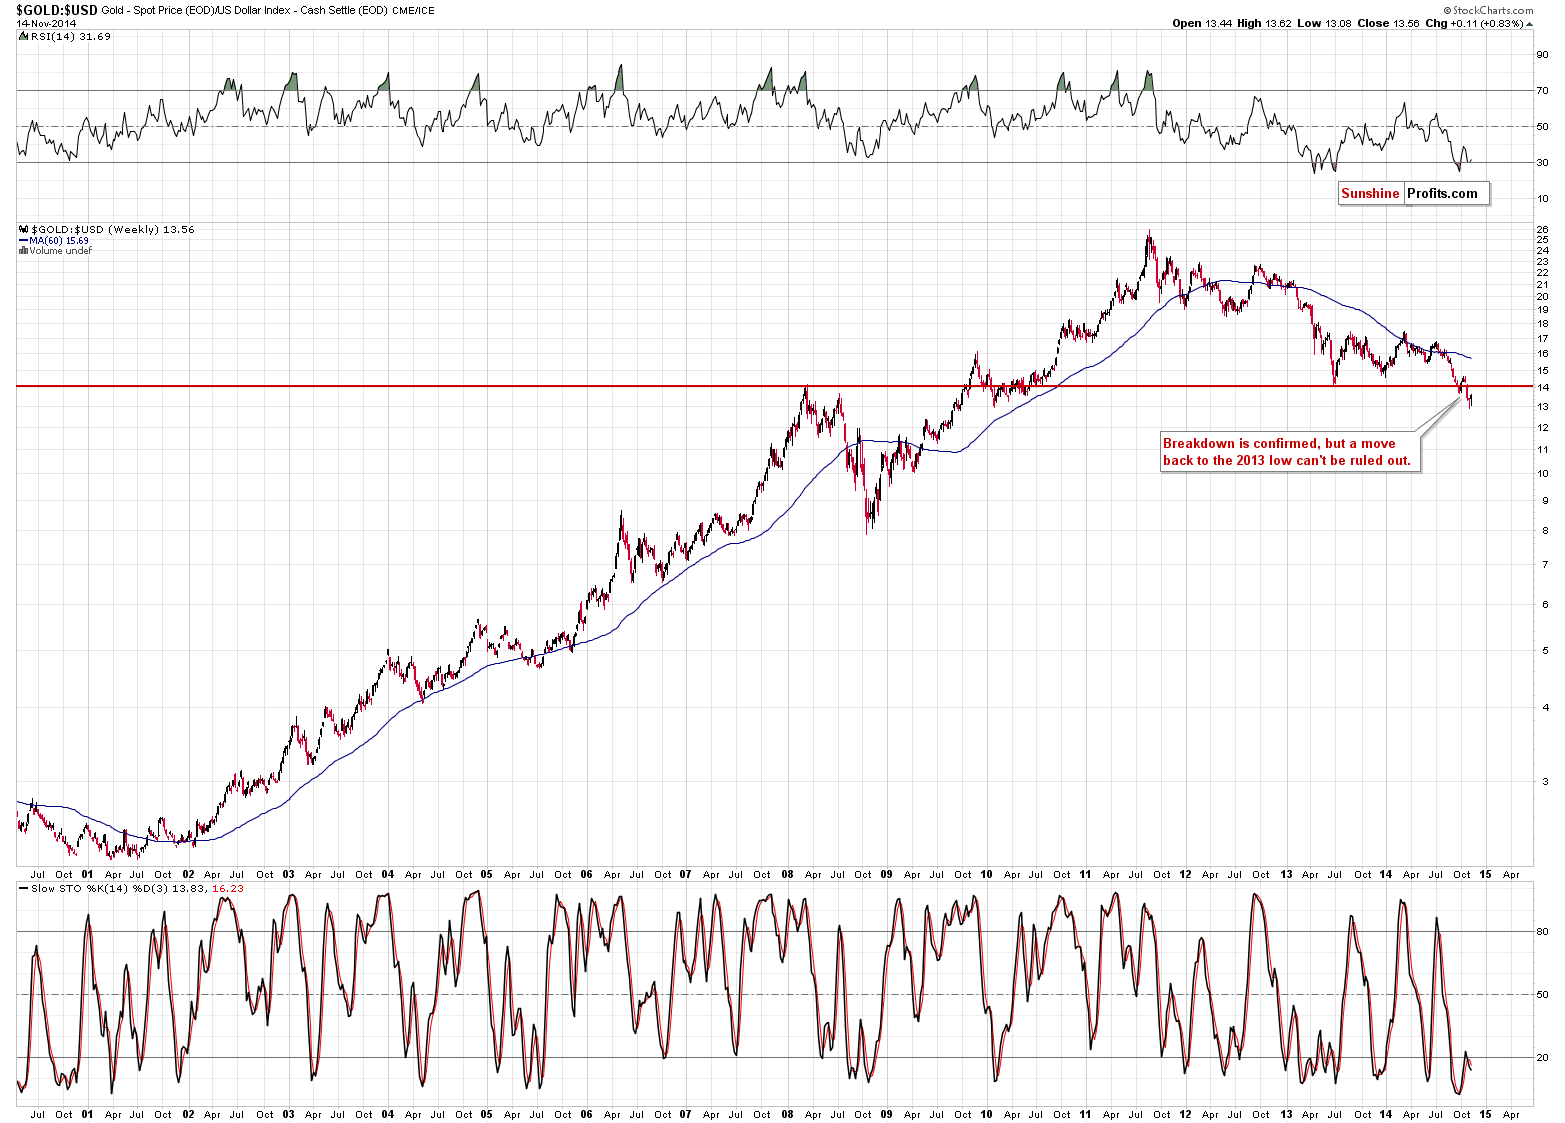
Yes, but that’s generally a confirmation of what we’ve already written above – that gold could move a bit higher before it continues to slide. In this case, we would see a move back to the previously broken horizontal support and then a continuation of the decline.
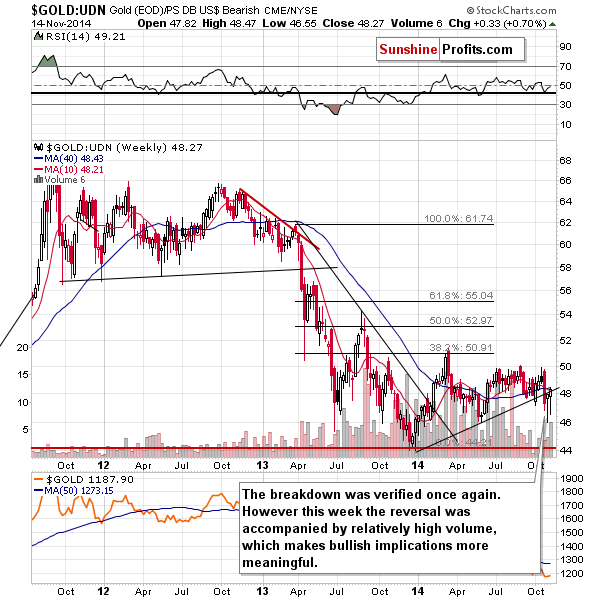
From the non-USD perspective, we have no decisive signal. On one hand we’ve just seen a weekly reversal on strong volume, which is a bullish sign, but on the other hand we’ve just seen another move back to the previously broken rising support/resistance line (the breakdown was not invalidated, so the implications remain bearish).
Let’s move to silver.
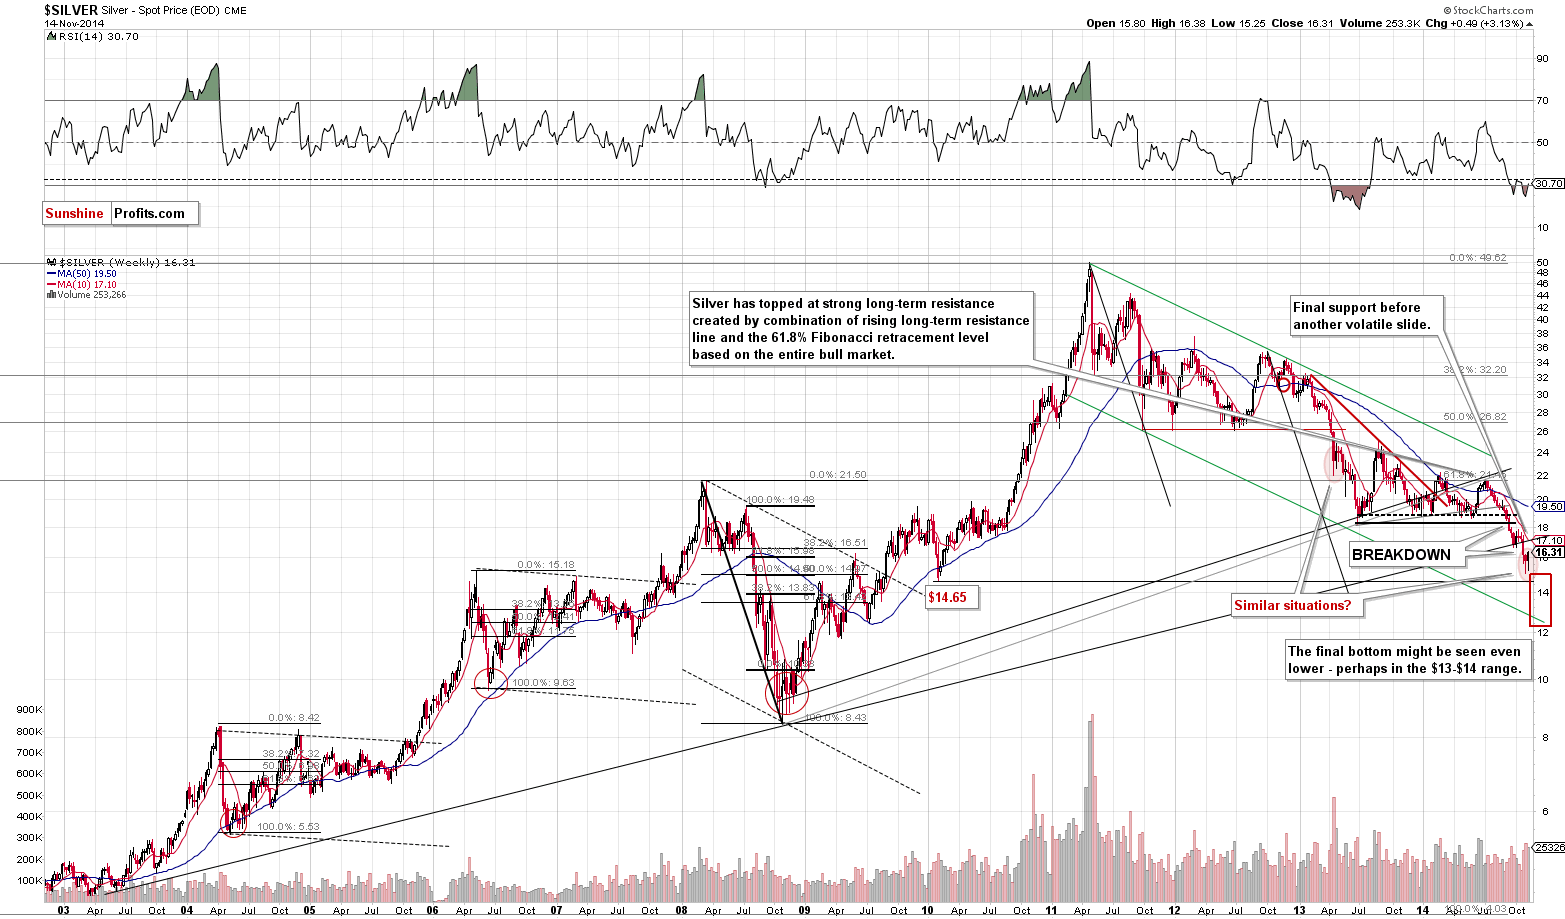
From the long-term perspective, the consolidation seems to continue, which is in tune with what we saw in April 2013. The analogy to this month has bearish implications as back then declines followed. Please note that silver spent a few weeks trading back and forth before its decline continued, so just because silver is not moving lower again is not concerning.
In Friday’s first alert, we wrote the following:
By opening short positions now, we would risk being thrown out of them if PMs rallied temporarily and sharply before declining again. Please recall that silver has been known for such counter-trend rallies right before plunging.
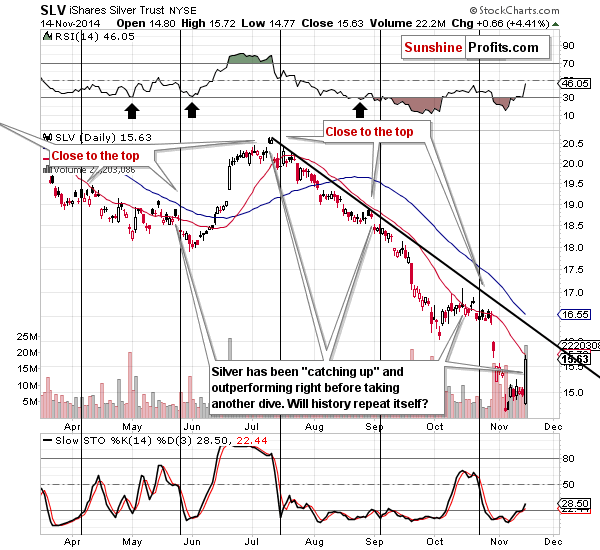
On the short-term SLV ETF chart we see that the rally was very significant on a daily basis. It was definitely good to watch this from the sidelines instead of keeping a short position open. Silver moved to the 20-day moving average, but does it mean that silver can’t move higher? It could – it’s currently correcting a huge decline, so we wouldn’t be surprised to see a move even higher – to the declining resistance line – before the upswing is over. Please note that in October silver also moved temporarily above the 20-day moving average only to decline shortly thereafter.
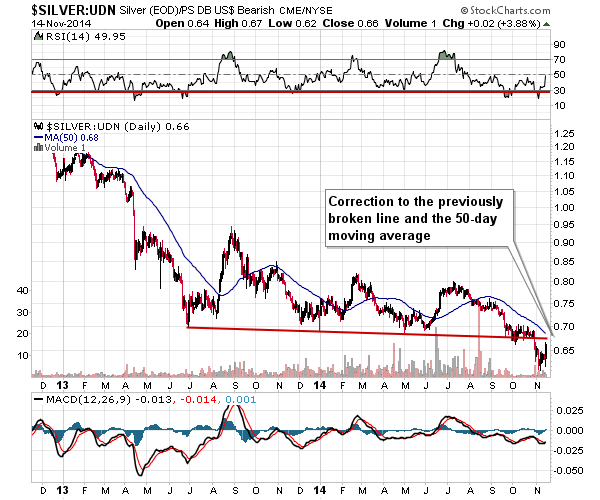
Examining silver from the non-USD perspective provides us with the same outcome as the analysis of the gold charts. Namely, the corrective upswing is likely not over yet, but it’s not likely to take metals much higher either.
Let’s take a look at gold stocks.
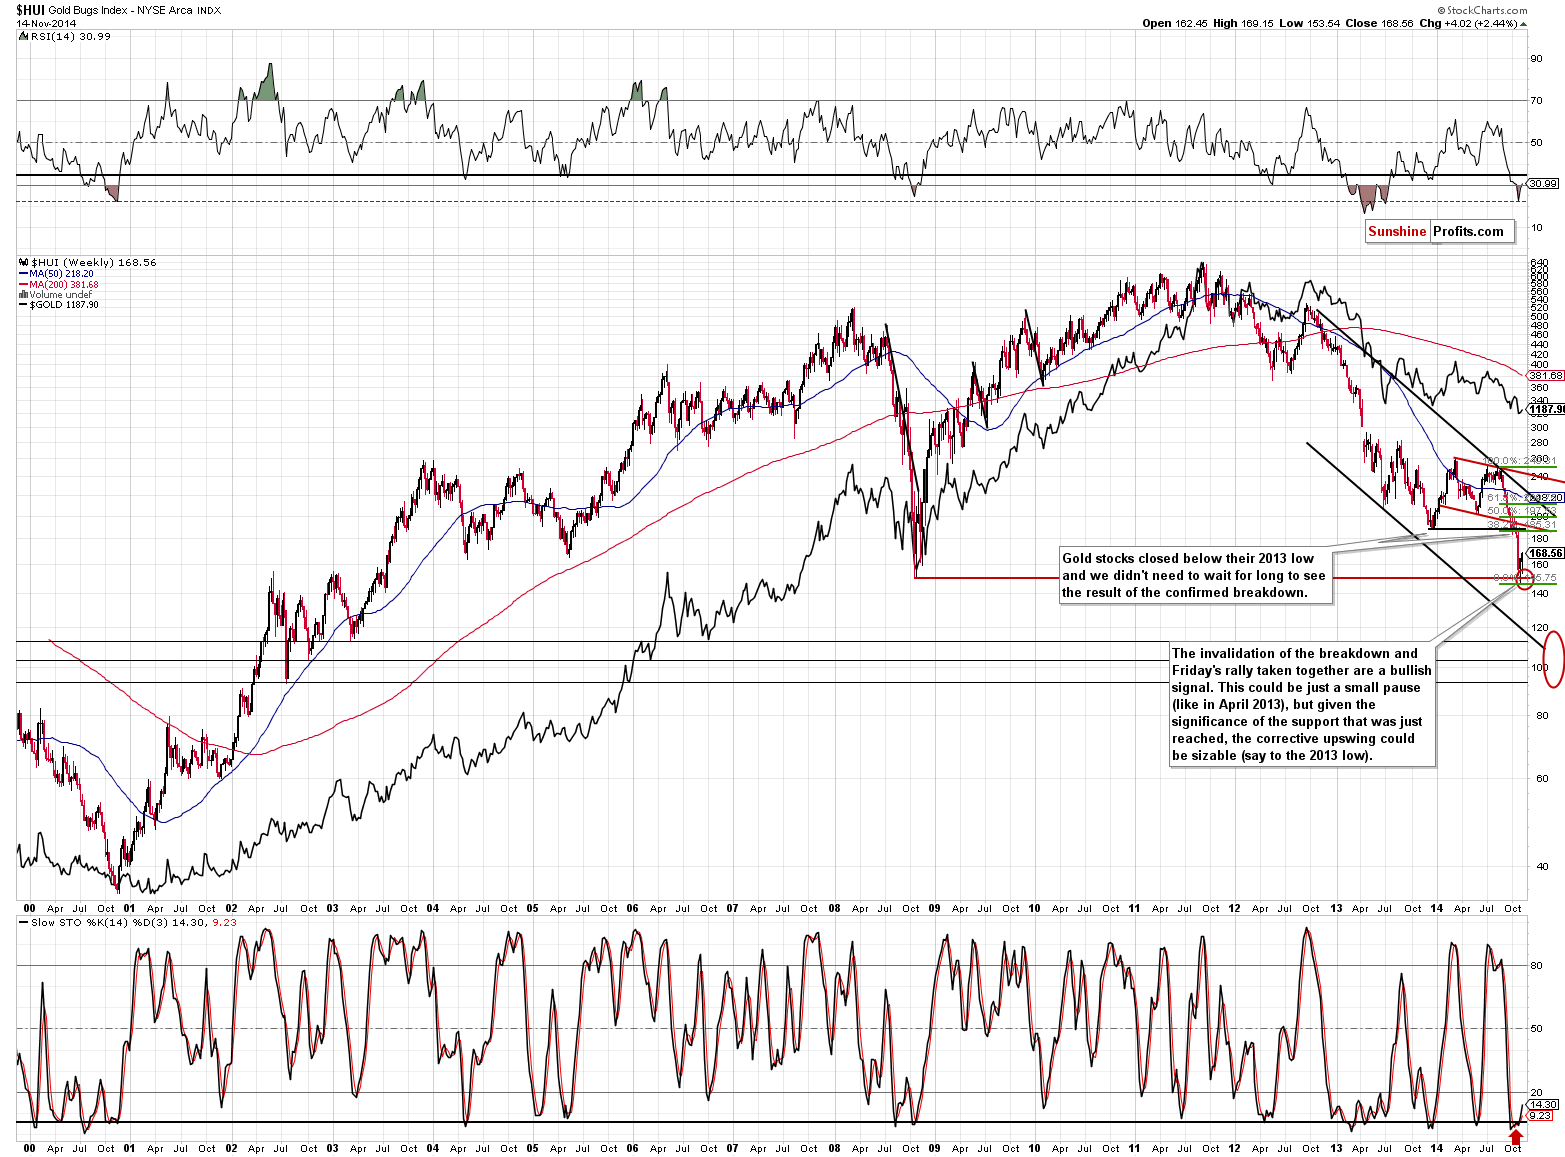
Gold miners have their resistance level relatively high, but since they are ones that have recently dropped particularly significantly, it’s no wonder that the correction is also big. Our comments from the Nov. 10 alert remain up-to-date:
Gold stocks moved higher last week after reaching our initial target area but that’s no proof that the decline is completely over. During the 2008 decline there were sharp corrective upswings as well, but they didn’t mean that the decline was over. The current decline has been significant, so a corrective upswing (a pause within the decline) would be something normal.
How high could gold stocks go before the decline is resumed? It’s a tough call as the market has been very volatile lately, but at this time we wouldn’t rule out a move back to the previously broken support at the 2013 low. The 38.2% Fibonacci retracement based on the recent decline is very close to it, so it seems quite likely that the 185-190 level would stop a rally.
Junior miners can also tell us something (more precisely, their performance relative to other stocks).
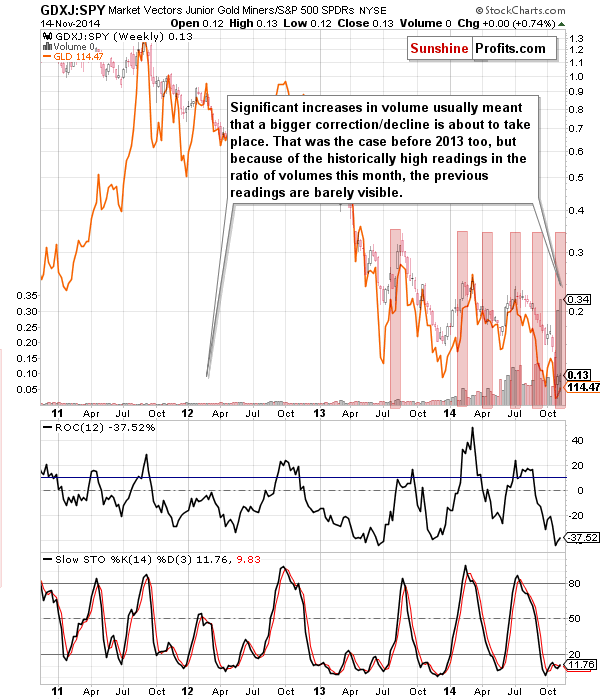
The above chart features the GDXJ to SPY ratio, which means that it will move higher when juniors rally faster than the general stock market. The volume is actually the ratio of volumes. The things that are particularly interesting are situations when we see sudden spikes in the volume (a ratio of volumes). This is when juniors are a particularly “hot topic” – of course on a relative basis. The useful tendency is that these times very often precede or mark important price tops in the precious metals sector. The spikes that we saw in the last 2 weeks were historically high. They were so huge that they made the spikes seen before 2013 barely visible on the above chart. Consequently, the bearish medium-term implications are clearly in place and based on them we could expect another downswing soon, but not necessarily right away. This is in tune with what we concluded based on the analysis of the previous charts.
Summing up, the precious metals sector continues to correct its recent downswing, while remaining in the medium-term downtrend, and it seems that it will move a bit higher before turning south again.
As always, we will continue to monitor the situation and report to you – our subscribers – accordingly. We will aim to multiply the recent profits and will quite likely open another trading position shortly – stay tuned.
To summarize:
Trading capital (our opinion): No positions
Long-term capital (our opinion): No positions
Insurance capital (our opinion): Full position
Please note that a full position doesn’t mean using all of the capital for a given trade. You will find details on our thoughts on gold portfolio structuring in the Key Insights section on our website.
As a reminder – “initial target price” means exactly that – an “initial” one, it’s not a price level at which we suggest closing positions. If this becomes the case (like it did in the previous trade) we will refer to these levels as levels of exit orders (exactly as we’ve done previously). Stop-loss levels, however, are naturally not “initial”, but something that, in our opinion, might be entered as an order.
Our preferred ways to invest in and to trade gold along with the reasoning can be found in the how to buy gold section. Additionally, our preferred ETFs and ETNs can be found in our Gold & Silver ETF Ranking.
As always, we'll keep you - our subscribers - updated should our views on the market change. We will continue to send out Gold & Silver Trading Alerts on each trading day and we will send additional Alerts whenever appropriate.
The trading position presented above is the netted version of positions based on subjective signals (opinion) from your Editor, and the automated tools (SP Indicators and the upcoming self-similarity-based tool).
As a reminder, Gold & Silver Trading Alerts are posted before or on each trading day (we usually post them before the opening bell, but we don't promise doing that each day). If there's anything urgent, we will send you an additional small alert before posting the main one.
Would you like to stay updated on our free alerts (like the one that you've just read)? Sign up for our free mailing list today - it will take just a few seconds and you can unsubscribe just as easily.
Thank you.
Sincerely,
Przemyslaw Radomski, CFA
Founder, Editor-in-chief
Gold & Silver Trading Alerts
Forex Trading Alerts
Oil Investment Updates
Oil Trading Alerts
