
Based on the March 2nd, 2012 Premium Update. Visit our archives for more gold articles.
When a roller coaster plunges its gut-churning, heart-racing, blood curdling, in a word--petrifying. Thats how precious metals investors must have felt Wednesday when gold plunged more than 5 per cent to hit a low of $1,688.44 ounce, after earlier trading as high a $1,791.49 an ounce.
On Tuesday, the day before the plunge, we had sent out a Market Alert in which we included a list of bullish and bearish factors (actually, 6 of them, please click the above link for details) and reiterated our suggestion to stay out of the market with short term speculative positions as we felt that the situation was too dangerous. It seems that we were a lone voice and some of our subscribers even canceled their subscriptions annoyed that we were saying that the situation was bearish when gold prices were going up. We can only hope for their sake that they didn't open any long positions.
Please allow us to digress a bit. Being a lone voice suggesting a downswing is one thing, but we have just learned that those analysts, who didn't see the correction coming, are now blaming some certain events that took place on Wednesday or even resort to manipulation theory. We find it a bit odd. Yes, in a way, all markets are manipulated as the money supply / interest rates are subject to gov't control and there are indications that gold and silver markets are being manipulated, but that doesn't mean that all sharp moves (especially the "unforeseen" ones) should be viewed as resulting from price manipulation. Events - yes, there were some bearish news for precious metals on Wednesday, but on any given day there are multiple bullish and bearish pieces of news. Why do sometimes news affect price and sometimes they don't? Emotionality of investors and traders is the answer and technical analysis (and related approaches) can help one to prepare themselves for these sudden moves. Not all of them can be predicted, but a lot of them and just because other methodologies didn't allow one to see a plunge coming, doesn't mean that one should explain with manipulation. In this week's case, the markets were bound to correct based on the self-similarity between 2006 and now and many other technical/emotional factors and we've been writing about it in the past few weeks. Simply put - ignoring technical analysis can be costly and we believe that explaining all sharp market moves with manipulation theory is not appropriate - especially if they could have been reliably predicted using technical tools.
Wednesday was a tense day as the dollar rose, gold plunged and a rally in equities came to a halt. This was accompanied by a testimony by US Federal Reserve Chairman Ben Bernanke who dashed hopes for additional growth stimulus (this is one of the above-mentioned "events"). Bernanke testified that recent developments in the labor markets were positive and that inflation may go up temporarily given recent gasoline price increases. But the chairman gave no hint of further easing. Investors had hoped the Fed will launch another round of quantitative easing, pushing cheap money into the market that would boost inflation, against which gold is a traditional hedge. Our take is that we will see more cheap money, and what we have right now is temporary smoke and mirrors.
Keep in mind that although quantitative easing is good for precious metals, so is inflation. So, if the Fed chairman himself is talking about inflation, the market could just as well have taken that to be a positive indicator for gold prices in a way, higher gold prices represent inflation (measuring a decline of dollars value against the true money).
The decline in gold was accompanied by a decline in stock markets a day after the Dow broke through 13,000 to hit a nearly-four-year high. And on Wednesday, the NASDAQ briefly topped 3,000 before pulling back as Bernanke's remarks took the air out of the rally. Even with the day's decline, the major indexes were able to post their strongest February in years. And even with Wednesdays decline, bullion is still up 10 percent this year, on track for its 12th consecutive annual gain.
Having emphasized technical analysis role in the process of investment analysis, lets move directly to the charts. We will start with a look at the long-term gold chart (charts courtesy by http://stockcharts.com.)
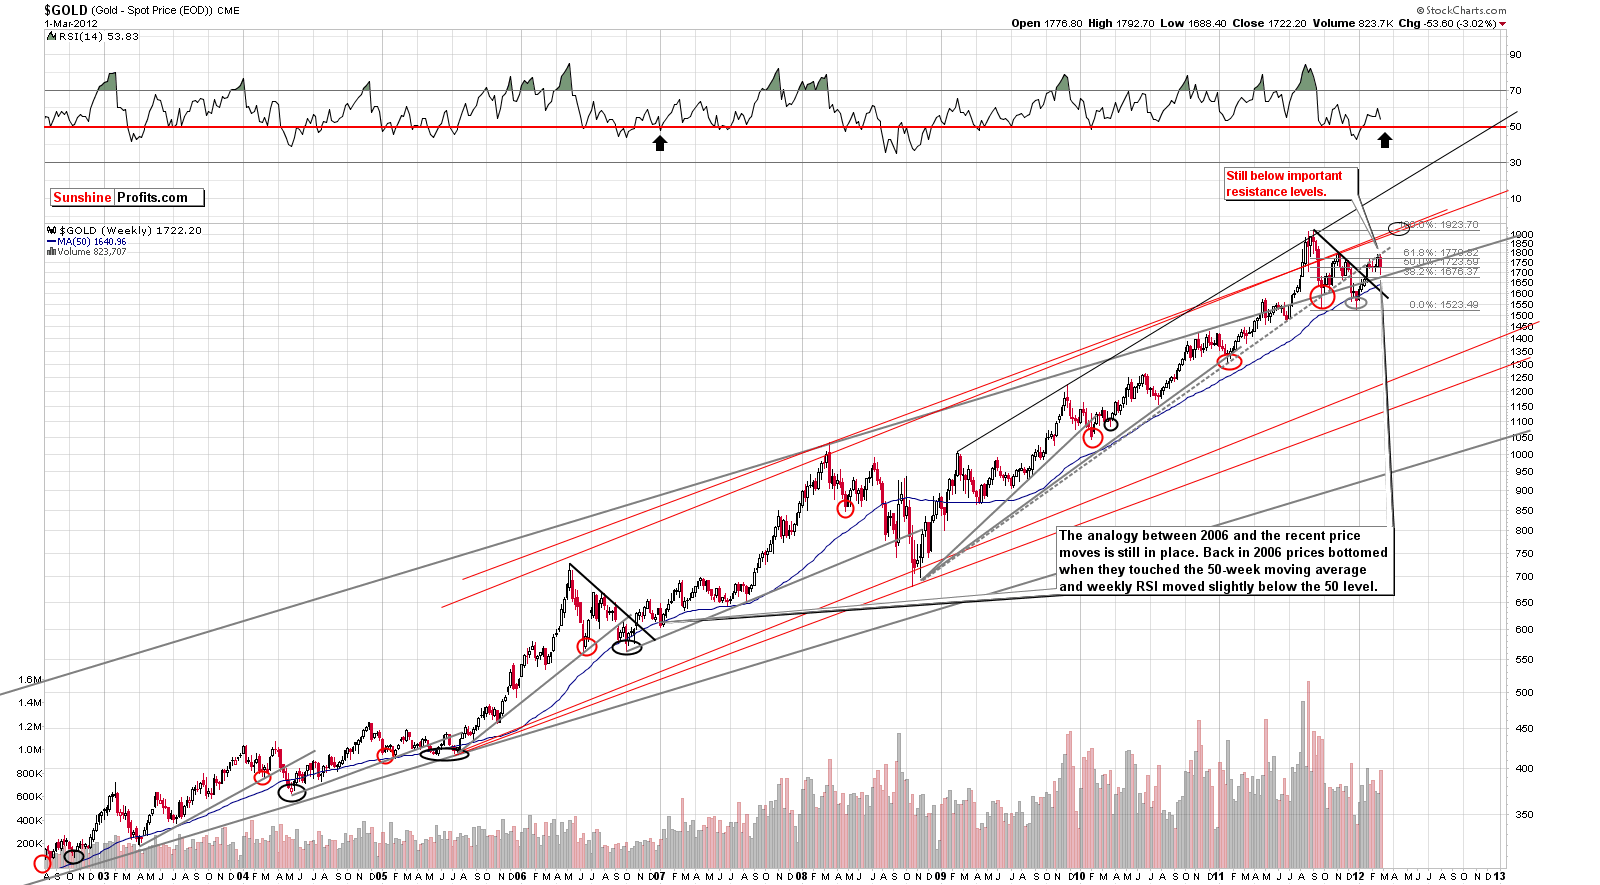
In the long-term gold chart (please click on the above chart to enlarge it), we can clearly see a continuation of the self-similar pattern. Gold bottomed at the end of 2006 when it reached the 50-week moving average. Today, this moving average is still considerably below golds recent price levels. Since the 50-week moving average is trending higher, a week or two more of declining prices should result in golds price and the moving average meeting somewhere in the $1,650 range.
One other note concerns the RSI levels. In 2006, gold reached its bottom with the RSI level slightly below 50. Thursdays close saw an RSI level close to 54 and declining, very much on pace to possibly close in to the very level seen nearly six years ago.
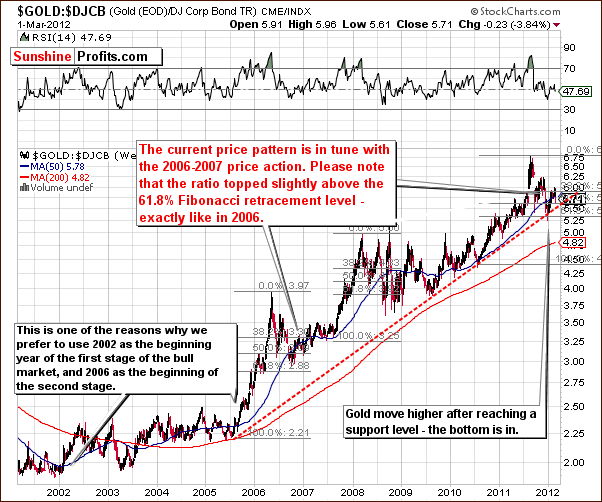
The gold-to-bonds ratio chart gives us a unique insight into the similarities between 2006 and today from a perspective which is quite different from studying gold itself. This chart also provides us with similar signals and confirms the self-similar pattern.
In both time frames, we have first seen a correction (following the 2005-2006 and 2010-2011 rallies) to the 61.8% Fibonacci retracement level and then a move back up to the 38.2% level. The small moves in 06 and 12 above this line were both followed by declines. This is more or less where we are right now. In 2006, we next saw a small bounce and then a decline to the final bottom.
It appears that in our current situation, a small bounce could also be seen next followed by a decline slightly below the 50% Fibonacci retracement level. Although this decline does appear small from the ten-year perspective, the dollar value could actually be fairly significant.
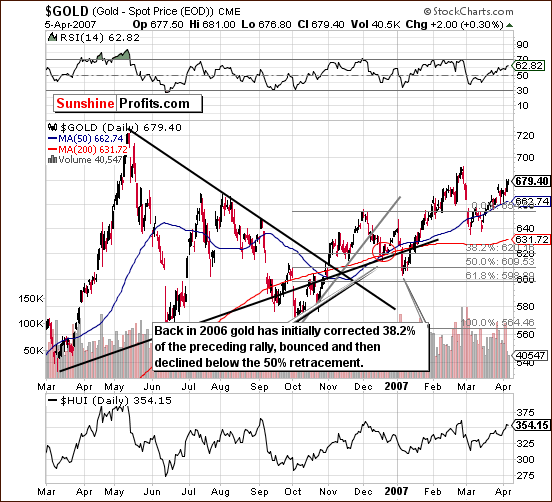
We now turn to the chart from 2006-2007 as we have done for a couple of weeks now. We have inserted a red ellipse to correspond to where we are presently in reference to the trading patterns seen back then. Based on this chart, it seems that a small rally is likely to be seen next. It does not appear large enough to bet on based on our analysis of current market trends, however.
Now, golds next move to the upside (the above-mentioned bounce) could turn out to be as big as we saw back in 2006 but this is no guarantee that the analogy be as precise. So, based on this chart alone, we expect to see a move to the upside very soon followed by a decline to slightly below the 50% Fibonacci retracement level of the previous rally. Where would that exactly be? Lets take a look at the current short-term chart to find out.
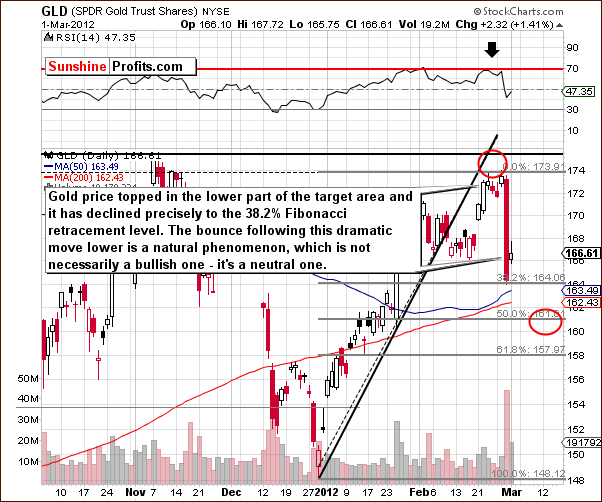
In the current short-term GLD ETF chart, we see that the previous upside target has been reached (its lower part) and downside target level for the coming decline is in the $160-$161 range. This corresponds to about a $1,650 price for spot gold. Recall that in 2006, the initial part of the decline was seen to the first Fibonacci retracement level.
We have seen this take place (on Wednesday this week) and also saw a bounce on Thursday. This bounce is quite a normal move coming immediately after a huge decline. Some sideways trading or a slight move higher on low/declining volume levels would confirm that the short-term trend is indeed now to the downside. The decline to our target area will likely be seen sometime in the next two weeks.
What is important in looking at the 2006 pattern is to remember that sometimes history has the unique characteristic of repeating itself. While some people defy that, it seems that history may actually rhyme copy some patterns, often on different scales. Recall, that both the price of gold, and its moves in 2006 were at different levels than they are now. Yet, thanks to our analysis, we are able to spot places where patterns may be repeated and, thanks to that, we may somehow limit the uncertainty present on the precious metals market and that was the case this week.
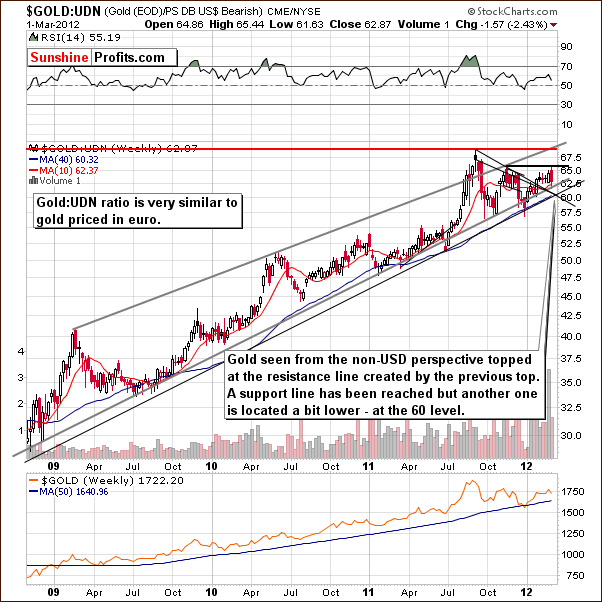
In this weeks chart of gold from a non-USD perspective, there was a development worth noting. In last weeks Premium Update, we stated that a significant resistance level is about to be reached which would imply a pause or correction. From this non-USD perspective, gold actually declined to a support level this week after topping at the resistance line created by previous highs. If this support line (just below the 63 level) is broken, another is in place close to 60.
With respect to the USD Index, we have a few possibilities for the coming weeks. If gold declines without any real action in the USD Index, the ratio here will likely move to 60 or so, where it will encounter the second support line. If however, the USD Index moves higher and gold prices decline, the non-USD ratio will likely trade sideways and then resume its rally in a week or two. Specific details are not yet forthcoming from this chart.
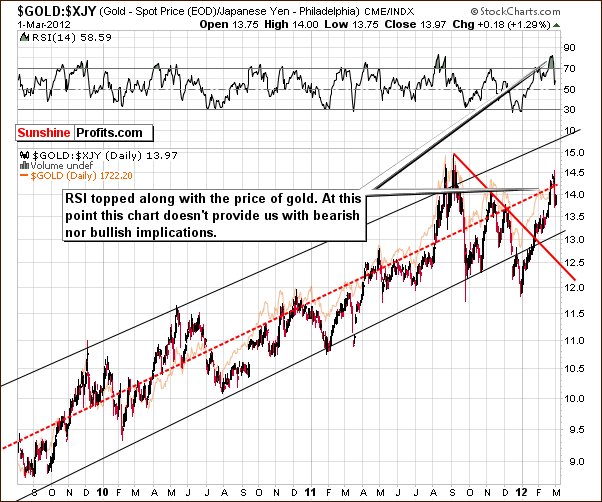
Looking at the long-term chart of gold from the perspective of the Japanese yen, we do not really see many signals. However, from an educational standpoint, providing this chart seems justified. The above picture confirms that the top is in with gold having moved to the middle of the trading range and RSI levels in the overbought range. This means that when we see this combination of signals again, we will likely have another local top. Please note that there were many cases in the past when local tops in gold were indicated by gold:xjy ratio (gold priced in yen) moving to the middle of its trading channel.
Right now, the RSI levels have recovered somewhat and gold does not appear to be overbought or oversold at this time. This chart therefore does not provide us with any important timing details at this time.
Summing up, the self-similar pattern with 2006 is clearly still in place. We expect gold to bounce a bit higher and then decline. The coming bounce does not appear large enough or sure enough to bet on and the short-term trend now appears to be bearish. If gold trades sideways or moves higher on low volume in the coming week, this will confirm the bearish outlook and it will likely remain in place for the next 2 weeks or so.
Even though, from time to time gold moves down sharply, it doesnt mean that all of these moves are a result of market manipulation. At least some of them can be successfully predicted and avoided in advance thanks to applying technical analysis and other related methods.
Thank you for reading. Have a great weekend and profitable week!
P. Radomski
--
Today's Premium Update is loaded with valuable information. The moves in gold and silver this week were extraordinary and so is the amount of charts that we covered this week. Among other things, today's report includes the analysis of the following:
- China's economy and its gold purchases,
- USD Index - long- and short-term picture (including cyclical turning points),
- General stock market - S&P 500 Index,
- Precious Metals Correlation Matrix,
- Self-similar pattern in... gold to bonds ratio,
- Self-similar pattern in gold price,
- Short- and long-term projections for gold, silver and mining stocks,
- Downside targets for gold, GLD, silver, SLV, HUI and GDX,
- Gold from the non-USD and Japanese perspectives,
- Silver's resistance and support levels,
- Silver to gold ratio,
- Platinum to gold ratio,
- Crude oil price,
- XAU Index,
- Miners to gold ratio,
- Juniors to seniors ratio,
- Top gold & silver junior rankings.
Additionally, we comment on the silver P&F chart, and the DUST ETF.
We encourage you to Subscribe to the Premium Service today and read the full version of this week's analysis right away.
