
This essay is based on the Premium Update posted October 23rd, 2009. Visit our archives for more gold articles.
Precious metals moved lower this week, which was accompanied by a decline in the general stock market and a small rally in the USD Index. The situation in the main stock indices is still rather unclear, so this week I would like to point your attention to the U.S. Dollar as it provides clues invaluable to anyone involved in the precious metals sector. After all, there is a clearly visible negative correlation between USD Index and gold, silver and PM stocks.
Lets begin with the chart (charts courtesy of http://stockcharts.com) featuring the USD Index in the medium term, and after that I will move to the short-term analysis.
The U.S. Dollar is trading in the area marked with a red elllipse, as I indicated a week ago, and has been mostly trading in its lower part. This, however, changed this week, as USD moved higher, to the upper part of the ellipse, and touched its resistance near the 76 level. Consequently, we have seen precious metals move lower.
The RSI indicator is moving toward the 50 level, which marked local tops since June. Will history repeat one more time? It's impossible to tell, but given the reliability of this particular signal in the recent past it is likely.
Taking the shape of the recent downswing into account may suggest that the USD Index is now near breaking out to the upside, but before going long this market, please note that until the breakout takes place, the trend remains down.
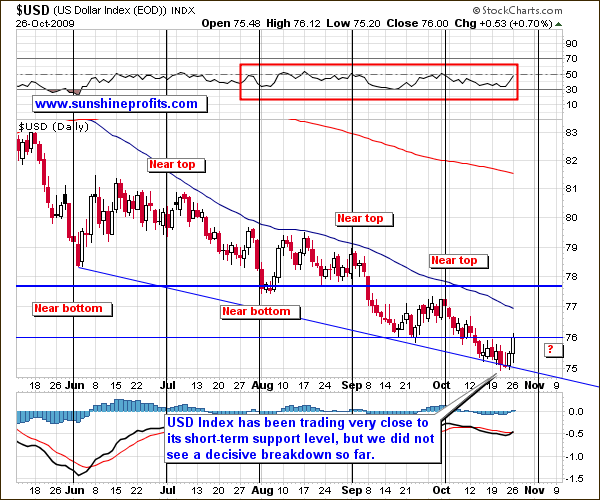
The short-term chart reveals that apart from the support and resistance levels that suggest that USD is to trade sideways for several days, there is one more interesting pattern that is worth analyzing. I'm referring to the short-term seasonal tendencies that have been in place in the past several months I've marked them with black, vertical lines on the above chart.
The remarkable fact here is that since June, more or less the beginning of each month marked some kind of extreme on the dollar market. Most times it was bottom after top, and top after bottom, but two previous times marked local tops, so it is difficult to tell which of these two extremes is more likely to take place at the beginning of November. This, however, does not mean that this observation is totally useless.
As I stated earlier, once we decisively break below the 75 level, the value of the U.S. Dollar is likely to move much lower (possibly below the 72 level) as there are no strong support levels between these two values. Since there is very little time before the end of October, and USD did plunge yet, I dont expect the big move to take place this month. This, combined with the previous analysis implies that either a top / bottom is likely to take place in a week or so, but it is likely to be a local one. By that I mean the price action similar to what weve seen in the last weeks of September.
Therefore, if it is a local bottom that is to take place, it means that a small rally would follow, that would ignite a correction in metals meaning that a local top in USD would be put several days later. If a local top is to emerge, then the metals are likely to correct even sooner. Consequently, although it is not clear what is most likely to happen in the USD Index, the implications for the precious metals are that they correct rather soon, or even sooner, which is in tune with what other charts suggest at the moment. Based on the price action from the beginning of this week, it seems that the correction in the precious metalist is underway.
Summing up, the trend for the U.S. Dollar remains down, which is a positive factor for the precious metals market in the long run. However, from the short-term perspective, it seems that gold, silver, and corresponding equities need to take a breather to correct their post-$1,000-breakout rally. This is likely to correspond to a consolidation in the USD Index, which will probably take place at least for several more days.
To make sure that you get immediate access to my thoughts on the market, including information not available publicly, I urge you to sign up for my free e-mail list. Sign up today and you'll also get free, 7-day access to the Premium Sections on my website, including valuable tools and charts dedicated to serious PM Investors and Speculators. It's free and you may unsubscribe at any time.
If you didn't check it out yet, I suggest taking a look at the full version of the commentary that is available as a part of the Premium Service. In addition on much deeper analysis in the Premium Updates, Premium Service means that you would receive Market Alerts, and gain access to content available exclusively on this website, including Charts and Tools sections.
Thank you for reading. Have a great and profitable week!
P. Radomski
--
The precious metals have been trading sideways this week - does that mean that the consolidation is over or does it mean that a local top is yet to come? This week I provide you with my view on that topic with the emphasis on the short-term price movement. I also comment on the recent signal from one of our unique indicators. Another topic that has been widely covered in this update is the future performance of the precious-metals-related investments relative to other commodities and ETFs. Moreover, I comment on the link between gold and crude oil, and focus on the implications it may have on the precious metals stocks.
This essay provides you with a graphical illustration of the USD-related part of today's Market Alert.
