
This essay is based on the Premium Update posted on November 5th, 2010. Visit our archives for more gold articles.
In a now-infamous 2002 speech, Ben Bernanke said:
(...) The U.S. government has a technology, called a printing press (or, today, its electronic equivalent), that allows it to produce as many U.S. dollars as it wishes at essentially no cost... Under a paper-money system, a determined government can always generate higher spending and hence positive inflation...
This week in a dramatic effort to rev up a "disappointingly slow" economic recovery, the Fed said it will buy $600 billion of U.S. government bonds over the next eight months to drive down interest rates and encourage more borrowing and growth. This is known as QE2, the second round of quantitative easing.
A year and a half after the first round of quantitative easing Ben Bernanke confronts an economy hampered by high unemployment, a gridlocked political system and the threat of a Japan-like period of deflation.
The big news Thursday after the Fed declaration was the $40 price increase we saw for gold. The question is whether this is a break- out or a fake rally. We will attempt to shed some light on this question.
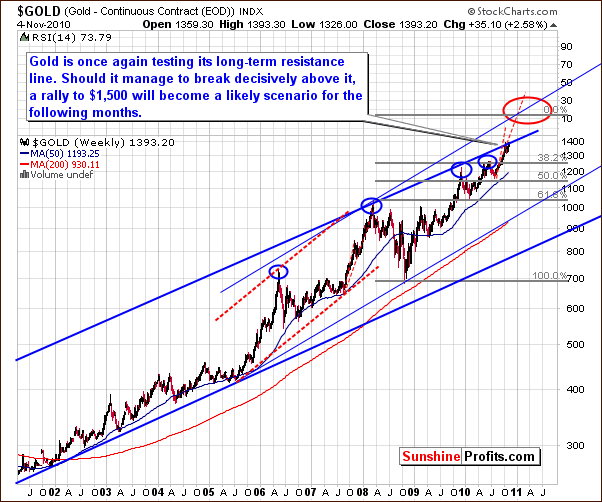
In this week's very long-term chart saying (charts courtesy of stockcharts.com), we first see that gold did not move above the upper border of the very long-term (including the whole bull market) trading channel. As we have discussed previously, some consolidation was expected. Has this already been seen in its entirety or is more yet to come? There does not appear to be enough information at this time to make this call. At least three daily closes above the thick blue line in our chart or huge volume corresponding to a rally from here would confirm that consolidation has completed.
Focusing on the solid blue lines for a moment, a breakout above this upper border would likely be followed by a move to $1,500 or so in the following months. Until such a breakout is seen, gold may simply not move significantly higher - in that case it would be likely to correct once again.
The dotted lines in our chart have been inserted as a result of Subscriber question regarding gold's recent trends being analogous to what was seen in 2007. This is not the case in our view, for at that time, no important resistance lines were being touched. Furthermore, the short-term trading channel was not close to gold's price level in 2007.
A consolidation had been seen for over a year and was followed by a sharp rally. Gold would need to be close to $1450 today and eventually move to $1600 if the 2007 trend were truly repeated, that is, similar % price increases been applied today. This seems to be an unlikely scenario (taking the previously mentioned $1,500 target into account), and we do not feel comparisons to 2007 are meaningful. Simply put, each year saw a rally and a meaningful correction but little else can be said about striking similarities between '07 and ‘10.
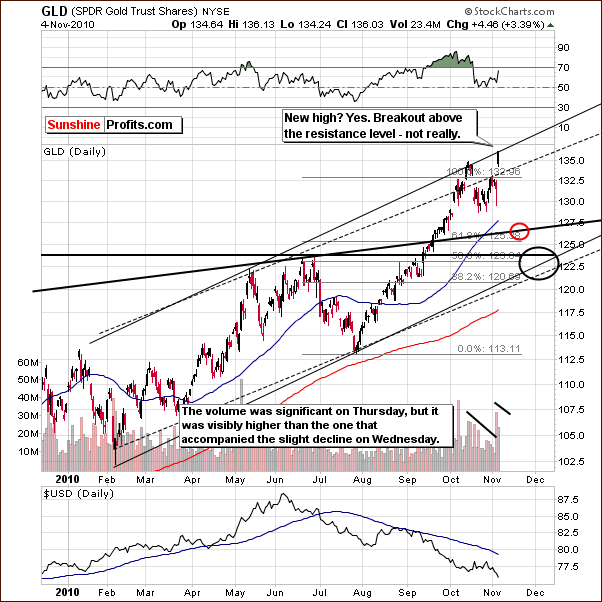
The short-term GLD chart this week clearly shows that the upper border of the rising trend channel was not pierced. Gold's October rally was also stopped by this same resistance line. Since a breakout has not yet been seen, a major decline could still materialize.
Summing up, at first glance, the gold's recent move appears very bullish. A second look and further use of analysis tools provides much less optimism. A decisive move above the upper border of the long-term trading channel seen in our very long-term chart is needed. At the same time we should see the gold price moving above the short-term trading channel. Until such a breakout is seen, the gold simply does not look nearly as bullish as at the first glance.
Another thought worth deeper consideration is that the gold did not manage to move above rising resistance lines despite the Fed pumping $600B into economy.
The USD Index has broken below support levels but verification is still needed (based on Friday's intra-day action it seems that the breakdown here did not happen after all). In case of the general stock market, the opposite is true.
The strong relationship between stocks and precious metals as well as stocks and the USD Index will determine whether breakouts or breakdowns will be seen. Some bullish signs have been seen for gold, silver and mining stocks but several bearish indicators are present as well.
To make sure that you are notified once the new features are implemented, and get immediate access to my free thoughts on the market, including information not available publicly, I urge you to sign up for my free e-mail list. Sign up today and you'll also get free, 7-day access to the Premium Sections on my website, including valuable tools and charts dedicated to serious PM Investors and Speculators. It's free and you may unsubscribe at any time.
Thank you for reading. Have a great weekend and profitable week!
P. Radomski
--
Its not often that we can find the Keynesians and the Austrians agreeing on anything. But we did find something-- the debauching of the currency. As Jim Rogers said: printing money has never worked. We remember a speech Ben Bernanke made eight years ago that tells it like it is.
This week, we have utilized 15 charts to allow for further insight into our discussions about the market actions seen during the past week. Our 4 gold charts, 2 silver and 3 mining stocks are accompanied this week by additional charts related to the USD Index (2 charts) and stocks (2 charts) as well as our weekly correlation matrix and a new silver-gold ratio chart.
As the impact of the Feds recent decision with respect to quantitative easing is still being sorted out, market actions, as usual have been a mix of predictability and surprise. Much will be learned in the days ahead, as barely 48 hours have passed since the details of this huge decision were announced. Once again, we assign ourselves to the task of sorting it all out for our Subscribers and emphasizing what to watch for and what to expect in the days and weeks ahead.
This week's Premium Update includes our up-to-date rankings of top gold and silver juniors accompanied with the SP Long-Term Junior Indicator.
We encourage you to Subscribe to the Premium Service today and read the full version of this week's analysis right away.
