

Forex Trading Alert originally sent to subscribers on May 14, 2015, 9:15 AM.
Earlier today, the U.S. Department of Labor showed that the number of initial jobless claims in the week ending May 9, dropped by 1,000 (beating analysts’ expectations for a 10,000 gain), but yesterday’s disappointing data continued to weigh on investors’ sentiment. In this environment, the USD Index extended declines, which pushed USD/CAD to a fresh four month low and the long-term support line. Will it encourage currency bulls to act in the coming days?
In our opinion the following forex trading positions are justified - summary:
EUR/USD
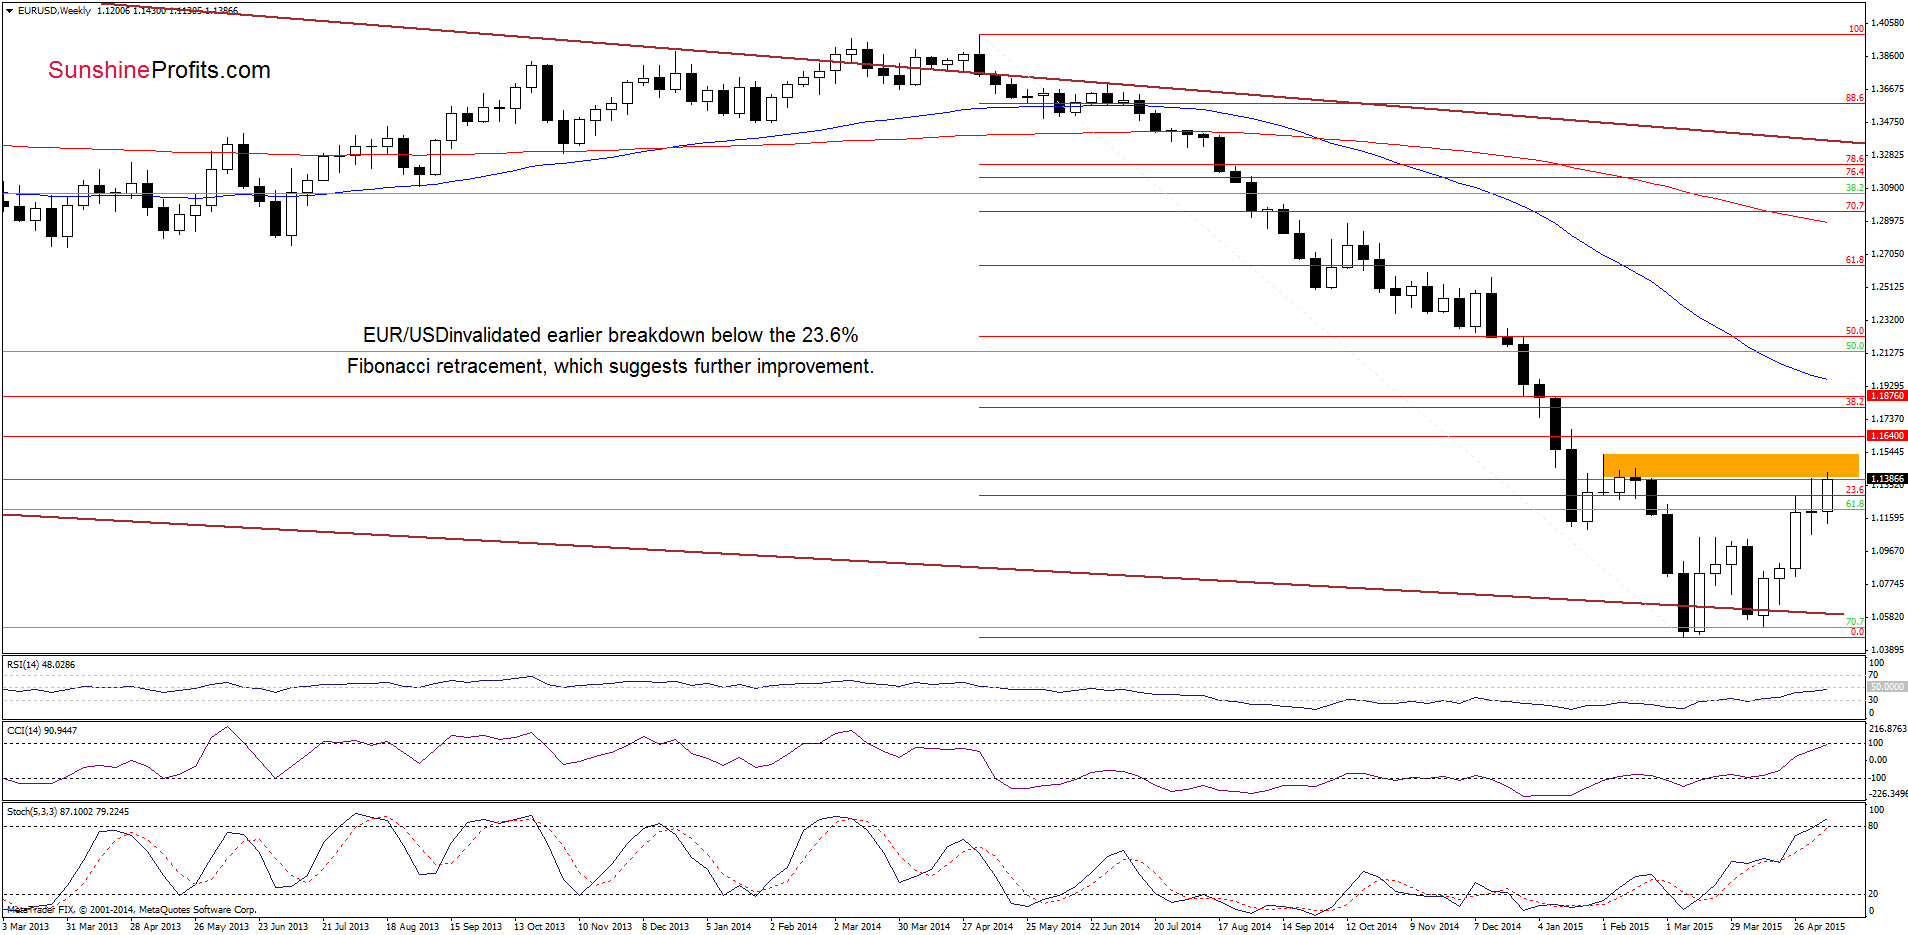
The situation in the medium-term perspective has improved as EUR/USD invalidated earlier breakdown below 23.6% Fibonacci retracement, which suggests further improvement.
How high could the exchange rate go? Let’s take a closer look at the daily chart and find out.
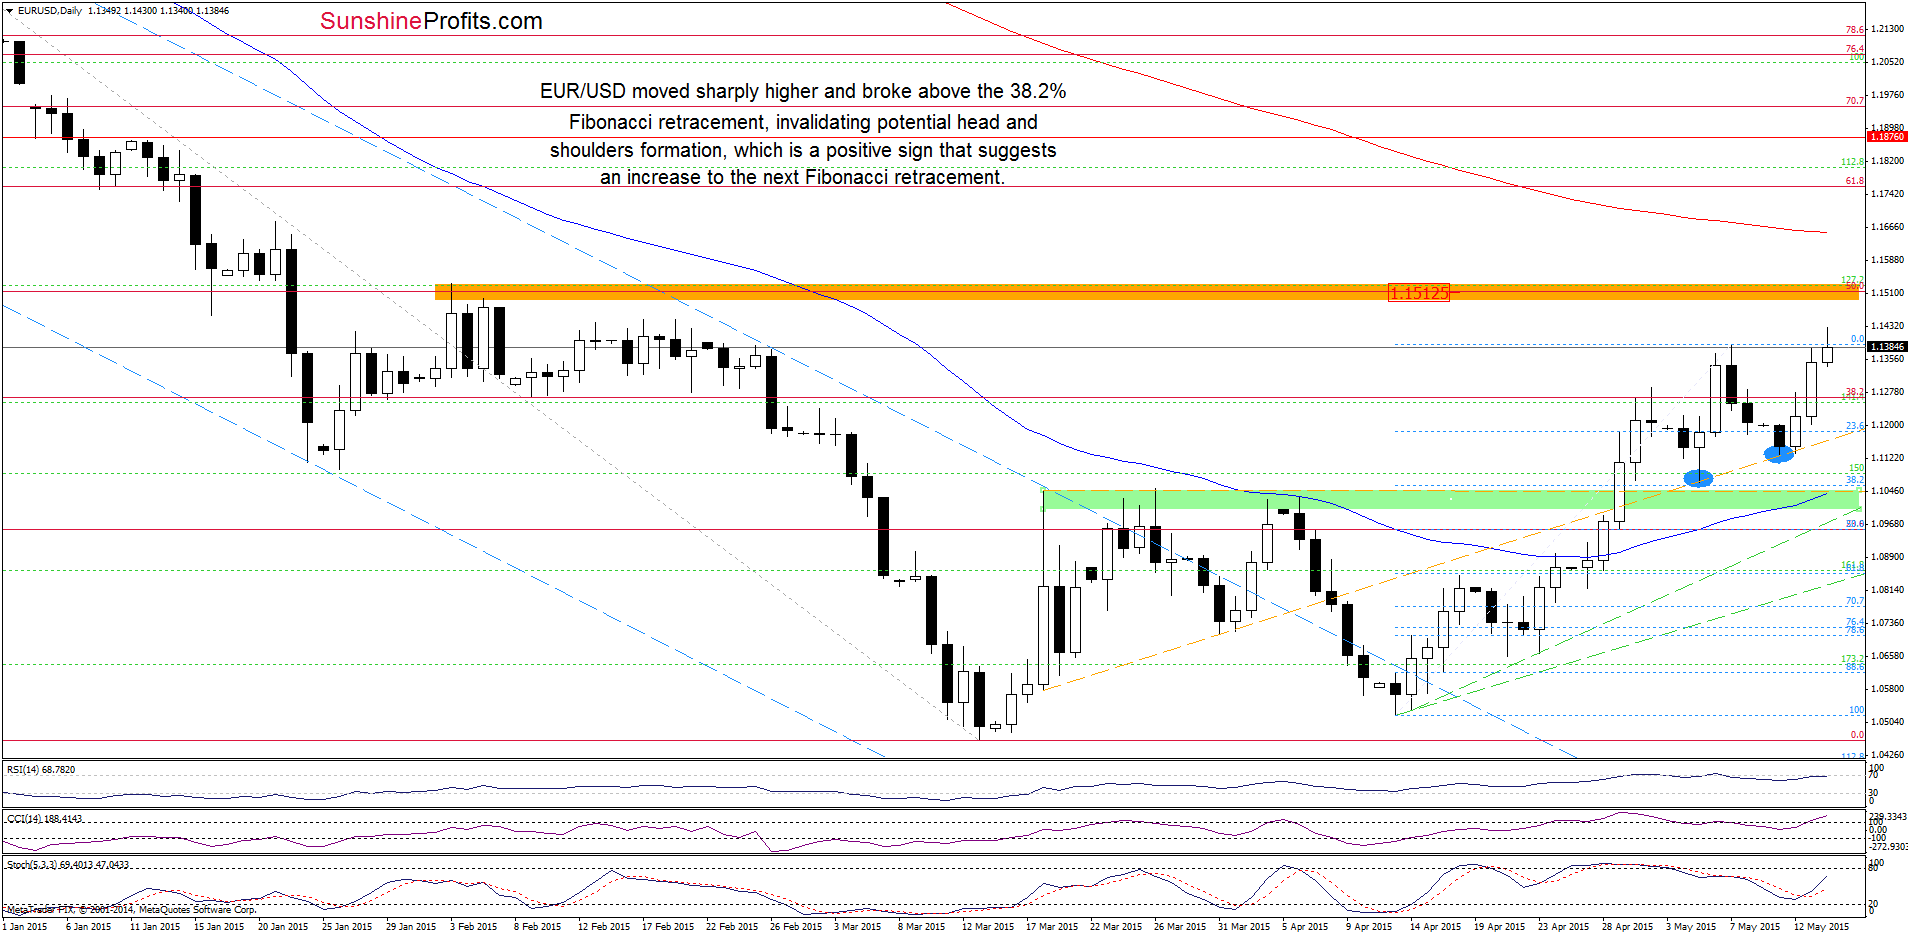
Yesterday, EUR/USD moved sharply higher, breaking above the 38.2% Fibonacci retracement and the previous high. In this way, the exchange rate invalidated potential head and shoulders pattern, which is a positive signal that suggests further improvement – especially when we factor in a buy signal generated by the Stochastic Oscillator and the medium-term picture. In our opinion, the initial upside target for currency bulls will be around 1.1512, where the orange resistance zone (created by the 50% Fibonacci retracement and the Feb highs) is. If it is broken, we might see an increase to around 1.1640, where the Nov 2005 lows are.
Very short-term outlook: bullish
Short-term outlook: mixed
MT outlook: mixed
LT outlook: mixed
Trading position (short-term; our opinion): No positions are justified from the risk/reward perspective at the moment. We will keep you informed should anything change, or should we see a confirmation/invalidation of the above.
USD/JPY
The medium-term picture hasn’t changed much as USD/JPY is still trading in a consolidation under the 61.8% Fibonacci retracement level, which makes the outlook a bit unclear. Today, we’ll focus on the very short-term changes.
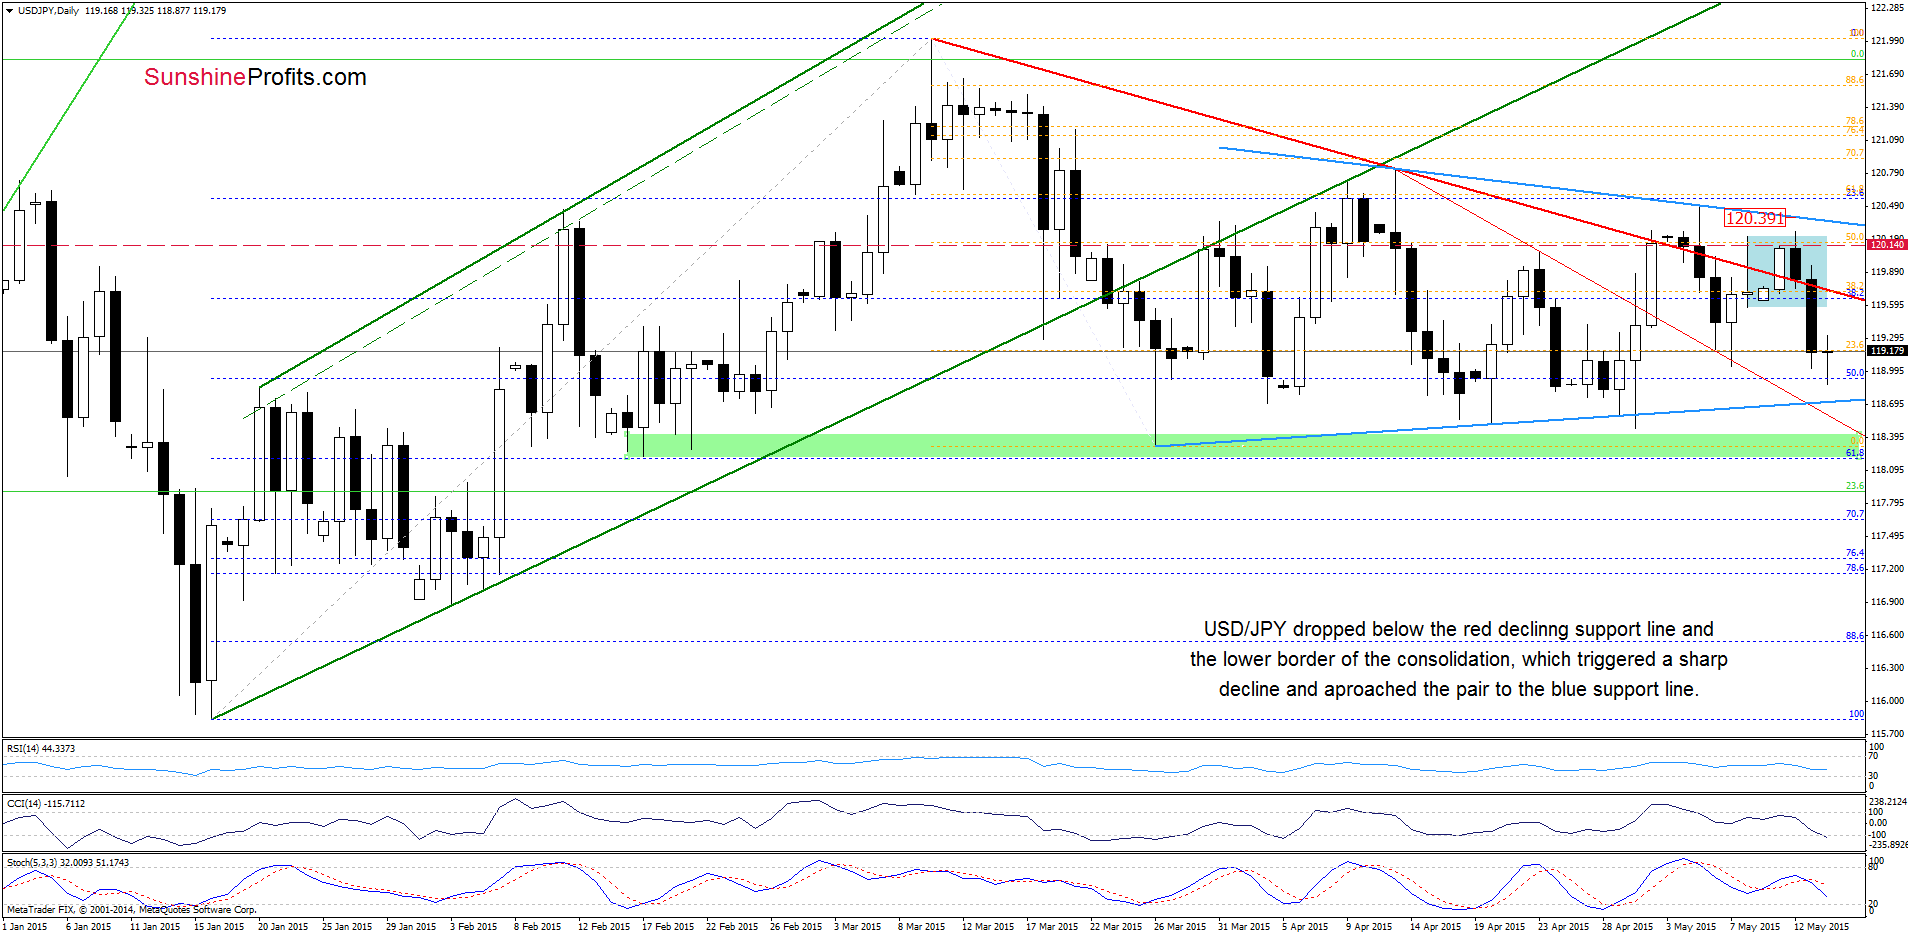
The first thing that catches the eye on the above chart is a breakdown under the red declining support line, which encouraged currency bears to push the exchange rate lower. As a result, USD/JPY broke below the lower border of the consolidation (marked with blue), which accelerated declines and approached the pair to the 50% Fibonacci retracement (based on the Jan-Mar rally). Earlier today, the exchange rate moved lower, which, in combination with the current position of the indicators, suggests that we’ll likely see a test of the strength of the blue support line (currently around 118.70) in the coming day(s). If it is broken, the next target would be the red support line (based on the Apr 13 and Apr 23 highs) or even the green support zone, which stopped declines several times in the previous months.
Very short-term outlook: bearish
Short-term outlook: mixed
MT outlook: mixed
LT outlook: bullish
Trading position (short-term; our opinion): No positions are justified from the risk/reward perspective at the moment. We will keep you informed should anything change, or should we see a confirmation/invalidation of the above.
USD/CAD
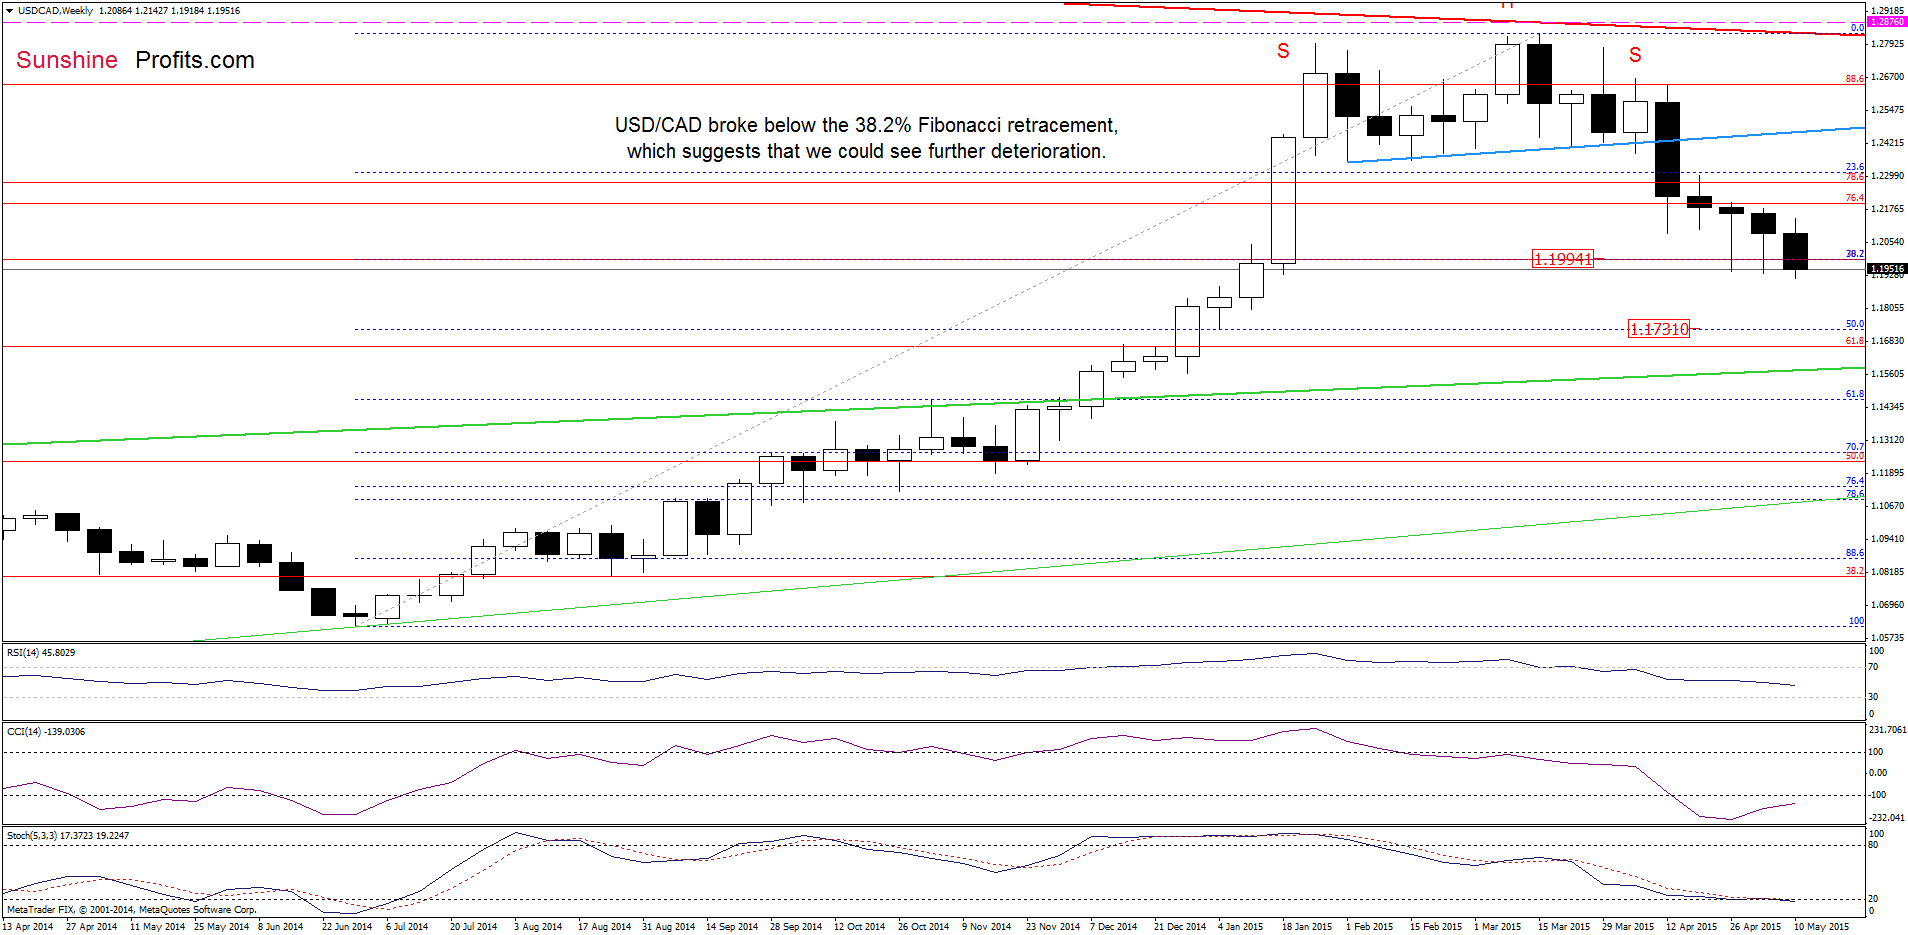
Looking at the above chart, we see that USD/CAD moved sharply lower earlier this week, which resuled in a breakdown nder the 38.2% Fibonacci retracement level. This is a negative signal, which suggests that currency bers could push the exchange rate even to around 1.1731, where the next Fibonacci retracement is.
How did this drop affect the very short-term picture? Let’s examine the daily chart and find out.
In our last commentary on this currency pair, we wrote the following:
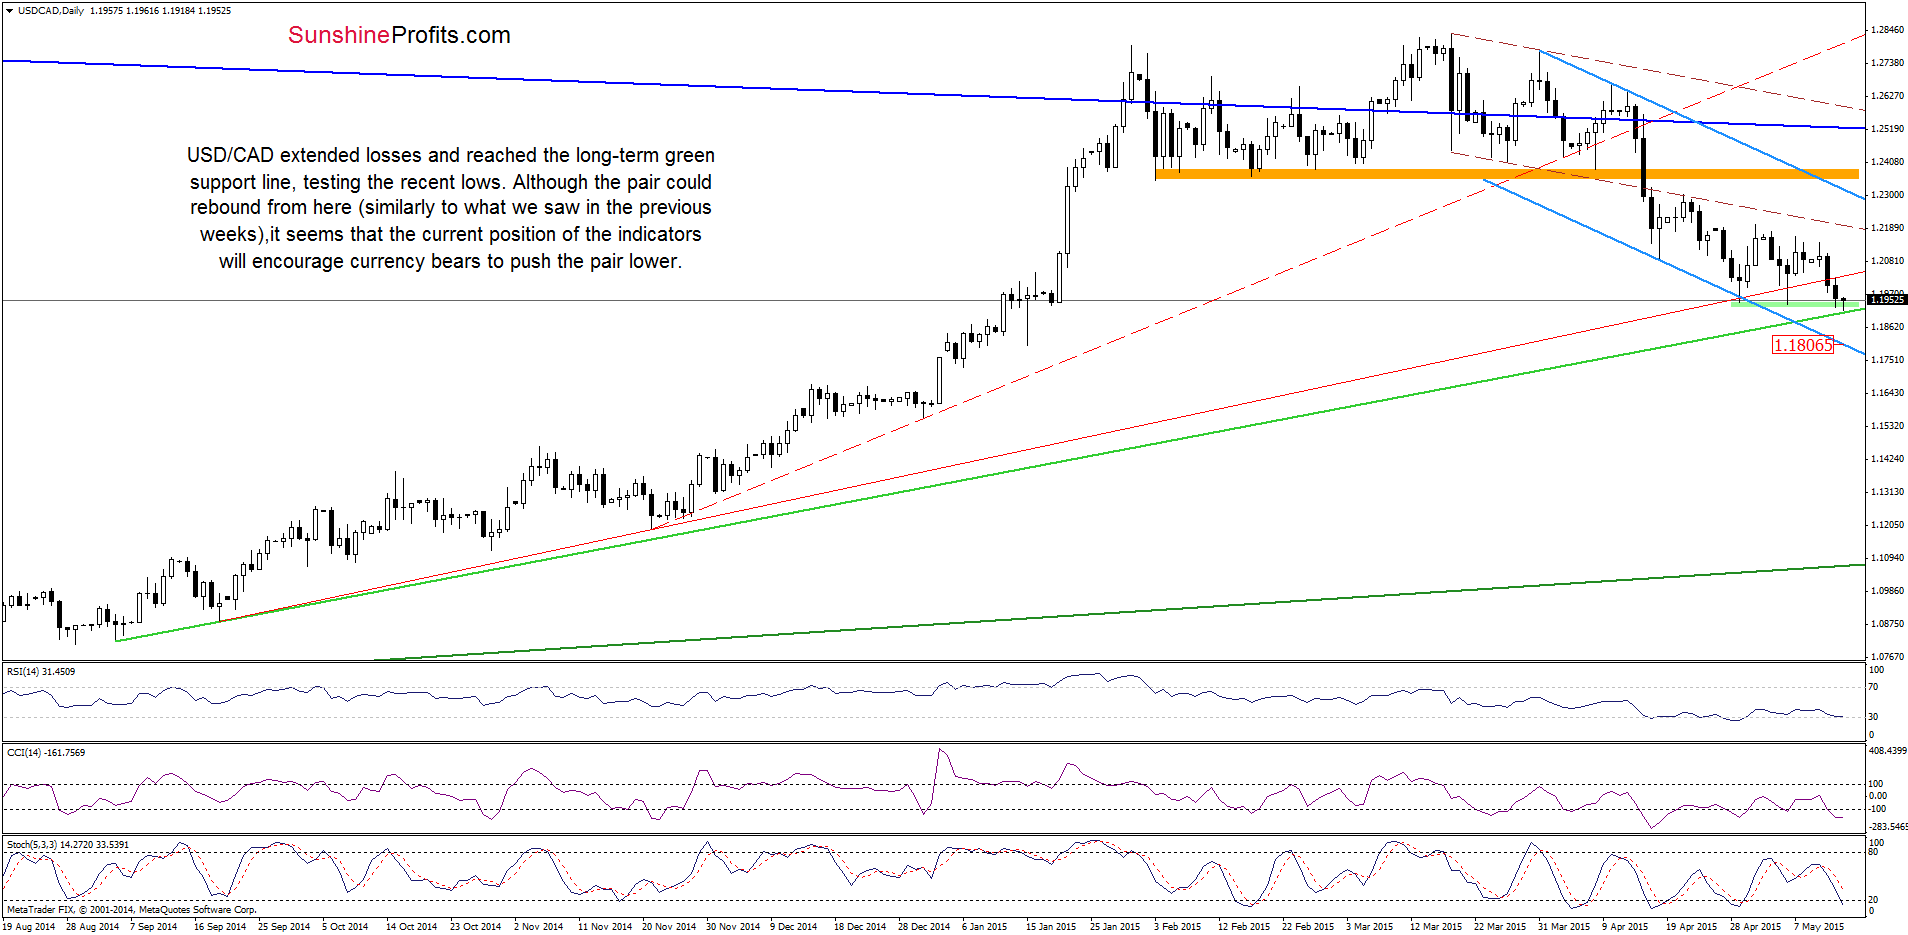
(…) USD/CAD moved lower and dropped to the long-term green support line once again. Although the pair could rebound from here (similarly to what we saw in the previous weeks), it seems that the current position of the Stochastic Oscillator (the indicator generated a sell signal) will encourage currency bears to test the strength of the support zone based on the recent lows (around 1.1940) in the coming days.
As you see on the daily chart, the situation developed in line with the above scenario and the exchange rate dropped to our downside target yesterday. Earlier today, USD/CAD extended losses and reached the next long-term green support line. If it withstands the selling pressure, we’ll likely see a rebound from here. However, we think that the current position of the indicators and the medium-term picture will encourage currency bears to push the pair lower. If his is the case, and USD/CAD declines below the green support line, we might see a drop to around 1.1806, where the lower border of the blue declining trend channel is. If it is broken, the next target would be the above-mentioned 50% Fibonacci retracement around 1.1731.
Very short-term outlook: mixed with bearish bias
Short-term outlook: mixed
MT outlook: mixed
LT outlook: mixed
Thank you.
Nadia Simmons
Forex & Oil Trading Strategist
Przemyslaw Radomski, CFA
Founder, Editor-in-chief
Gold & Silver Trading Alerts
Forex Trading Alerts
Oil Investment Updates
Oil Trading Alerts
