
Based on the January 20th, 2012 Premium Update. Visit our archives for more gold & silver articles.
In our previous essays, we emphasized that the long- and short-term trends for gold are up. In todays article, we will feature the current situation in the USD and Euro Indices and in the general stock market. After analyzing each of them, we will move to implications for the precious metals investors.
Lets start with the analysis of the USD Index (charts courtesy by http://stockcharts.com.)
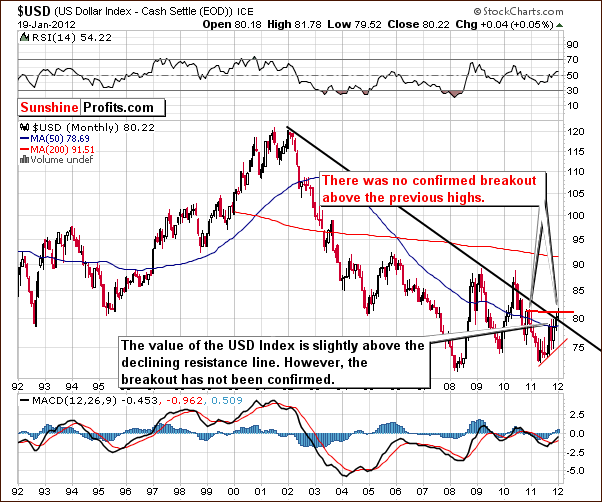
Our first chart this week is the very long-term USD Index chart. We see little change in the situation since last week. There has been no confirmed breakout above the late 2010- early 2011 highs and the long-term trend remains down.
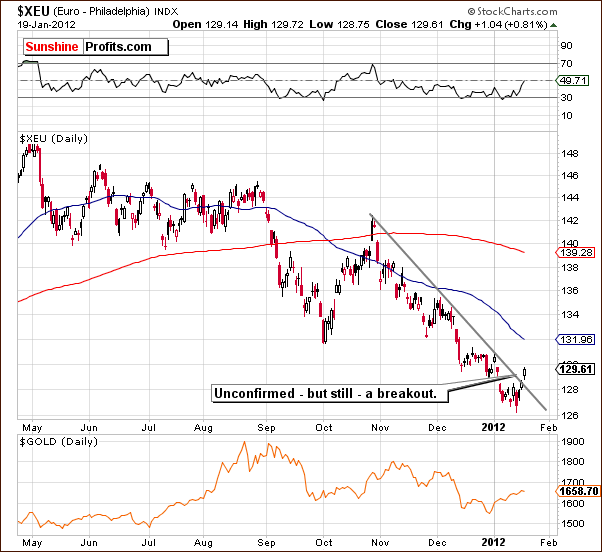
In the short-term Euro Index chart, there are some visible changes. Though not yet confirmed, there is a visible breakout above the short-term declining resistance line. This is positive news for the euro currency itself and bearish news for the dollar.
We have an early indication here that the USD Index will finally begin to decline as the sluggish situation seen during this month seems to be reversing. It is too early to draw conclusions, however, since the breakout here is not yet confirmed.
Consequently,the situation in the USD Index is a bit more bearish due to a sign of a possible breakout in the Euro Index. Since this move is not confirmed, the change is not extremely important yet, but the situation is more bearish for the dollar now as compared to recent weeks.
Lets move to the stock market.
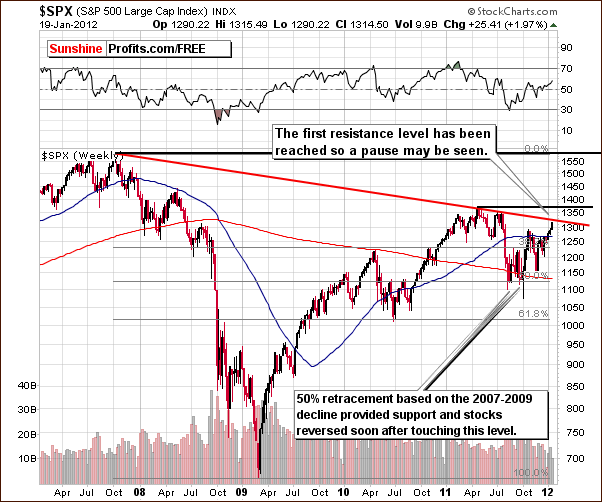
In the long-term S&P 500 Index chart we see that stocks moved close to an important resistance line formed by the 2008 and 2011 tops. It appears likely that a period of consolidation could begin very soon and the recent rally will likely pause for a bit.
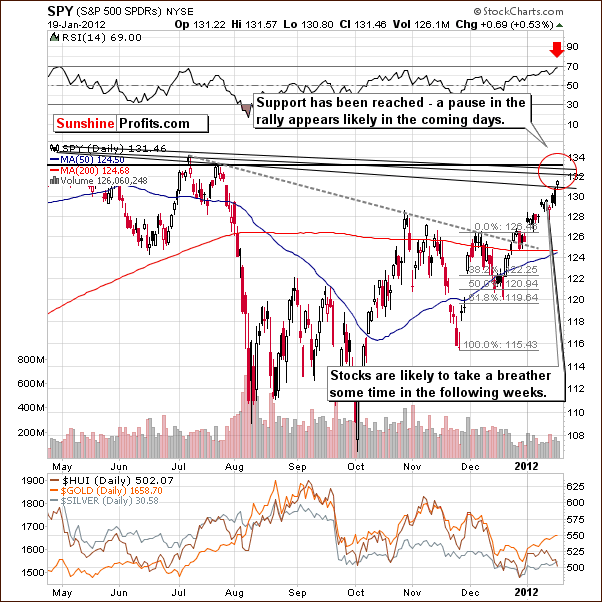
In the short-term SPY ETF chart, a proxy for the general stock market, we have a signal from the RSI levels that a local top may be close. This is based upon comparisons to past patterns where similar RSI levels have coincided with local tops as seen last July. A pause here in the recent rally would not be a surprise and could, in fact, be a healthy development for the general stock market.
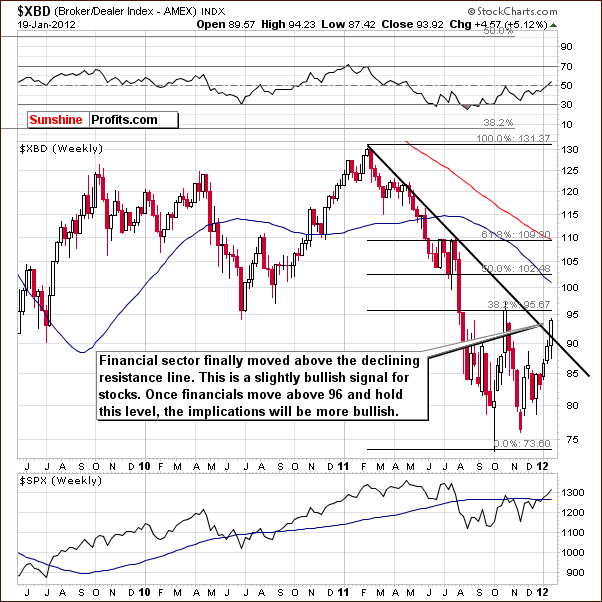
In the Broker Dealer Index (proxy for the financial sector) chart this week, we see a breakout above the declining resistance line. This follows a strong move to the upside and although we could see a move back to the support line (and then likely a reversal), the financials do appear to be showing signs of strength. This is a bullish development for stocks in general, as the financials often lead the general stock market to higher (or lower) prices.
Consequently,stocks are soon to encounter a major resistance line which will likely stall their recent rally. The strength seen in the financials, however, is often followed by moves to the upside for stocks in general. It seems probable that following a pause or small consolidation period, stocks could very well rally to new 2012 highs with the next resistance level around 1375. This is about 5% above Thursdays closing level for the S&P 500 Index.
Lets take a look at the correlations between the above-mentioned markets and gold to estimate the possible moves in the latter.
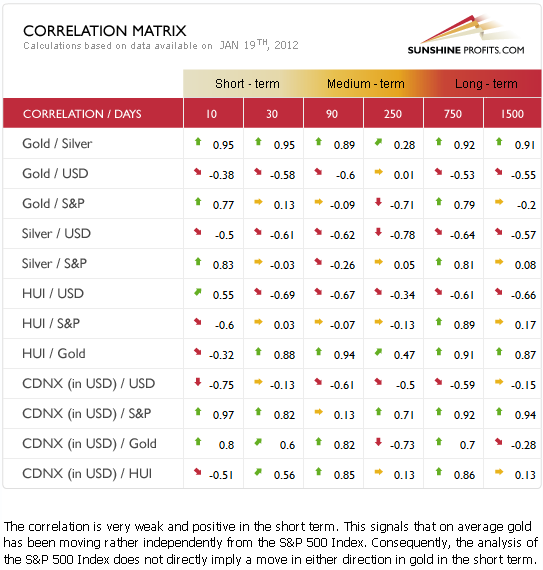
The Correlation Matrixis a tool which we have developed to analyze the impact of the currency markets and the general stock market upon the precious metals sector. A look at the short and medium-term columns for stocks in relation to precious metals shows that the expected pause in the general stock market does not seem to pose a serious threat to the precious metals market. The correlation with precious metals is weak in the short- and medium-term columns and it seems that gold and silver investors have little to worry about with respect to the general stock market outlook.
The USD Index situation is likely to provide bullish news for the precious metals sector. The negative correlation between the dollar and the metals means that declines in the USD Index will likely coincide with higher precious metals prices. All-in-all, the situation has improved slightly this week for gold, silver, and gold and silver mining stocks based on the short-term (and so far not confirmed) breakout in Euro Index.
Summing up, the situation in the currency markets is a bit more favorable for the precious metals this week. It appears that the USD Index could begin to move lower, which generally leads to higher precious metals prices. The euro appears to be strengthening and if its breakout is confirmed, will likely lead to good news for gold and silver investors.The general stock market situation is a bit more bearish this week as stocks have moved close to an important resistance line. A pause in the current rally is therefore likely but does not appear to impact the outlook in the precious metals sector. More details on precious metals (including price target for gold) are available to our subscribers in the full version of the above essay.
Thank you for reading.
P. Radomski
--
Among other important topics, our latest Premium Update covers the following issues:
- Gold stocks' underperformance
- How much more can miners decline before starting their own significant rally?
- How high is gold likely to go before a meaningful correction is seen
- Analysis of gold, also from the non-USD and yen perspectives, GLD ETF, silver, SLV ETF, silver-to-gold ratio, platinum and much more.
We encourage you to Subscribe to the Premium Service today and read the full version of this week's analysis right away.
