
Based on the September 27th, 2013 Premium Update. Visit our archives for more gold articles.
In the previous week the Fed surprised markets when it decided to stick with its massive stimulus measures. However, in the following days some officials said that the U.S. central bank could still begin tapering later this year. Since then, markets are no clearer on when the Fed will eventually taper its stimulus.
From today’s point of view, it seems that this uncertainty over tapering has kept the price of gold in its narrowest range since the June bottom. Since the August low the yellow metal has been trading between $1,271 and $1,434.
Yesterday, investors received mixed economic data, which fueled persistent uncertainty over the outlook for U.S. monetary policy and gave conflicting signals on the health of the economy. According to Reuters, contracts to buy previously owned U.S. homes fell for the third straight month in August but fewer Americans filed new claims for jobless benefits last week.
What impact did the above have on the yellow metal? Gold lost almost 0.7% and dropped below $1,330 an ounce. It seems that buyers keep on the sidelines, although wrangling over the U.S. budget supported prices and pressured the dollar.
Speaking of the greenback… Yesterday, after economic data was released, the dollar rebounded and climbed above 80.76 on an intraday basis. However, it was up by only 0.29% - not a strong bullish reaction. If a given market is supposed to react somehow, based on some important information, but doesn’t, it’s a sign of either strength or weakness – the latter in the case of the USD Index. So, has the outlook for the USD Index changed since our previous essay was posted? Will the dollar recover quickly? What impact could it have on gold?
Today, we’ll examine the US Dollar Index once again (from many perspectives) and take a look at charts of gold priced in other currencies to see if there’s anything on the horizon that could drive gold prices higher or lower in the near future. We’ll start with the short-term USD Index chart (charts courtesy by http://stockcharts.com)
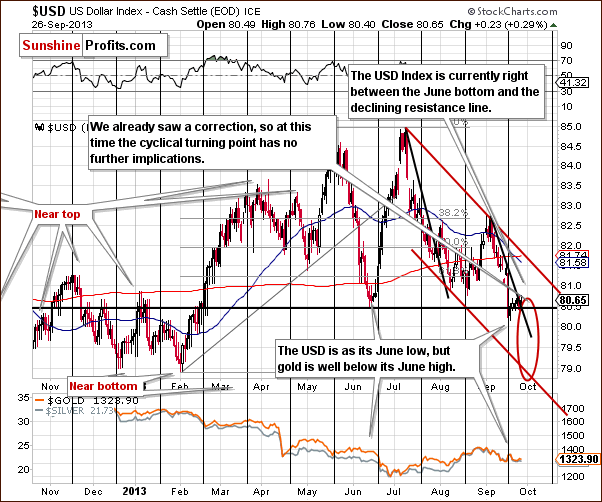
On the above short-term chart, we see that the USD Index remains between the support line based on the June low and the resistance line based on the September highs. Therefore, we will probably see a breakout or a breakdown in the near term. If there is such action, a bigger move to the upper or lower border of the declining trend channel is quite probable. Because of this uncertainty, the downside target area has been modified and marked with a red ellipse.
Generally, the situation in the USD Index evolved in line with the True Seasonal tendencies.
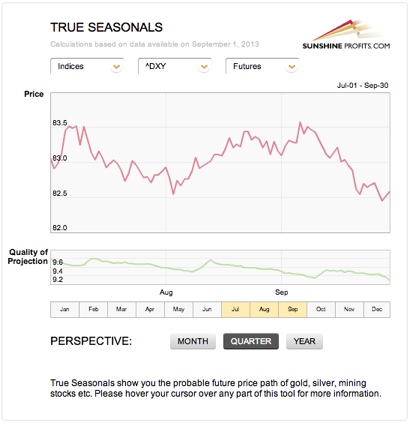
We saw a small correction, as seen on the short-term chart. The above patterns are suggesting another move lower in the final part of this month, which could mean a breakdown below the June low and a more decisive move to the downside.
Please note that the quality of the prediction (green line in the lower part of the above chart) declines in the final part of the month, which means that a deviation (in the form of a bigger decline) is not unlikely.
The bearish implications are for the first days of October, so the move lower could be seen quite soon. That’s one of the factors that make the short-term outlook for precious metals not as bearish as one might view it based on the medium-term trend.
Now, let’s examine the weekly chart.
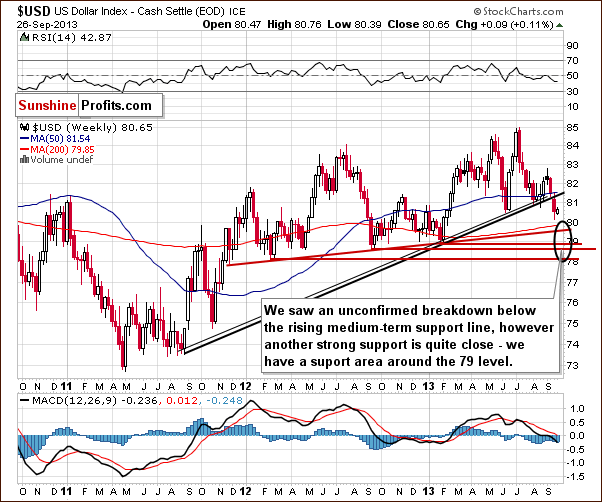
On the above chart, we see that the breakdown below the rising, medium-term support line is still not confirmed (weekly closing prices this week and next will confirm the breakdown if they are seen below the rising support line). Taking into account what happens on the short-term USD Index chart, the dollar could move lower – to the area marked with the black ellipse on the above chart - but it doesn’t have to.
As we wrote in our previous essay on the dollar and gold:
(…) the target area is quite unclear because of the multiple support lines, including the long-term support line seen on the previous chart. It seems that we could see the US Dollar Index in the 78-79 range before the bottom is in. Again the exact price target is unclear.
Therefore, the area marked with the black ellipse is the lowest downside target level.
Let’s check the long-term outlook.
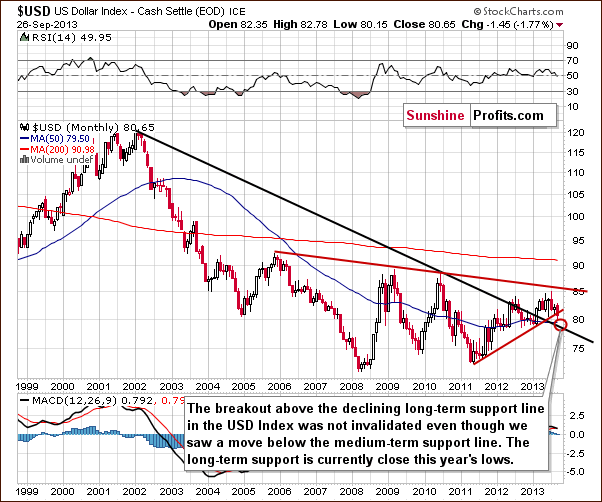
The situation in the long-term chart hasn’t changed much recently. The long-term breakout above the declining long-term support line was not invalidated, even though the USD dropped heavily last week.
However, since the medium-term breakdown (below the support line marked in red) is visible also from this perspective, we could see some short-term weakness anyway. It seems that the long-term support line will stop the decline – that is, if the USD Index reaches that low. Therefore, from the long-term perspective, it seems that the downside is still quite limited.
With a possible move lower in the case of the USD Index in the very short term, perhaps there is significant upside potential for gold?
Having discussed the current situation in the U.S currency and the True Seasonal patterns’ impact on future movements in the dollar, let’s now move on to the chart that shows us the yellow metal’s performance from the non-USD perspective. Approximately, it’s the price of gold multiplied by the USD Index (technically: divided by its opposite) – it shows changes in the price of gold if we leave out the influence of the USD Index.
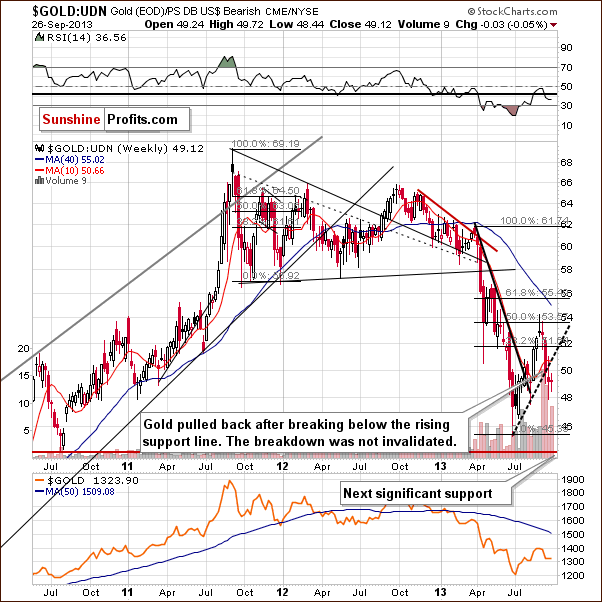
On the above chart, we see that the breakdown below the rising short-term support/resistance line was not invalidated. The situation deteriorated slightly as we saw another weekly close below the rising support/resistance line based on the June and August bottoms.
Therefore, from this perspective, the implications remain bearish.
Now, let’s examine gold from another perspective – priced in British pounds.
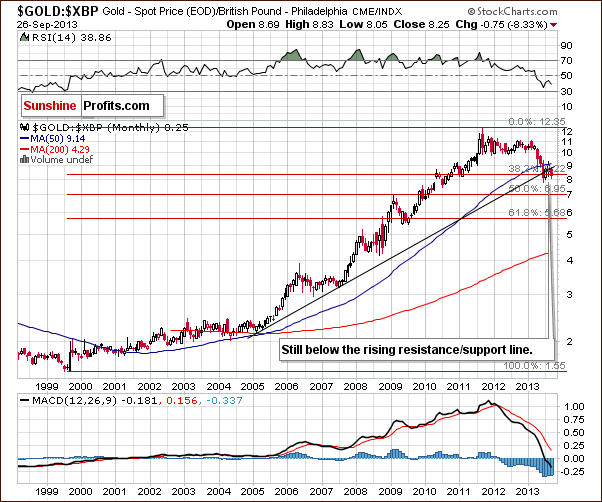
Earlier this month, gold gave up the August gains and dropped below the rising resistance line once again. Additionally, the breakout above the 50-month moving average was invalidated. These invalidations are bearish signals.
Before we summarize, let’ take a look at gold priced in euros.
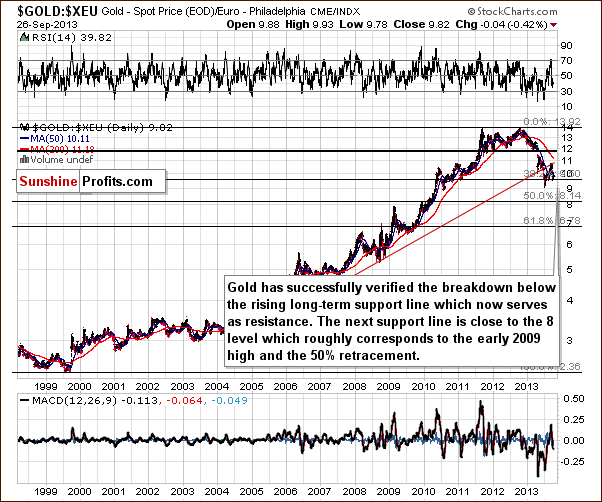
On the above chart, we see that the situation hasn’t changed much. Although gold priced in euros pulled back in the past week, it still remains below the previously-broken, rising support/resistance line (marked with red). Therefore, the medium-term implications remain bearish.
Summing up, the medium-term outlook for gold remains bearish. Despite last week’s show of strength, the downward trend is not threatened at the moment. However, taking into account the short-term action in the dollar and the True Seasonal patterns’ short-term implications for the USD Index, the short-term outlook for precious metals may not be as bearish as one might view it based on the medium-term trend. Simply put, a pullback in gold would not surprise us even though the medium-term trend is down.
Subscribers to our Premium Service receive quick Market Alerts with description of changes in the situation and trading suggestions. If you'd like to receive them too, please sign up.
Thank you.
Sincerely,
Przemyslaw Radomski, CFA
