
The decline that we saw in the first half of the week was largely attributed to the situation in Libya. On Tuesday, the oil market received further confirmation that Libya's oil production is bouncing back as the country's National Oil Corp. said that production had risen to more than 550,000 barrels a day, beating earlier expectations. As a result, crude oil hit a fresh two-month low of $99.01. Despie this deterioration, the combination of upbeat Chinese growth numbers and bullish the EIA weekly report supported the price in the following day. On top of that, yesterday’s mostly upbeat U.S. economic data and tension fears between Ukraine and Russia pushed the commodity to a one-week high. With the recent rally, crude oil reached an important resistance zone. At this point, you may wonder whether crude oil will go north or south. Is it possible that the oil-to-oil-stocks and stocks-to-oil ratios will give us some interesting clues? (charts courtesy by http://stockcharts.com).
Let’s start today’s essay by focusing on the oil-to-oil-stocks ratio. What impact could it have on future oil moves? Let’s examine the very short-term picture.

As you see on the above chart, at the end of the previous month, the ratio reversed after an increase to the red declining resistance line (we saw similar price action also in mid-June and in mid-April) and declined, reaching the June low. In the following days, the proximity to this key resistance line was enough to trigger another downward move, which pushed the ratio to a fresh 2014 low. As a result, crude oil also declined and hit a two-month low. Despite this deterioration, the ratio rebounded sharply, invalidating the breakdown below the previous lows, which translated to a higher price of the commodity. Looking at the above chart, we see a very important improvement – a breakout above the major resistance line. This is a strong bullish signal, which suggests that higher values of the ratio (and crude oil) are just around the corner. However, we‘ll be more optimistic if the ratio also breaks above the 50-day moving average.
Once we know the situations in the oil-to-oil stocks ratio, let’s take a closer look at another interesting ratio, which can give us interesting tips and examine the stocks-to-oil ratio.
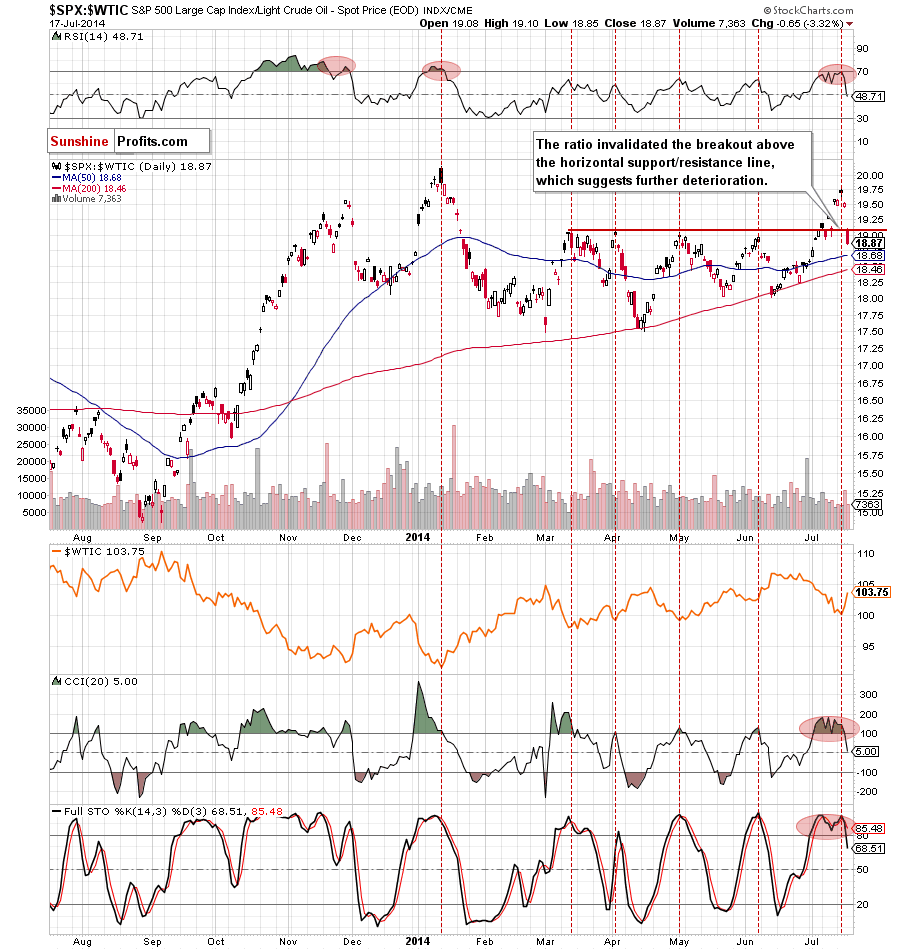
The first thing that catches the eye on the above chart is an invalidation of the breakout above the strong resistance line based on the previous highs. As is well known, an invalidation of a breakout is a strong bearish signal, which usually triggers further deterioration. Will we such price action in the coming days? When we take a closer look at the daily chart, we see that the CCI and Stochastic Oscillator generated sell signals, which suggests that lower values of the ratio are still ahead us. At this point you may ask a question: Ok, but what does it mean for crude oil?
As it is clear from the chart above, every high in the ratio corresponded to the bottom of the correction in crude oil. We saw such price action in January, March, April, May and June. In all previous cases, declining ratio triggered an upward move in light crude. Therefore, if history repeats itself once again (which is more likely than not – especially when we factor in the above-mentioned sell signals), we’ll see further deterioration in the SPX:WTIC ratio, which will translate to higher price of crude oil.
Summing up, Although the situation in crude oil is unclear, it seems that a picture, which emerges from the above ratios is quite optimistic. If the breakout in the oil-to-oil-stocks ratio does not turn to a fakeout and a correction in the stocks-to-oil ratio accelerates, we’ll see another upward move in crude oil. Therefore, we are convinced that it’s worth to keep an eye on these ratios in the coming days, because we’ll likely receive a valuable clues where the commodity head next.
Thank you.
Nadia Simmons
Forex & Oil Trading Strategist
Forex Trading Alerts
Oil Investment Updates
Oil Trading Alerts
