
Based on the June 14th, 2013 Premium Update. Visit our archives for more gold articles.
One of the main events of recent days was the strength of demand in the oil market. Yesterday the Brent Crude Oil climbed up to over $106 per barrel and the Light Crude Oil reached $98 a barrel. These are the highest levels since September 2012.
Looking at these reactions, it seems that investors are worried about the correlation between oil prices and the political unrest in the Middle East. Although Syria is not a major oil producer, there are serious concerns that the conflict in the country will spread to other countries in the region.
"One way or another, the Syrian conflict is escalating. It is not only morphing into a US-Russia proxy war but also into a US-Iran proxy war and nobody knows how this will terminate," says energy analyst Olivier Jakob of Petromatrix.
And speaking of this, we have to mention the G8 summit. Yesterday, the presidents of the United States and Russia were talking about the above-mentioned conflict. As we know, Washington and Moscow had different views over Syria. Despite that fact, US President Barack Obama and Russia's Vladimir Putin agreed that the bloodshed must stop and that the warring parties should be brought to the negotiating table. Both leaders had also instructed their teams to work on a peace conference about Syria in Geneva.
Is that really enough to start looking more optimistic at the situation in the Middle East? We will see in the near future.
The above-mentioned increase in crude oil price encouraged us to take a closer look at its chart (charts courtesy by http://stockcharts.com).
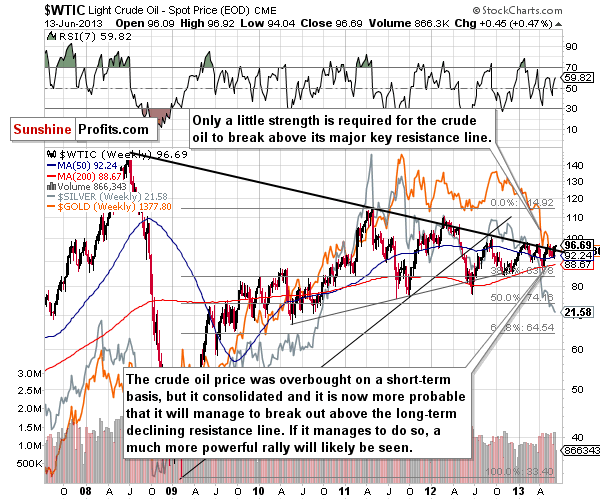
In today’s Crude Oil price chart, we see much of the same situation as we have multiple times for more than a year after a substantial price rally. Crude oil is once again trying to break out above the declining resistance line, which is something it has failed to do on numerous past attempts. The crude oil price has increased since our last note published on May 24, 2013 but it’s hard to take this small increase as a sign of improvement.
But what could happen if prices move above this resistance line?
Before we answer the question, let’s move on to the yellow metal’s long-term chart.
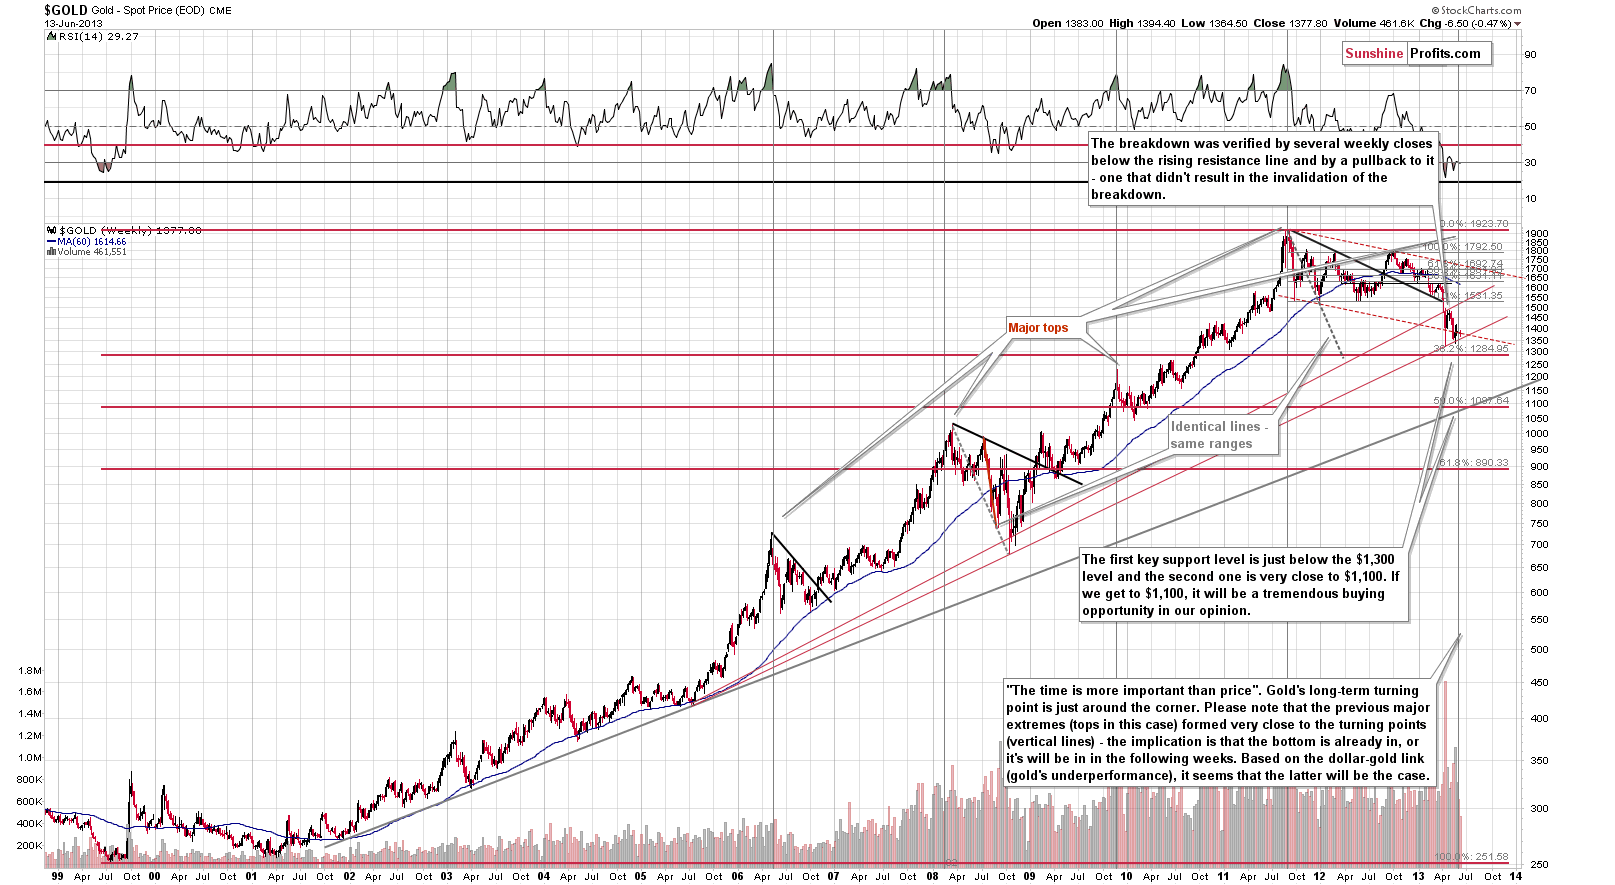
In today’s very long-term gold chart, we see that the trend remains down. Although gold moved a little higher last week the outlook continues to be bearish. The most important factor on the above chart supporting the bearish case is the cyclical turning point which is very close.
As we wrote in our last Friday's essay:
We are still likely to see declines after the cyclical turning point from this long-term perspective. The turning point should work on a “near to” basis and declines will likely be seen sooner rather than later (and the bottom is likely weeks away, not months away).
Now, let’s take a look at the other factors that might have an impact on gold.
Speaking of this, we turn to the long-term S&P 500 Index chart
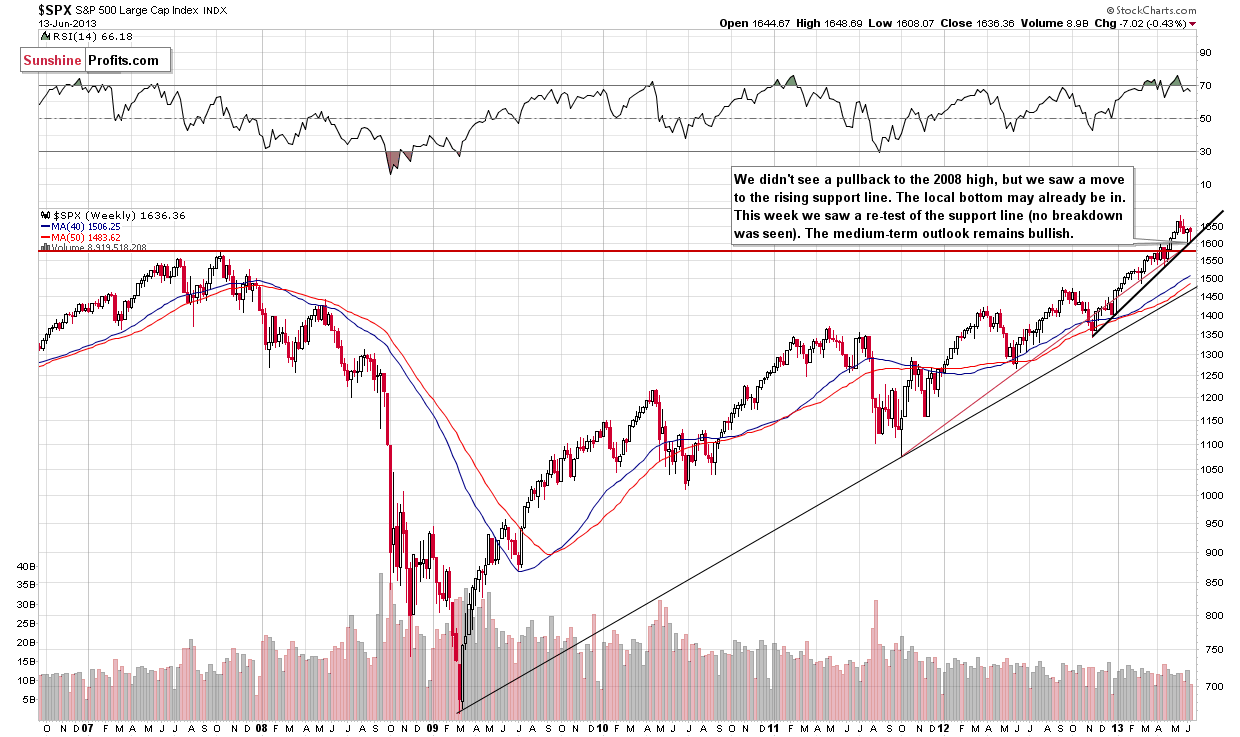
Although stocks tested and declined to the level of the 2007 highs on Thursday, price levels quickly bounced off the support line. This could mean that the bottom of the last correction may be in. Even if it was deeper than the previous one, it doesn’t change the overall picture of the market. As long as stocks are able to hold up above the 2007 high the uptrend is not threatened.
That’s why we think that the situation in the medium-term remains bullish. In this case, what happened on the S&P 500 Index chart might have been a bearish factor for the precious metals.
Perhaps the most bearish factor of all is seen in our next chart.
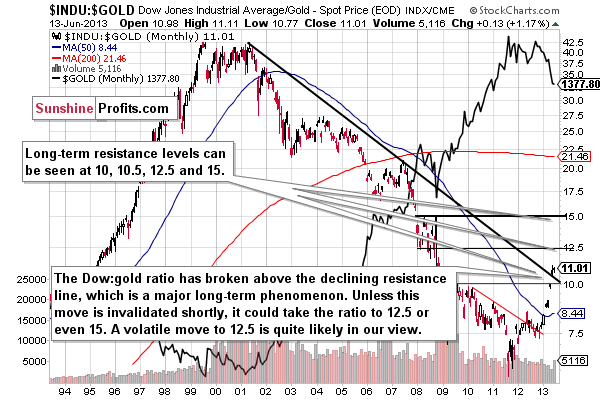
In today’s Dow to gold ratio chart, we have another significant bearish factor. A long-term major breakout was seen here last month, which is really a bearish phenomenon. It has not been invalidated up to this day and is now in its second month above this line, so the suggestion here is that another big decline is in the cards for gold.
And now let’s move on to the last chart that we would like to discuss.
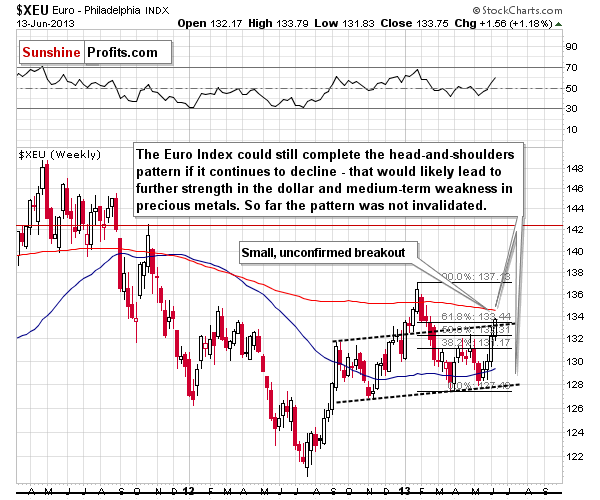
During the past week, the Euro Index has continued its rally and reached the upper dashed line (parallel to the line based on the local bottoms). To be precise, we saw a small breakout, but it was not yet confirmed. Despite this fact, the overall head-and-shoulders pattern wasn't invalidated in our opinion – not yet. The above-mentioned line is additionally supported by a Fibonacci retracement level. This resistance zone may stop the rally (and the breakout could still be invalidated, especially given the medium-term support in the USD Index) and the head-and-shoulders pattern could still be completed if the euro declines once again.
What impact could this have on gold?
Unfortunately, that would lead to further strength in the dollar and likely medium-term weakness in precious metals.
Summing up, the situation in gold remains bearish. Despite gold’s move up a little higher last week, the situation still looks bad, and it seems that further declines will be seen relatively soon. Of course a decisive breakout in crude oil could trigger a rally in gold, but since we saw several failed attempts for the crude oil in the past months, it seems best to wait for a confirmation of the breakout before discussing meaningful bullish implications for gold.
Thank you for reading. If you're interested in reading the full version of today's analysis with our suggestions regarding positioning yourself in the current market environment (trading positions, long-term investments), please sign up.
Sincerely,
Przemyslaw Radomski, CFA
