
Since my previous essay the short-term situation in light crude has improved slightly. The oil market extended gains after U.S. Federal Reserve Chairman said its huge stimulus program would stay in place for some time. The view that continuing stimulus from the Fed would support global economic growth resulted in a further rally to over $107 per barrel which is light crude’s highest level since March 2012.
On Thursday light crude dropped from a 15-month high as investors took profits after three weeks of growth. Despite this decline, the following two days brought a pullback. Yesterday the price edged up slightly, reversing earlier losses, after economic and industry data announcements in the United States and China, the world's biggest oil consumers.
According to Reuters, West Texas Intermediate traded near a three-day high on speculation U.S. crude inventories fell for a third week, signaling increased demand in the world’s biggest oil consumer.
What impact have these circumstances had on the light crude’s chart? Where are the nearest support zones and resistance levels? Let's take a closer look at the charts and find out what's the current outlook for U.S. crude oil.
As I wrote in my essay on crude oil on July 9, 2013:
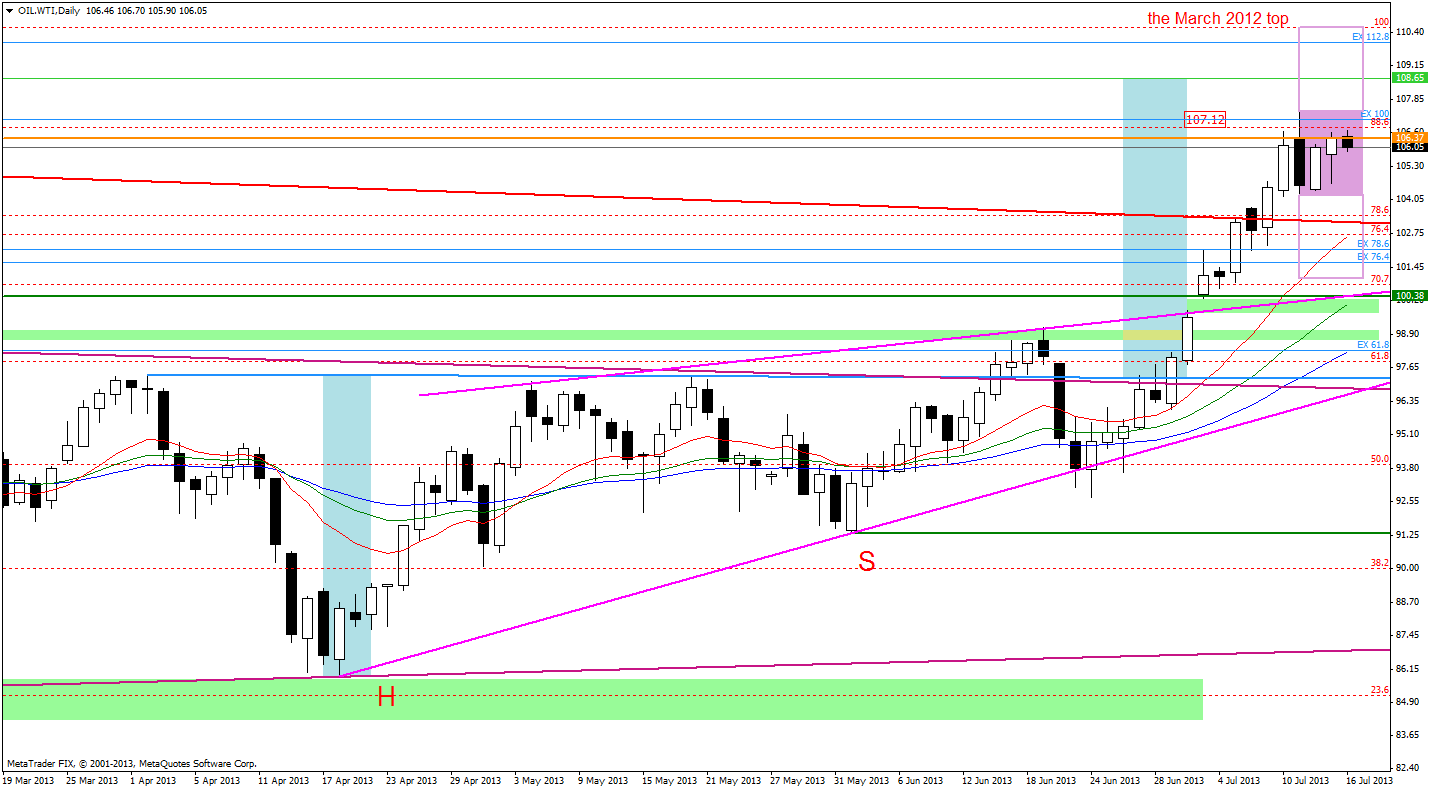
“If the buyers manage to break above the strong resistance zone based on two Fibonacci retracements (the 76.4% and 78.6% levels), we might see a bullish scenario: a further rally to at least $106.37, where the May 2012 height is. The next resistance level is around $107.12, where the 100 percent Fibonacci price projection is.”
On the above chart we see that recent increases have led light crude’s price to both target levels. These circumstances encouraged investors to take profits after three weeks of growth, and the price dropped to $104.29 per barrel. As I previously mentioned, the following two days brought a pullback and light crude returned near its last week top.
The recent days have formed a consolidation on the chart. If the oil bulls manage to break above the Thursday’s top, the price might increase to at least $108.65 where the price target for the inverse head and shoulders pattern is. The next resistance level is the March 2012 top.
At this point, it’s worth to mention the inside bar candlestick pattern. It is characterized by the inside candle’s price action being completely covered by the price action the day before. According to theory, if the buyers manage to break above the resistance level (the July 11 top) the price target for the pattern will be around the March 2012 top. We might also see a bearish scenario: if the price drops below support level (the July 11 bottom), the price target for the pattern will be around $101 per barrel.
Once we know the current situation in the daily chart, let’s zoom in on our picture of the oil market and see the 4-hour chart.
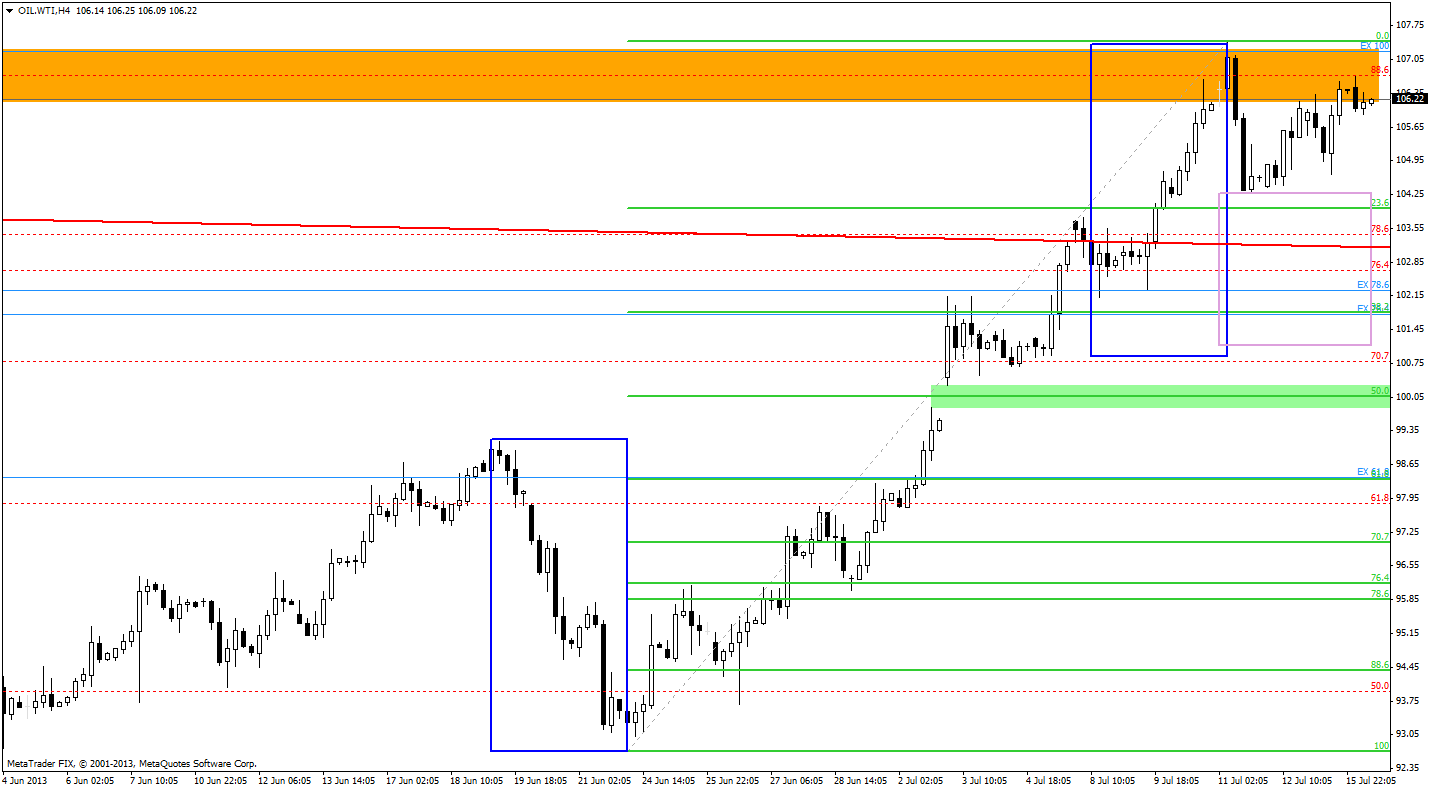
On the above chart we see that the recent decline was quite small. When we factor in the Fibonacci price retracements, we clearly see that the correction didn’t even reach the 23.6% level. Yes, it was deeper than the previous one but it doesn’t change the overall picture for the light crude. On a side note, notice that the above-mentioned decline is still much smaller than the corrective move from the June 19 top to the June 24 bottom which is a bullish factor for me. Even if the oil bears manage to break below the Thursday bottom and get to the price target for the inside bar pattern, the correction would be almost the same as the one we saw in June. From this point of view the short-term situation remains bullish.
Summing up, the short-term technical situation remains bullish. The price of light crude has moved higher and reached its target levels. As I previously mentioned, on the daily chart we see a consolidation which is also an inside bar candlestick pattern. From my point of view, the breakout above resistance level (the July 11 top) or the breakdown below support level (the July 11 bottom) will mark the beginning of the next big move in light crude.
Please remember that you should keep an eye on the fresh weekly information on the U.S. stockpiles of crude and refined products which will be published by the American Petroleum Institute on Wednesday. This may allow you to gauge the strength of oil demand of the world’s largest oil consumer. Investors are also waiting for the Fed Chairman Ben Bernanke to testify before Congress on Thursday as further signals on when the Fed plans to scale back its huge bond-buying program may surface.
These might have significant impact on further moves in the oil market.
Thank you,
Nadia Simmons
