
Briefly: we don’t suggest closing longs.
In our alert on Dec. 30, we wrote that the Reserve Bank of India (RBI) had warned of risks associated with Bitcoin. Following the RBI’s statement, BuySellBitco.in, one of the major trading platforms in India, suspended its main operations.
However, today the Hindu reported that Bitcoin operators were getting back to business. BuySellBitco.in is still out waiting for clear regulations, but some other companies, like Unocoin resume operations on a limited scale and there’s even a new market entrant, BitQuick.in.
As it seems, the bitcoin market is still very much alive in India. When the Indian authorities decide to issue guidelines on bitcoin trading, we could see more businesses coming back from a hiatus.
Now, let’s check how bitcoin has moved against the U.S. dollar since our last alert was posted.
Bitcoin closed the day 0.3% down on Mt. Gox yesterday compared with the previous day’s close. The volume at btc 3,891.44 might be a sign that the downward pressure is subsiding.
The movement today seems to be confirming that. The volume (btc 5,062.49) is already higher than the overall volume yesterday and bitcoin has gone up 1.3%. At the moment of writing this (around 8:00 a.m. EST), the currency is trading at $932.00.
The picture that emerges is of a move down losing strength and, perhaps, of a move up gaining momentum.
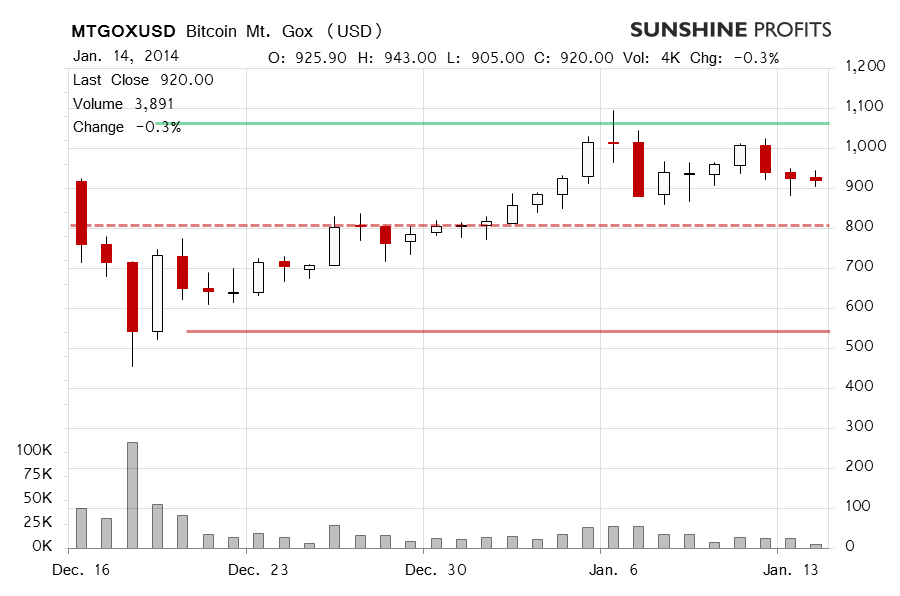
Bitcoin is still trading between $800 (our stop-loss level and the dashed red line on the chart) and $1,000-1,100 (which coincides with the solid green line on the chart). A move below $800 could change the outlook to bearish, while a move above $1,000 could reinforce the bullish outlook. Right now, we’re still waiting for the next big move confirmed by significant volume.
Questions from Readers
Recently, we have received some interesting questions from our readers. We will address them in this alert so that other readers can also benefit from the answers.
Q: Did we just see a confirmed breakdown on this chart?
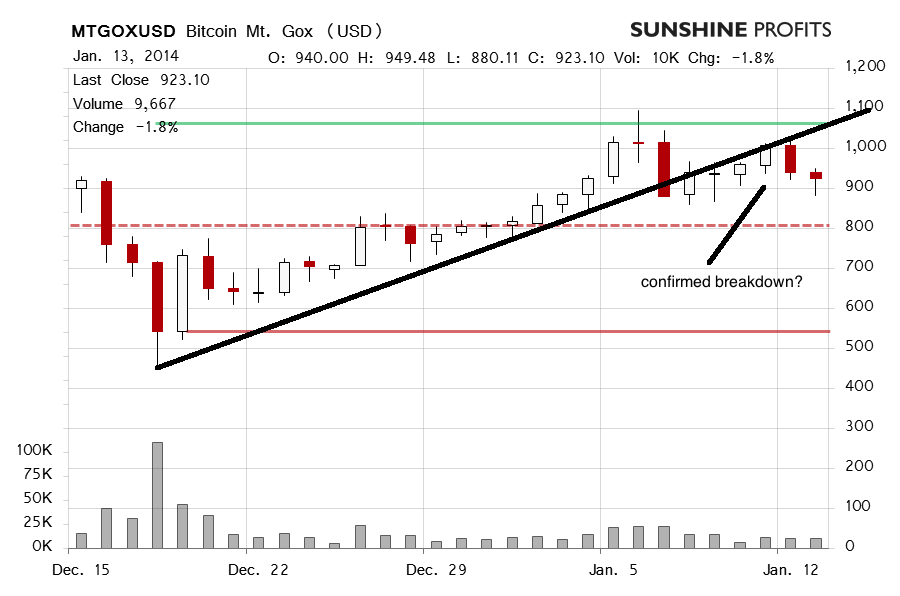
A: If we take a look at this line, it seems that we’ve seen 7 daily closes below it. But the construction of such line is very arbitrary. Namely, it is based on the Dec. 18 low ($455) and the Jan. 12 high ($1,022.99). If the first point seems rather intuitive, the second is purely subjective. Why would we chose Jan. 12 rather than the Jan. 6 high? Let’s draw a similar chart with such a line.
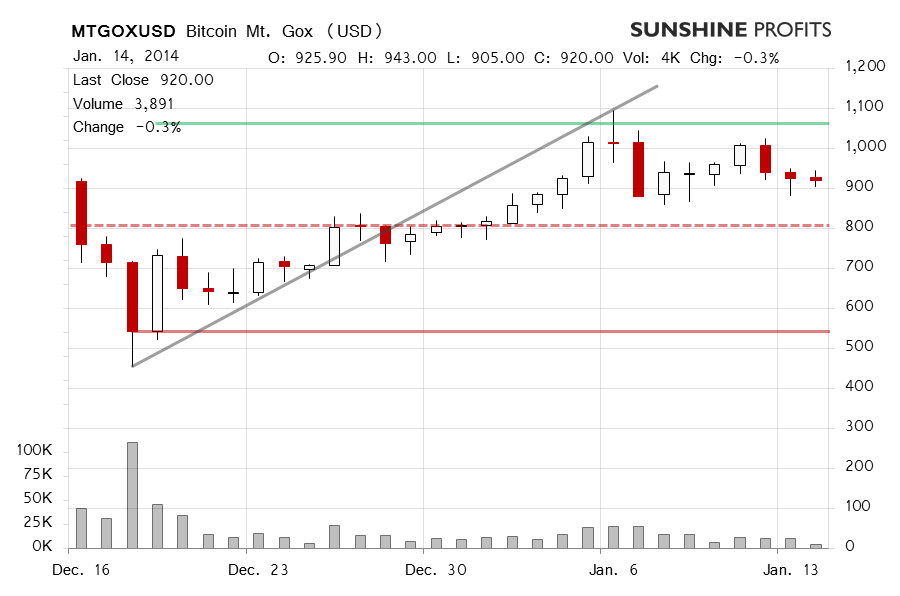
In this setup, the breakdown would be confirmed to an even more significant extent.
But if we draw this line differently, this conclusion will be weakened. Let’s base our line on daily closes, Dec. 18 and Jan. 12.
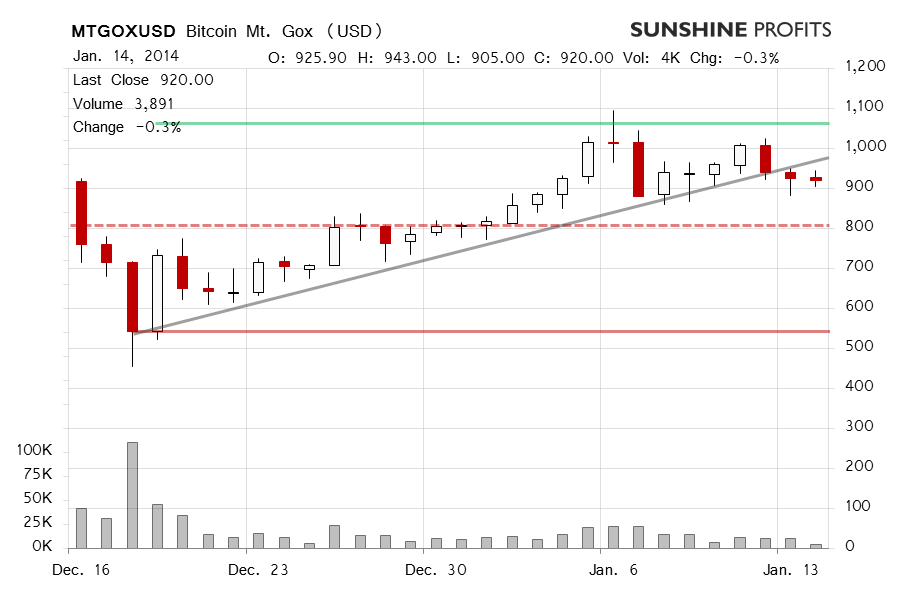
In such an arrangement, we only have two daily closes below the trend line. But this isn’t really the point here.
The point is trendlines are subjective, and that’s why I’m not a big fan of drawing them on each and every chart and discussing their implications. This is even more the case for bitcoin, since this is a relatively young market and applying complicated trendlines or patterns to bitcoin charts might not be sensible. Instead, I focus on closes of recent significant moves and on psychological levels (e.g. $800).
So, even if we have a technical pattern for bitcoin, it doesn’t have to mean much, since: it’s usually extremely subjective, bitcoin is a young market where favorable or unfavorable news could drive the price higher or lower in spite of any chart analysis.
If you don’t believe that some techniques of technical analysis might not be helpful in the bitcoin market, mind that the RSI was above 70 for this market for the most part of November. If you had followed the indications of the RSI, you would have missed out on the period of the meteoric rise in the value of bitcoin.
Q: The Bitcoin chart is the first one I have ever seen, but is it an ETF or can I buy this through a broker? With something like this it is all too easy to be taken for a ride with a scam. What is the best way to buy it?
Q: Do you have an article on how to trade bitcoin, what exchange and what brokerage?
A: Since these two question touch upon the same topic, we’ll reply to them jointly. The charts we post in daily alerts are based on data from Mt. Gox, one of the most prominent bitcoin exchanges. It’s not an ETF, it’s the price you would have to pay on this exchange in dollars for one bitcoin. In this way, it’s more like a forex exchange rate.
There is no “best way to buy”, unfortunately. How you might want to buy bitcoins depends on what your investment objectives are.
If you’re interested in short-term trading, vehicles mimicking the price of bitcoin are OK. Of course, you would have to check the reputation of such an ETF, futures or CFD provider first. Generally, we don’t make specific recommendations regarding providers of such vehicles. Some of the places we’ve heard about include ICBIT (futures), Predictious (options), Plus500 (CFDs). We don’t get any money for mentioning these names, we only provide them as a starting point for your own search of such businesses. You will have to review the reputation of such companies to avoid potential fraud. Also, only experienced traders should open positions in futures, options and CFDs since these instruments are leveraged.
Probably the easiest way to gain short-term exposure to bitcoin would be to buy shares of a bitcoin ETF. A U.S.-based ETF is set to launch this year.
If you’re a long-term investor, ETFs, futures, options and CFDs would not be appropriate investment vehicles as they involve counterparty risk and could not match the price of bitcoin closely enough. This would be particularly painful if bitcoin shot up and your futures didn’t follow or their provider went bankrupt.
The way to go for long-term investors is to actually buy bitcoins. This might involve higher transaction costs (and this is why it might not be the best solution for short-term traders) but you no longer have the risk of your broker going bankrupt. Of course, this approach has its own risks, for instance you would have to make sure your bitcoin wallet (this is a computer program storing your bitcoins) is secure. Bitcoins can be exchanged for other currencies on exchanges such as Mt. Gox, BTC-e, BitStamp and the like.
These two approaches (short- and long-term) may be mixed, and you could keep the long-term part of your portfolio in actual bitcoins while gaining some short-term exposure via other investment vehicles.
Summing up, the recent price action doesn’t justify closing longs, in our opinion and we’re waiting for a spike in volume.
Trading position: long, stop-loss at $800. A move on strong volume in either direction could lead to a change in the suggested position or to a readjustment of the stop-loss level.
This is the last day of the pre-order period for Bitcoin Trading Alerts. The alert tomorrow will be available to our subscribers only, but you still have an option to move to the paid service at reduced price. Sign up for Bitcoin Trading Alerts before the end of the day and you’ll get a 20% discount on your first billing.
You can save $7.99 on the monthly subscription, $21.99 on the quarterly subscription, and $79.99 on the yearly subscription. Additionally, we will extend your subscription period by one week so that the pre-order time doesn’t affect your subscription. It’s 1 month + 1 week, 3 months + 1 week and 12 months + 1 week, all 20% off. Check it out for yourself here:
Bitcoin Trading Alerts – Pre-Sale, 20% Off for Early Birds
This is the last free alert as such. We will keep posting parts of Bitcoin Trading Alerts for free but the core of the service will remain reserved for our subscribers. On this occasion, I would like to thank you for the time you have spent with my messages. Best luck with your investments!
Regards,
Mike McAra
