
This essay is based on the Premium Update posted on November 19th, 2010. Visit our archives for more gold & silver articles.
Its no secret that the U.S. is borrowing too much, that China manipulates its currency and that Europes fiscal troubles are growing at the same time that the luck of the Irish is running out. There does not seem to be any international political will to cooperate to rectify any of these imbalances.
The G-20 meeting in Seoul, South Korea, achieved nothing to improve global imbalances and end the currency conflicts.
Not that we had great hopes.
Is it any wonder that investors are feeling like the other shoe is about to drop? This week European officials, increasingly concerned that the Continents debt crisis will spread, were warning that any new rescue plans may need to cover Portugal as well as Ireland to contain the problem they tried to resolve just six months ago.
And gold? With the $1,400 per ounce mark under its belt, after it corrects, gold will most likely shoot up for the next target and again you will see newspaper headlines saying that gold broke all time highs.
When you see headlines like Gold sets record high on the front page, take it with a grain of salt. As we have pointed out in the past, gold is at a record only if you dont adjust for inflation.
The actual record was set 30 years ago, when the price of gold, in todays dollars, hit more than $6,000 (taking static way to measure inflation into account), or over 340% higher than it closed on Thursday.
The price of gold began rising a decade ago, around the same time that oil prices began rising. Both fell sharply in the 1980s and 1990s, but began to increase around 2000, partly due to economic growth in Asia raising demand for commodities.
When the financial crisis occurred in 2008, oil and gold both fell, although golds fall was milder and it soon began rising again. Over the last two years, it has nearly doubled in price, and with the recent stimulus money flowing (inefficiently, but still) into the economy, the currency war is becoming more tense, as various nations try to save their way out of trouble by holding (or aiming to have) a weak currency. With nations racing for the weakest currency (and also highest inflation), we may see another strong upswing in the price of gold and other precious metals.
However, not necessarily right away. In order to gain additional insight, let's take a look at the charts. This week's free commentary includes several general stock market charts and the one dedicated to describing their influence on the price of the yellow metal. Let's being with the long-term S&P 500 Index chart (charts courtesy of http://stockcharts.com.)
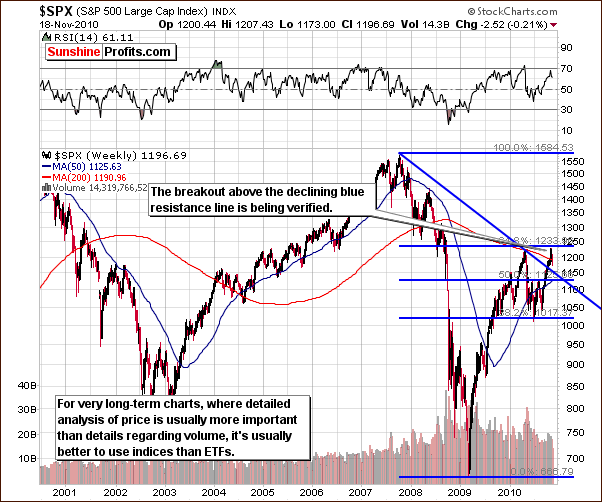
On the above chart we see that a correction to the breakout above the declining trend line (marked above with blue) is underway. The 61.8% Fibonacci retracement level based on 2007 through 2009 has once again provided resistance for the rally. Further slight declines may be seen before the current decline is over and stocks resume their rally - thus finally breaking above the abovementioned resistance (currently at 1233).
Let's zoom in for more details.
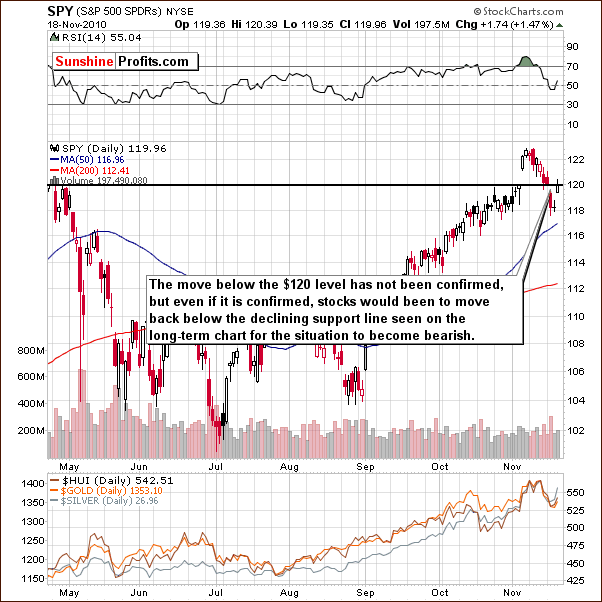
The short-term SPY ETF chart this week shows a level below the previous high of 120, which can be viewed as support at this point. Still, only 2 days fell below this level before an intra-day move back above it (actually, right to it) was seen, so the breakout to the upside has not been invalidated.
Consequently, the bias remains bullish for the main stock indices and - as mentioned a few paragraphs earlier - it will stay bullish even if stocks move lower temporarily as long as they stay above the declining long-term resistance line.
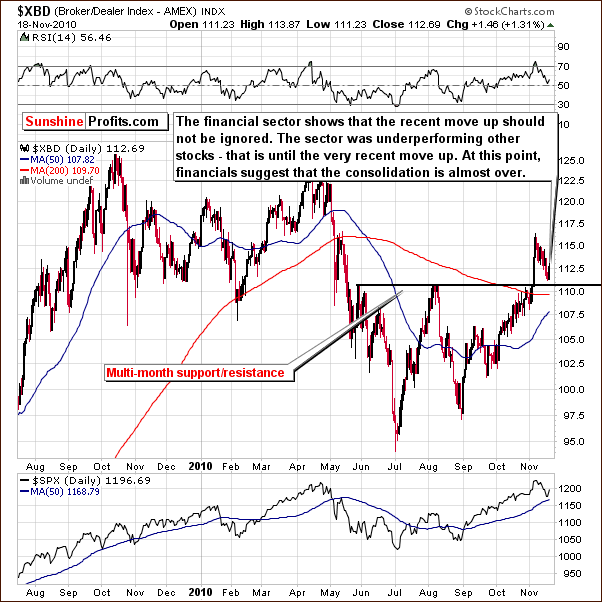
The Broker Dealer Index chart measures the strength of the financial sector. This week it is clear that the breakout above the multi-month resistance level has not yet been verified. It seems likely that further declines from the present 111 level may be seen. It was often the case that the financials lead other stocks, so at this point the fact that they did not move below their important support levels can be viewed as bullish.
So, the situation remains bullish for the main stock indices, and it will continue to be bullish as long as stocks are above their long-term support line marked on the first chart featured in this essay. But what does it mean for gold and silver Investors? Please read the description below the following table for more details.
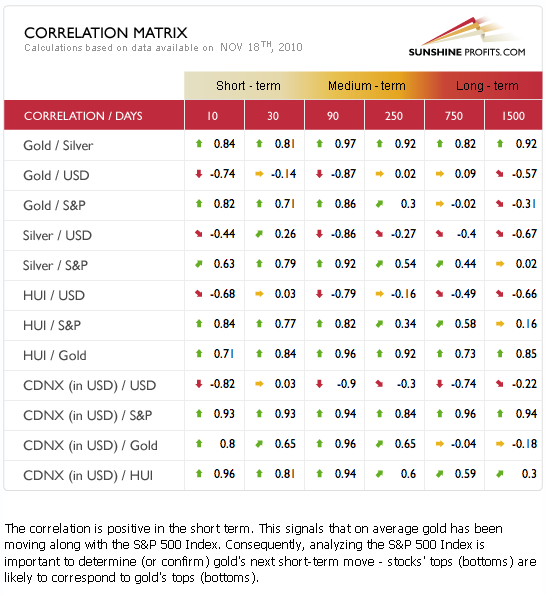
This weeks Correlation Matrix shows that short-term coefficients for gold and the general stock market are similar to those seen for silver and mining stocks (the description is visible above). In other words, bullish news for stocks is bullish for gold, silver and mining stocks as well.
The 30-day column shows that correlations with the USD are mixed. There appears to be a tendency for reversal back to the long-term tendencies - that is the correlations being negative. In other words, it seems that the precious metals sector will once again trade again rise along with dollar's decline.
A local top in the USD Index will likely influence gold, silver and mining stocks in a positive manner. The local bottom seen for metals will likely be followed by a rally. Overall the Correlation Matrix confirms points made earlier in this update and suggest that caution is necessary when the short-term is concerned.
Summing up, the general stock market at this point appears to still be bullish. Currently we are seeing a correction of the breakout above the long-term declining resistance line. It is not clear at this time whether this correction has completed. Strong support level, have not been reached, but they may not need to be reached as the move below the previous high has not been verified.
The implications for precious metals are similar but it is important to note that any declines seen should not be of major concern for long-term investors as long as stocks don't break below their long-term support line. While we have suggested selling a part of the long-term precious metals investments to our Subscribers on Nov 9th, when gold topped, we believe that this capital should be already employed once again and long-term holdings should be repurchased (in fact we suggested doing so on Nov 16th, after gold had moved almost $100 lower). As far as details of this consolidation are concerned (targets), we will leave them to our Subscribers.
To make sure that you are notified once the new features are implemented, and get immediate access to my free thoughts on the market, including information not available publicly, I urge you to sign up for my free e-mail list. Sign up today and you'll also get free, 7-day access to the Premium Sections on my website, including valuable tools and charts dedicated to serious PM Investors and Speculators. It's free and you may unsubscribe at any time.
Thank you for reading. Have a great weekend and profitable week!
P. Radomski
--
Europes fiscal troubles are growing with the luck of the Irish running out, the Feds on the defensive and there is no international political will to cooperate to rectify trade and currency imbalances. All those things are good for gold. What else is good for gold? New figures of gold consumption from India show gold demand in India has increased at an average rate of 13% per year, outpacing the countrys real GDP, inflation and population growth.
With 7 gold charts, we might have called this week's report the Golden Update, instead of a Premium one. All of this ensures that the situation is analyzed thoroughly, and you are up-to-date with the most probable scenario for the following days/weeks. Naturally, we provide also 3 silver and 3 mining stocks charts, which are accompanied this week by additional charts related to the USD and Euro Indices (2 charts) and stocks (3 charts) as well as our improved correlation matrix. Moreover, we include and comment on one of our unique indicators, which has just flashed a signal.
As the influence of the Feds QE2 move continues to impact world markets and new countries surface with crisis situations, we continue to see more surprises and opportunities for wise Investors and Traders to profit if positioned properly. Once again, we will continue to sort it all out for our Subscribers.
We encourage you to Subscribe to the Premium Service today and read the full version of this week's analysis right away.
