
This essay is based on the Premium Update posted on March 19th, 2010. Visit our archives for more gold articles.
In the March 5th commentary, we've summarized that signals coming from the analysis of the PM stocks' charts currently don't give us very precise signals, which may mean that they are to trade sideways for some time instead of making a sharp move in any direction, but there are other signals (...) that we may be near a local top.
Since that time PM stocks managed to correct and rally once again (almost touching the 200-day moving average), and we believe you might appreciate an update on the points made in early March.
Let's begin with the long-term HUI Index (charts courtesy of http://stockcharts.com).
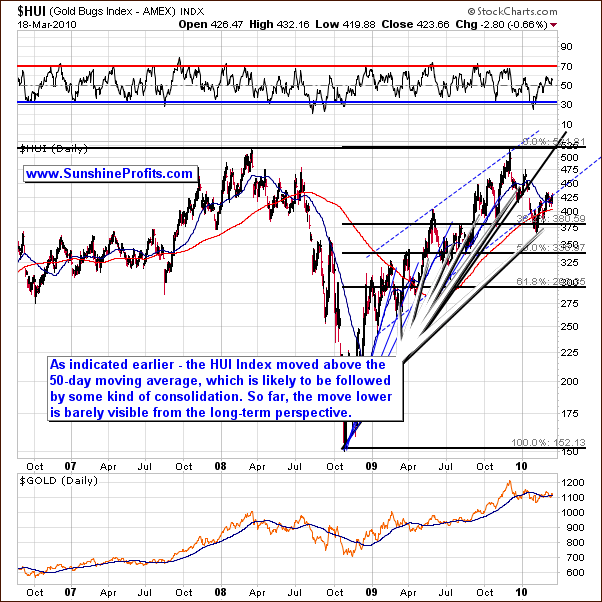
Two weeks ago we mentioned that the analysis of the long-term HUI chart suggests that gold stocks may need to move a little higher before forming a temporary top. In the past, local tops have been formed after HUI Index moved above the 50-day moving average, which hasn't been the case yet. During the past several days, HUI Index has in fact moved above the 50-day moving average, which meant that one might expect a local top to be reached rather sooner than later.
We still don't see a visible move below the 50-day moving average on the long-term chart of the HUI Index, which was the case during previous consolidations, so PM stocks may need to move lower before they are ready to form another sizable rally. Let's take a look at the short-term chart for more details.
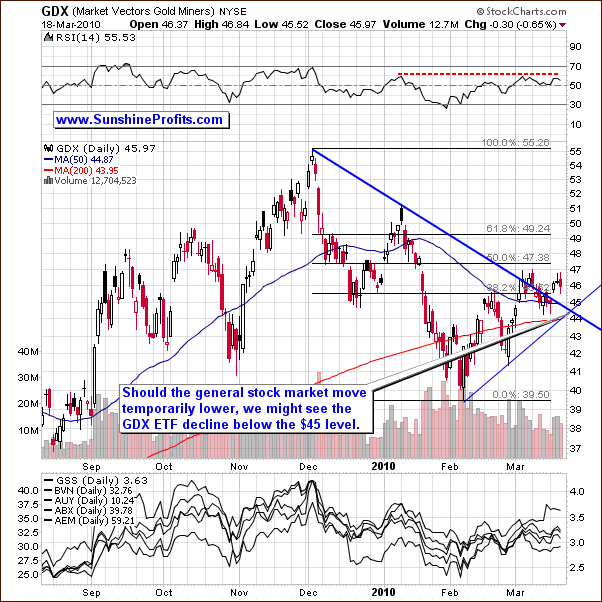
We had 3 consecutive closes in the GDX ETF (proxy for the PM stocks) above the down sloping trend line one should be very careful about taking on a bullish scenario, because of the situation on the general stock market, which is highly correlated with the PM stocks. Additionally, please note that compared to the SPY ETF, PM stocks barely moved higher, which is not a sign of strength on this market.
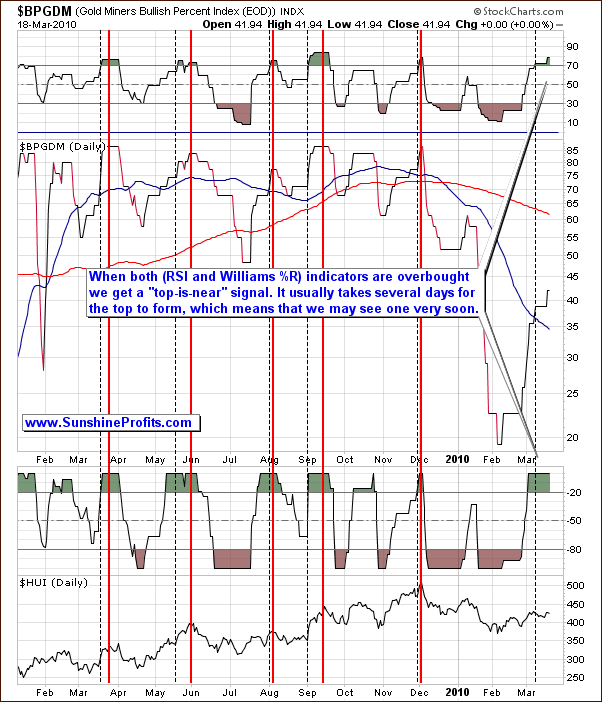
If the stock market starts to reverse and goes to the downside then based on past correlation precious metal stocks should decline as well. Additional confirmation of the points made above comes from the Gold Minders Bullish Percent Index - the market breadth/momentum indicator that is calculated by dividing two numbers: the amount of gold stocks on the buy signal (according to the point and figure chart, which emphasizes strong moves while ignoring small ones) and the amount of all gold stocks in the sector).
In the previous Premium Update we wrote the following:
The high-probability sell signal is given if this index moves higher, and both indicators (RSI and William's %R) used on the above chart become, and then stay overvalued for some time. The initial overbought signal is marked with the vertical dashed black lines, and the top signal is marked with red lines. The overbought signal was given several days ago, so the probability that the top is already in, is relatively high.
As mentioned above, prices declined soon after that. Since Dec 4th 2009, we have not seen the abovementioned signal, but it seems that we are about to see it very soon. The Williams %R indicator is already in the overbought territory, and the RSI Indicator is slightly below the 70 level. Naturally, it didn't go above this level yet, but the situation is risky enough to consider closing out the speculative (!) long positions in the PM sector.
The big news this week is that we have just seen the RSI move above the 70 level, which along with the Williams %R indicator above the 80 level - according to the abovementioned methodology - is a "top-is-near" signal. Therefore, it is a move lower from here that one can expect as far as the PM stocks are concerned, not further gains.
This week, we still have both: the Williams %R and RSI indicators signaling overbought conditions for the index, which means that a local top is likely to be formed very soon - or we that have just seen one.
Consequently, the fate of the precious metal stocks is tied to what happens in other markets particularly the overall stock market. From a technical viewpoint it seems there is a short-term top forming confirmed by the overbought conditions in Williams %R and the RSI in the Gold Miners Bullish Percent Index. When the short-term decline is finally confirmed and then mining stocks rise once again on high volume, we might see another speculative buying opportunity in the metals. The full version of this essay includes 17 detailed charts/tables along with target prices for this decline, so you might want to read it today.
Summing up, the precious metals market appears to be ready to move lower (along with the general stock market) relatively soon, and based on today's (Friday) action it seems that the second part of the correction has just started.
To make sure that you are notified once the new features are implemented, and get immediate access to my free thoughts on the market, including information not available publicly, I urge you to sign up for my free e-mail list. Sign up today and you'll also get free, 7-day access to the Premium Sections on my website, including valuable tools and charts dedicated to serious PM Investors and Speculators. It's free and you may unsubscribe at any time.
Thank you for reading. Have a great weekend and profitable week!
P. Radomski
--
The biggest story this week was that the general stock market managed to move above the the January 2010 high. The breakout was not confirmed yet by all signals, so we take a closer look on each of them end let you know what we believe is likely to take place next - and most of all - how it's likely to influence the value of gold, silver and PM stocks.
The second biggest story this week was the move lower in the USD Index, which closed above its previous trading channel for more than three consecutive days. Again, this week's Premium Update includes our comments on how it might influence portfolios of PM Investors and Speculators.
This Update is an extensive follow-up on the Market Alert that we've sent on Wednesday, and it features 4 charts dedicated to the general stock market (including the Dow Jones Transportation Average), 2 charts of the USD Index, 2 gold charts, 4 silver charts (including two very-long-term charts providing targets for the coming decline), and 2 charts dedicated to PM stocks. Moreover, we've analyzed charts of the Gold Miners Bullish Percent Index, and Platinum - both of them provide us with important signals. Additionally, we feature the Trix indicator that used to provide major buy signals and comment on what it tells us today. We encourage you to Subscribe to the Premium Service today and read the full version of this week's analysis right away.
